MACROECONOMY & END-USE MARKETS
Running tab of macro indicators: 15 out of 20
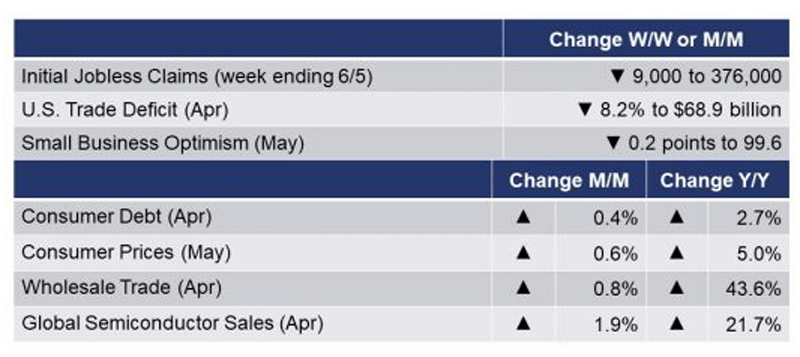
The number of new jobless claims fell by 9,000 to 376,000 during the week ending 5 June, the lowest level since 14 March 2020. Continuing claims fell by 258,000 to 3.499 million and the unemployment rate for the week ending 29 May fell 0.2 points to 2.5%.
Consumer prices increased 0.6% in May, and were up 5.0% Y/Y, the largest increase since August 2008. The May increase was led by higher prices for used cars and trucks, household furnishings and operations, new vehicles, airline fares, and apparel as well as food, electricity and natural gas. Some prices (gasoline, medical care, etc.) fell during the month. Consumer prices excluding food and energy (so-called core consumer prices) rose 0.7% during the month, and were up 3.8% Y/Y, the highest comparison since June 1992. Note that the combined 2.0% jump in core CPI over the past three months is equivalent to an 8.3% annual growth rate, which has nothing to do with base year effects.
Wholesale trade continued to expand in April, up 0.8%. Gains across most durable segments were offset by lower wholesales of petroleum products, farm products, and pharmaceuticals. Wholesale inventories also continued to expand, up 0.8% with gains across most segments. Inventories were 5.2% Y/Y higher than a year ago while sales were up by 43.6% Y/Y. The inventories-to-sales ratio remained stable at 1.22 compared to the prior month but was down from last April’s cycle-high ratio of 1.66.
The U.S. trade deficit in goods and services was down $6.1 billion (or 8.2%) in April to $68.9 billion as exports grew 1.1% and imports fell by 1.4%. Signaling strength in U.S. economy and global manufacturing, U.S. exports of goods ($145.3 billion) were the highest on record including record exports of industrial supplies and materials. April imports of capital goods were also a record high. U.S. trade in autos and parts was down, reflecting ongoing supply chain challenges. Imports of consumer goods fell overall but imports of cell phones and other household goods grew. Travel and transport services rose in April. The deficit with China in goods trade decreased to $32.4 billion as exports rose by $1.0 billion and US imports of Chinese goods decreased by $6.0 billion.
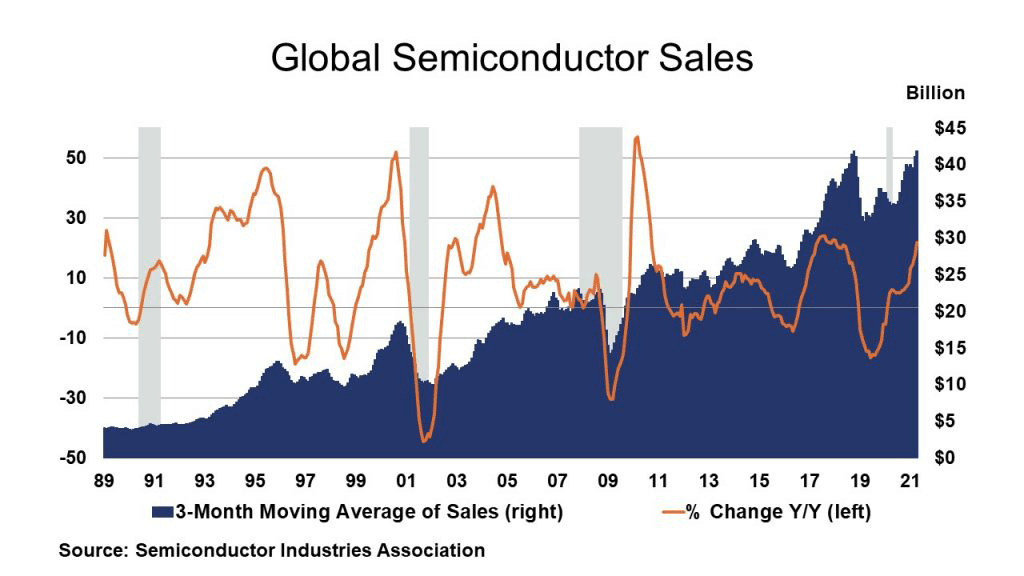
With gains in all regions, global semiconductor sales rose 1.9% to $41.8 billion in April, leaving sales up 21.7% Y/Y. Sales gained across a range of products and were up across all regions compared to a year ago. The Semiconductor Industries Association released its semi-annual forecast, and now projects annual global sales will increase 19.7% in 2021 and 8.8% in 2022.
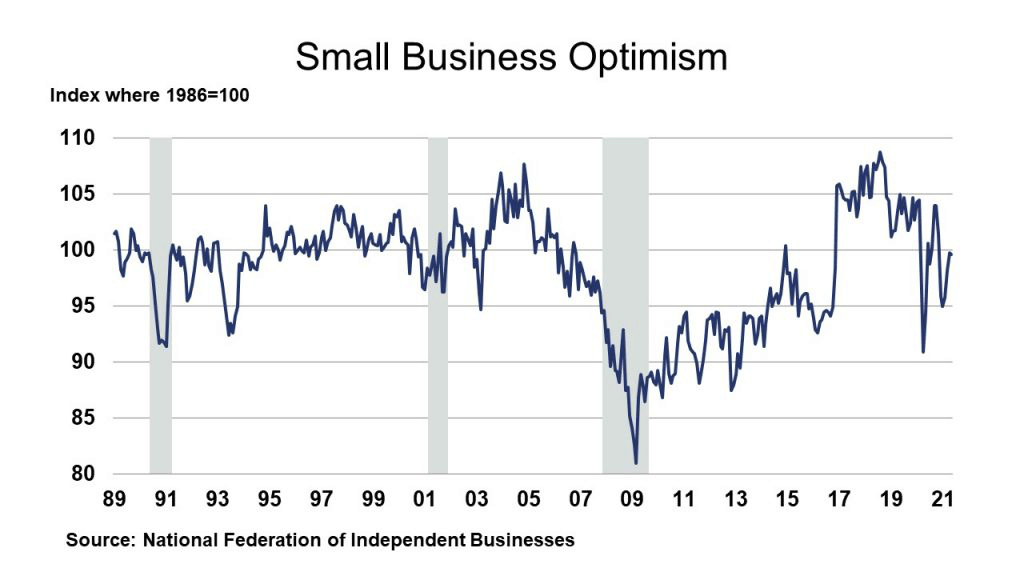
The NFIB index of small business optimism for May eased 0.2 points to 99.6 and follows three monthly increases. Five of the 10 index components improved, three declined and two were unchanged. A nationwide labor shortage and inflation worries weighed on business owners’ economic outlook.
ENERGY
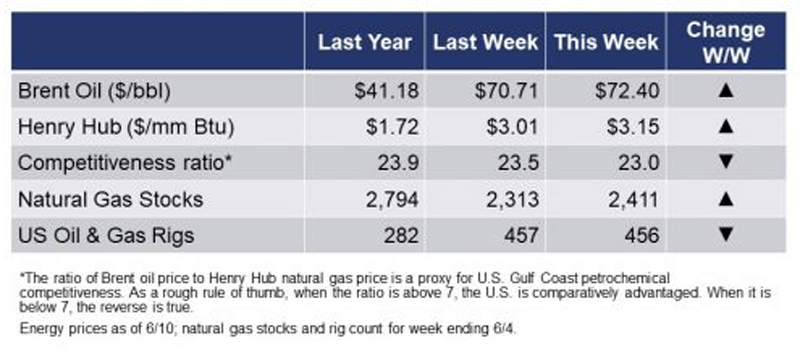
The rig count fell by one to 456 rigs during the week ending 4 June. Oil markets were affected by rumors of Iranian oil once again entering the market.
CHEMICALS
For the business of chemistry, the indicators still bring to mind a green banner for basic and specialty chemicals.
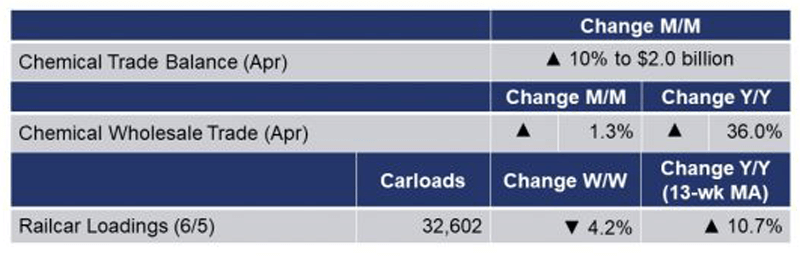
According to data released by the Association of American Railroads, chemical railcar loadings, the best ‘real time’ indicator of chemical industry activity, fell by 4.2% to 32,602 railcars the week ending 5 June (week 22). Loadings were up 16.9% Y/Y, indicative of last year’s COVID-related closures, and up 4.3% YTD/YTD. The 13-week moving average, which is used to smooth out volatility, was up 10.7%.
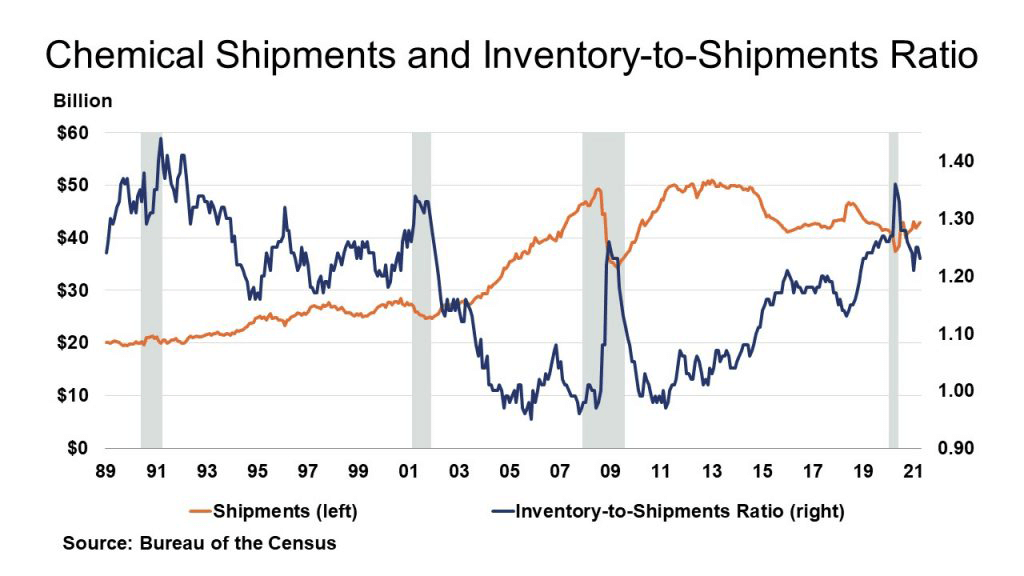
Wholesale sales of chemical products continued to expand in April, up 1.3% to $11.2 billion. Inventories also continued to rise, up another 2.1% for the month. Compared to April 2020, inventories were up 2.5%Y/Y while sales were up 36.0% Y/Y. The inventories-to-sales ratio ticked higher to 1.11 compared to the prior month but was much lower than the 1.46 ratio last April.
U.S. chemical exports were down by about 1% in April to $12.6 billion. Exports were up 26% Y/Y and 9% YTD/YTD, however. April exports were down in most sectors with the exception of bulk petrochemicals and intermediates, synthetic fibers and other specialties. Chemical imports fell 3% in April to $10.5 billion but were up 28% Y/Y and up 15% YTD/YTD. Imports were down in most sectors but rose in plastic resins, agricultural chemicals, synthetic rubber, and adhesives and sealants. The U.S. chemical trade surplus expanded in April to $2.0 billion driven by strength in bulk petrochemicals and intermediates and other specialties.
Note On the Color Codes
The banner colors represent observations about the current conditions in the overall economy and the business chemistry. For the overall economy we keep a running tab of 20 indicators. The banner color for the macroeconomic section is determined as follows:
Green – 13 or more positives
Yellow – between 8 and 12 positives
Red – 7 or fewer positives
For the chemical industry there are fewer indicators available. As a result we rely upon judgment whether production in the industry (defined as chemicals excluding pharmaceuticals) has increased or decreased three consecutive months.
For More Information
ACC members can access additional data, economic analyses, presentations, outlooks, and weekly economic updates through MemberExchange.
In addition to this weekly report, ACC offers numerous other economic data that cover worldwide production, trade, shipments, inventories, price indices, energy, employment, investment, R&D, EH&S, financial performance measures, macroeconomic data, plus much more. To order, visit http://store.americanchemistry.com/.
Every effort has been made in the preparation of this weekly report to provide the best available information and analysis. However, neither the American Chemistry Council, nor any of its employees, agents or other assigns makes any warranty, expressed or implied, or assumes any liability or responsibility for any use, or the results of such use, of any information or data disclosed in this material.
Contact us at ACC_EconomicsDepartment@americanchemistry.com
Upcoming Events of Interest
“Specialty & Agro Chemicals America”
8-10 September 2021
Belmond Place | Charleston, SC
Chemicals America, Inc.
https://charleston.chemicalsamerica.com/
“Americas Chemicals and Polymers Conference” Virtual Event
14-15 September 2021
Wood Mackenzie
https://www.woodmac.com/events/americas-chemicals-and-polymers-conference