MACROECONOMY & END-USE MARKETS
Running tab of macro indicators: 14 out of 20
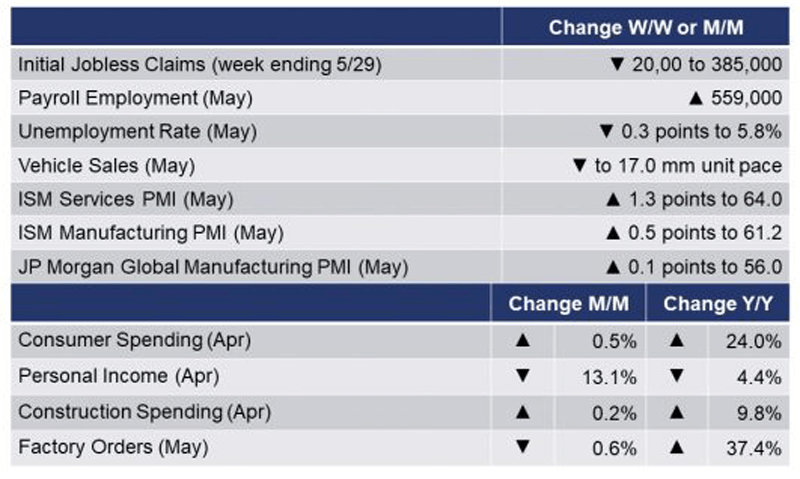
The number of new jobless claims fell by 20,000 to 385,000 during the week ending 25 May, the lowest level since 14 March 2020. Continuing claims rose by 169,000 to 3.771 million and the unemployment rate for the week ending 22 May gained 0.1 points to 2.7%.
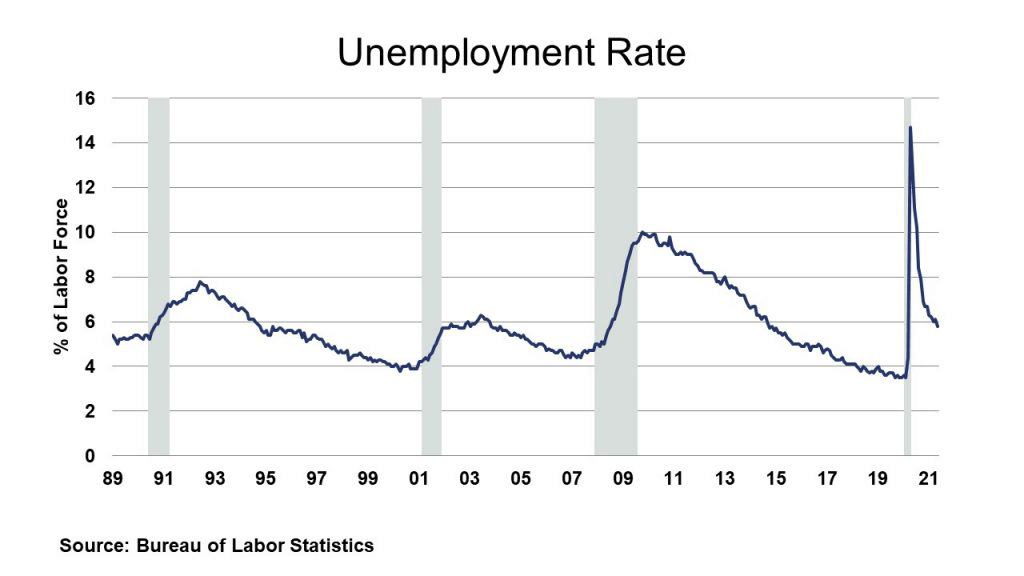
Non-farm payrolls rose by 559,000 in May, slightly below expectations. Notable job gains occurred in leisure and hospitality, in public and private education, and in health care and social assistance. Manufacturing employment gained but was largely offset by a decline in construction jobs. Average hourly wages for non-supervisory production workers were up 2.4% Y/Y, but including additional working hours, weekly earnings were up 3.0% Y/Y. The unemployment rate eased 0.3 points to 5.8%, a little better than expected. The labor force participation rate was little changed at 61.6% in May and has remained within a narrow range of 61.4% to 61.7% since June. The participation rate is 1.7 percentage points lower than in February 2020. The median duration of unemployment eased for the second month.
Following a stimulus-fueled 4.7% gain in March, consumer spending rose 0.5% in April as more pandemic restrictions were relaxed. April’s gain included a shift in spending toward services, a category that saw steep declines during the pandemic. Personal income fell 13.1% in April following a 20.9% surge in March that reflected stimulus payments under the American Rescue Plan. The Fed’s preferred measure of inflation, the PCE price index, surged by 0.6% with the core price index up by 0.7% for the month. Compared to a year ago, the headline PCE price index was up 3.6% Y/Y while core prices were up 3.1% Y/Y. Both measures were well above the Fed’s target of around 2%.
Construction spending edged higher by 0.2% in April, following a revised gain in March. As has been the trend in recent months, strong gains in spending on residential projects (both new build and improvements) offset declines in both publicly and privately funded projects. Compared to a year ago (during the height of the lockdowns), construction spending was up 9.8% Y/Y.
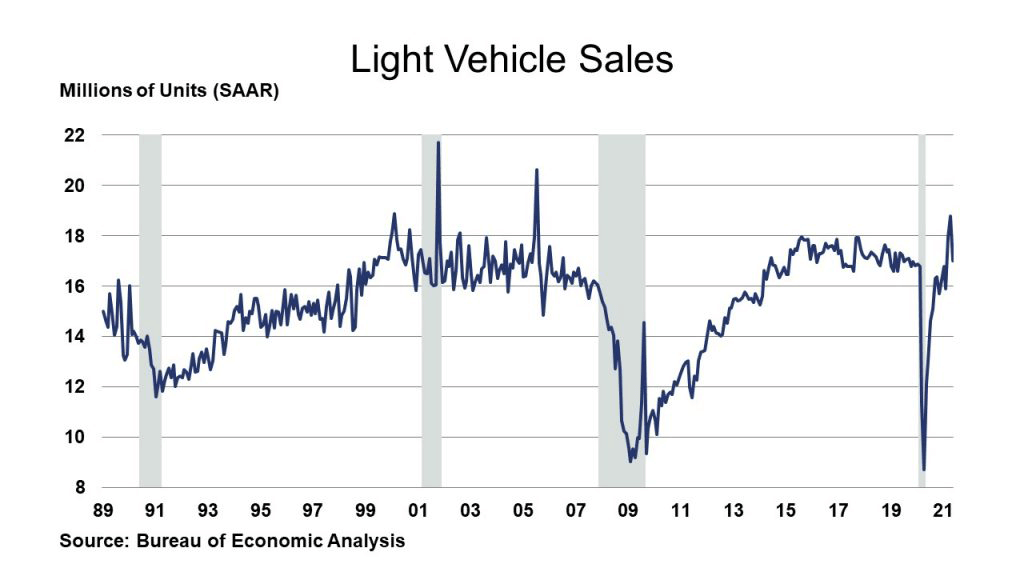
With limited inventories, higher selling prices and fading stimulus monies, light vehicle sales fell from a 18.8 million unit pace in April to a 17.0 million unit pace in May. There was weakness was across multiple segments and location of production. That said, this is still a very good level of sales. Inventory constraints from the semiconductor shortage will remain a headwind for some time. Sales were up 40.3% Y/Y.
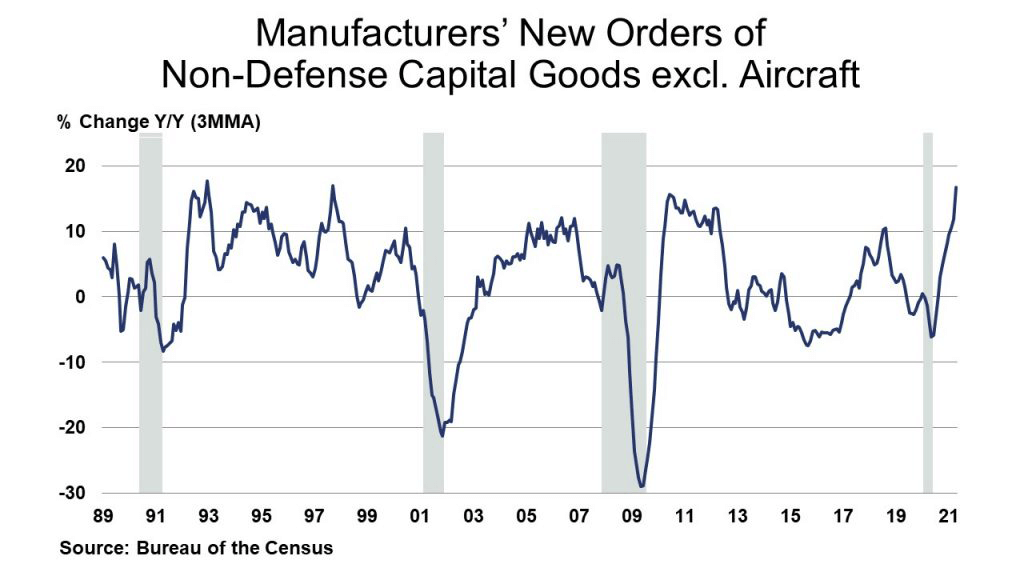
Factory orders fell 0.6% in April, the first decline in a year. Orders for core goods (non-defense capital goods excluding aircraft), continued to gain, however, up 2.2%. The strongest gains were in civilian aircraft, industrial machinery, and aluminum. Compared to April 2020, factory orders were up 37.4% while core orders were up 27.0% Y/Y. Unfilled orders (a measure of the manufacturing pipeline) continued to expand by 0.2%. Factory shipments rose 0.4% and inventories were up 0.3%. The inventories-to-sales ratio remained stable at 1.48 (compared to March), down from a whopping 1.83 a year ago during the height of the lockdowns.
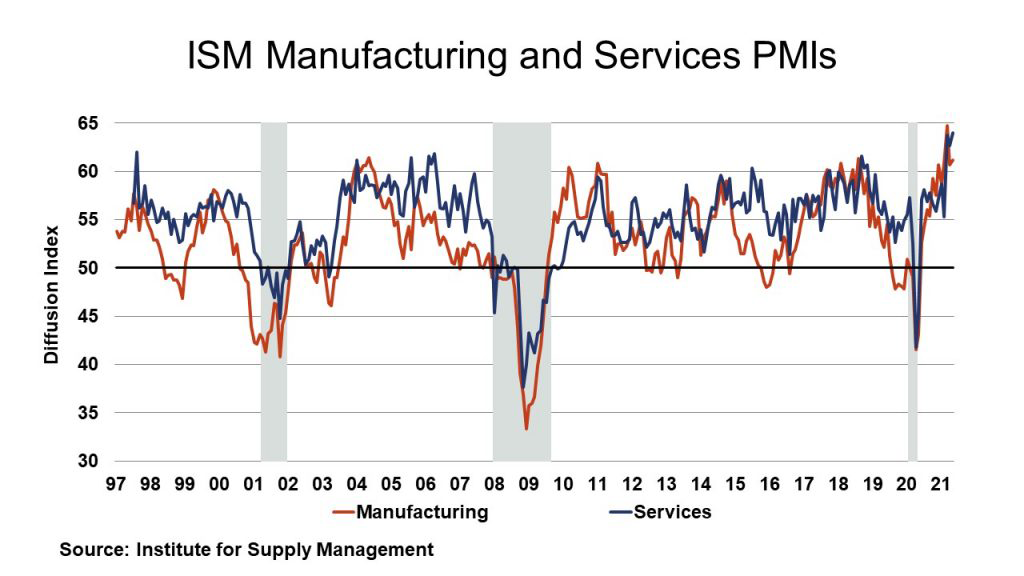
The ISM PMI for services rose 1.3 points to 64.0% in May, with business activity/production, new orders, and order backlogs rising at a faster pace. Employment rose. Supplier deliveries continued to slow at a faster rate of decline which suggests supply chains are tightening. Prices paid increased at a faster pace to a level last seen in July 2008. All 18 services industries gained. The ISM PMI for manufacturing rose 0.5 points to 61.2% in May, a strong showing. New orders, production and employment are all growing. Supplier deliveries are slowing at a faster pace and the backlog is growing. Raw materials inventories are growing, and customers’ inventories are deemed too low. Exports and imports are growing, and prices paid are increasing, the latter adding to the inflation narrative. Sixteen of the 18 industries are expanding. In general survey respondents reported that their companies and suppliers continue to struggle to meet increasing levels of demand. The JP Morgan Global Manufacturing PMI rose 0.1 points to 56.0% in May. Production rose at one of the fastest rates in a decade, as new order growth accelerated to an 11-year high. The outlook remained positive, with manufacturers forecasting further increases in output over the next 12 months. Twenty-four out of the 30 nations for which May data were available registered better business conditions.
Texas is the largest state for chemical industry manufacturing and the Dallas Fed reported that Texas factory activity expanded but at a slower pace in May. The production index, a key measure of state manufacturing conditions, fell 18 points to 15.7, a reading still well above average and indicative of healthy output growth. Other measures of manufacturing activity also pointed to slower but still-solid growth this month.
The Federal Reserve released its latest Beige Book – an assessment of economic conditions across the 12 Federal Reserve Districts. The national economy expanded at a moderate pace from early April to late May, a somewhat faster rate than the prior reporting period. Several Districts cited the positive effects on the economy of increased vaccination rates and relaxed social distancing measures, while they also noted the adverse impacts of supply chain disruptions. The effects of expanded vaccination rates were perhaps most notable in consumer spending in which increases in leisure travel and restaurant spending augmented ongoing strength in other spending categories. Light vehicle sales remained solid but were often cons trained by tight inventories. Factory output increased further even as significant supply chain challenges continued to disrupt production. Manufacturers reported that widespread shortages of materials and labor along with delivery delays made it difficult to get products to customers. Similar challenges pers is ted in construction. Homebuilders often noted that strong demand, buoyed by low mortgage interest rates, outpaced their capacity to build, leading some to limit s ales. Nonresidential construction increased at a moderate pace, on balance, even as contacts in several Districts said that supply chain disruptions pushed costs higher and, in some cases, delayed projects. Demand for professional and business services increased moderately, while demand for transportation services (including at ports) was exceptionally strong. Lending volumes increased modestly, with gains in both household and business loans. Overall, expectations changed little, with contacts optimistic that economic growth will remain solid. The report went on to note that it remained difficult for many firms to hire new workers, especially low-wage hourly workers, truck drivers, and skilled tradespeople. Contacts expected that labor demand will remain strong, but supply constrained, in the months ahead.
ENERGY
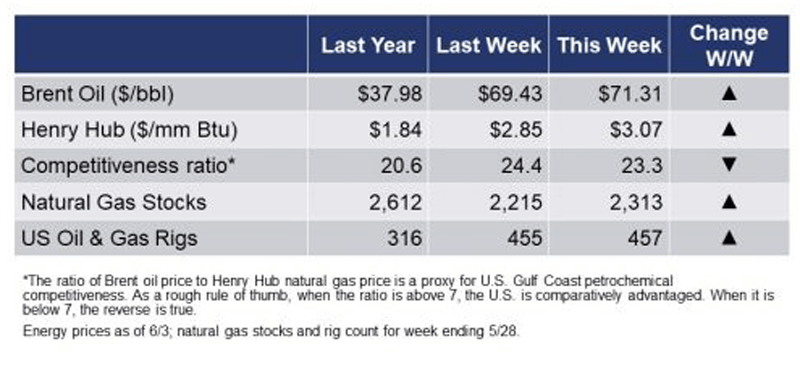
The rig count rose by two to 457 rigs during the week ending 28 May. With rising demand, Brent oil reached $70 per barrel for the first time since January last year.
CHEMICALS
For the business of chemistry, the indicators still bring to mind a green banner for basic and specialty chemicals.
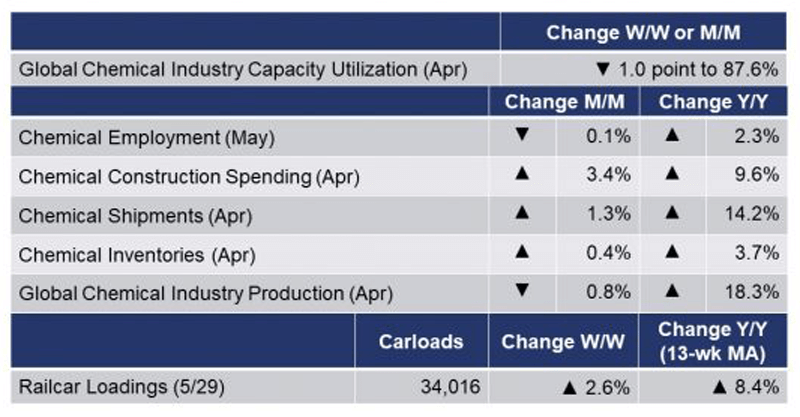
According to data released by the Association of American Railroads, chemical railcar loadings, the best ‘real time’ indicator of chemical industry activity, by 2.6% to 34,016 railcars the week ending 29 May (week 21). Loadings were up 27.4% Y/Y, indicative of last year’s COVID-related closures, and up 3.7% YTD/YTD. The 13-week moving average, which is used to smooth out volatility, was up 8.4%.
Chemical industry (including pharma) employment edged lower, down by 1,100 (0.1%) in May, following a 3,400 gain in April. Compared to last May (during the lockdowns), employment remained higher by 18,500 (2.3%). Production worker jobs continued to gain by 0.3% in May, but supervisory and non-production employment fell by 0.9%. Average wages were up 1.8% Y/Y to $26.78. The average workweek edged up by 0.1 hours. Combined with the gain in production workers, the total labor input into the chemical industry edged higher by 0.6%, suggesting chemical production expanded in May consistent with the ISM report.
The details in the ISM report indicate that the chemical industry expanded. New orders and production are growing but the report indicated that employment decreased. Supplier deliveries are slowing at a faster pace and the order backlog is growing. Raw materials inventories are growing, and customers’ inventories are deemed too low. Exports and imports are growing. One chemical industry respondent noted that “Changes in currency exchange rates favorably contributed to our quarterly performance. Continued strong consumer demand for our high-quality products also provided increased sales.” Comments from the May Dallas Fed survey on manufacturing:
- “Current production volumes and sales are at a very high level due to impacts from the freeze event that we recovered from much faster than our competitors.”
- “We continue to see the effects of component shortages.”
- “Decreasing COVID-19 restrictions will increase demand. The variability of raw materials for our business and other raw materials for our customers continues to drive variability in demand.”
And the Federal Reserve’s Beige Book noted that “petrochemical production has mostly recovered from Winter Storm Uri outages, but supply chain disruptions were likely to persist through yearend 2021.”
The benchmark S&P 500 index rose by 0.5% in April. Chemical equity prices, as measured by the S&P index for chemical companies also ended higher, up 3.6% for the month. Equity prices are often a good indicator of future activity and represent one component of the leading economic indicators. Compared to the beginning of the year, chemical equities were up 16.2% while the S&P 500 index was up 11.9% year-to-date. Chemical industry construction spending rose by 3.4% in April to $32.3 billion, following a revised gain in March. Chemical industry construction spending was ahead by 9.6% Y/Y compared to April 2020. As a share of overall spending on manufacturing construction, chemicals represented 44.9%.
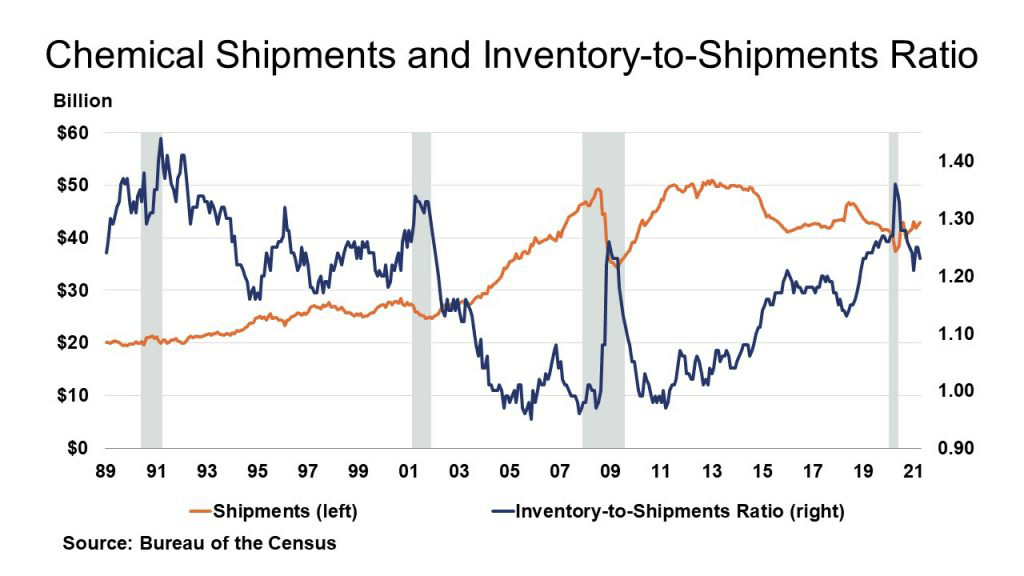
Chemical industry shipments rose 1.3% to $42.83 billion in April and follows a 1.0% gain in March. This left shipments up 14.2% Y/Y. Inventories rose 0.4% in April and follows a 0.7% gain in March. Gains in most segments (sans coatings & adhesives) left inventories up 3.7% Y/Y. this pushed the inventory to sales ratio down to 1.23 in April, a level well off 1.36 a year ago. Inventories are lean.
Despite improving activity across many nations, our Global Chemical Production Regional Index (Global CPRI) shows that global chemicals production fell 0.8% in April and follows a 0.3% easing in March. During April, chemical production increased in Europe and Africa & the Middle East. Output was weak elsewhere. Headline global production was up 18.3% year-over-year (Y/Y) on a 3MMA basis. Keep in mind that output a year ago was off due to the Covid-19 pandemic. Global output stood at 130.4% of its average 2012 levels.
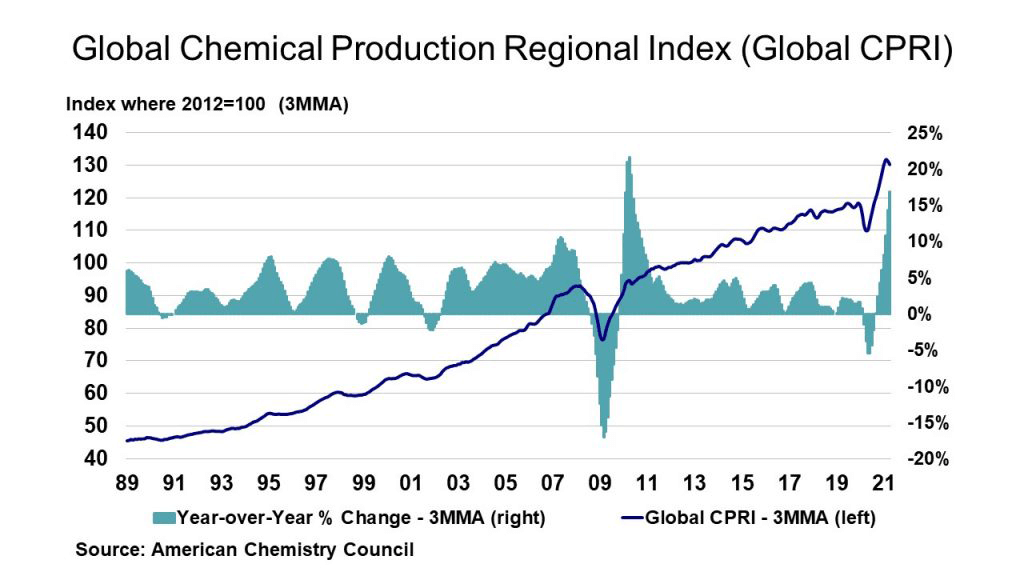
During April, global capacity rose 0.2% and was up 2.1% Y/Y. As a result, with easing output, capacity utilization in the global chemical industry fell back 1.0 points to 87.6%. This is well above 75.6% last April and above the long-term (1987-2019) average of 86.3%.
Among chemical industry segments, April results were largely negative with gains limited to synthetic rubber, manufactured fibers, and coatings. Considering year-earlier comparisons, production gains occurred in all segments.
Note On the Color Codes
The banner colors represent observations about the current conditions in the overall economy and the business chemistry. For the overall economy we keep a running tab of 20 indicators. The banner color for the macroeconomic section is determined as follows:
Green – 13 or more positives
Yellow – between 8 and 12 positives
Red – 7 or fewer positives
For the chemical industry there are fewer indicators available. As a result we rely upon judgment whether production in the industry (defined as chemicals excluding pharmaceuticals) has increased or decreased three consecutive months.
For More Information
ACC members can access additional data, economic analyses, presentations, outlooks, and weekly economic updates through MemberExchange.
In addition to this weekly report, ACC offers numerous other economic data that cover worldwide production, trade, shipments, inventories, price indices, energy, employment, investment, R&D, EH&S, financial performance measures, macroeconomic data, plus much more. To order, visit http://store.americanchemistry.com/.
Every effort has been made in the preparation of this weekly report to provide the best available information and analysis. However, neither the American Chemistry Council, nor any of its employees, agents or other assigns makes any warranty, expressed or implied, or assumes any liability or responsibility for any use, or the results of such use, of any information or data disclosed in this material.
Contact us at ACC_EconomicsDepartment@americanchemistry.com