MACROECONOMY & END-USE MARKETS
Running tab of macro indicators: 11 out of 20
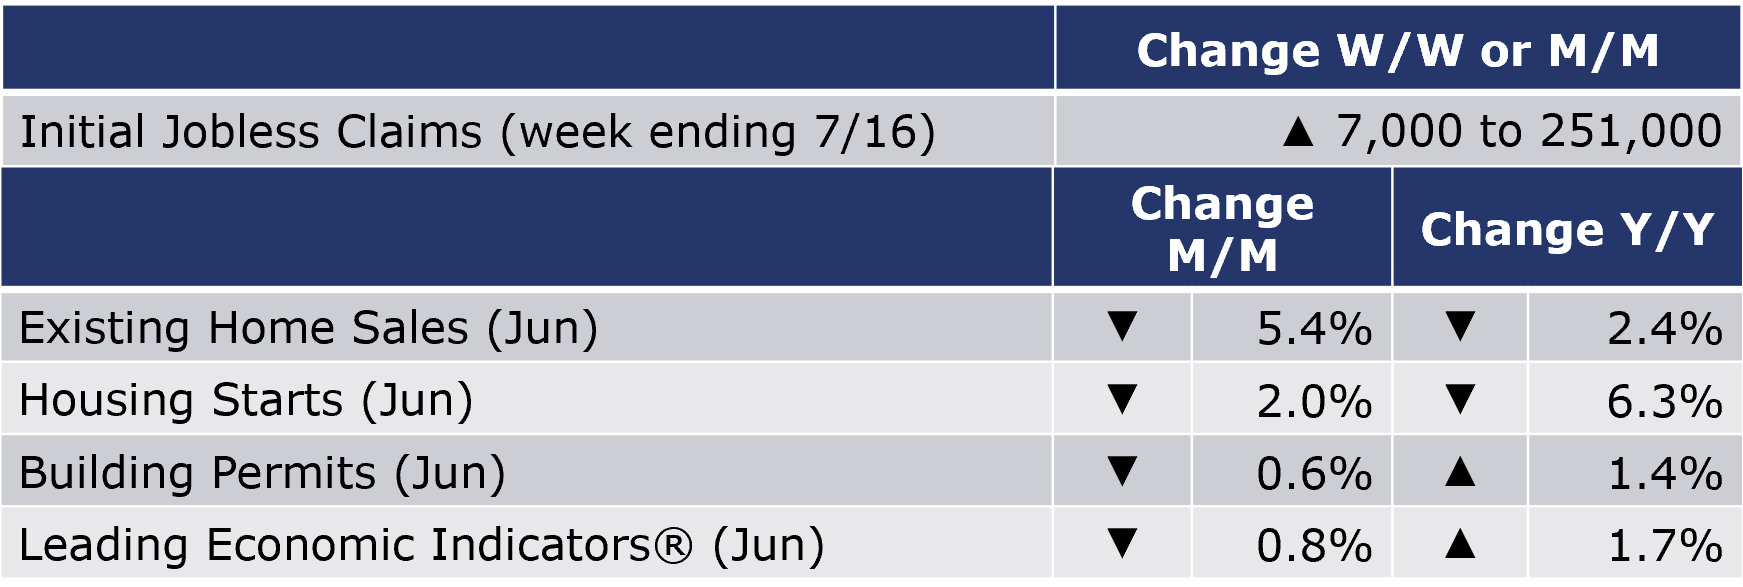
The number of new jobless claims was up by rose by 7,000 to 251,000 during the week ending 16 July. Continuing claims increased by 51,000 to 1.38 million, and the insured unemployment rate for the week ending 9 July was up to 1.0%.
As widely expected, existing home sales fell 5.4% in June to a 5.12 million seasonally adjusted annual pace. This was the weakest rate since June 2020 and was 14.2% lower than a year ago. Inventories rose 9.6% to 1.26 million homes for sale or under contract, a level off 2.4% Y/Y. The level of inventories represents a lean 3.0-month supply. With historically lean inventories, the median sales price continued to rise, up 13.4% Y/Y (124 straight months of a year-over-year increase) to a record $416,000.
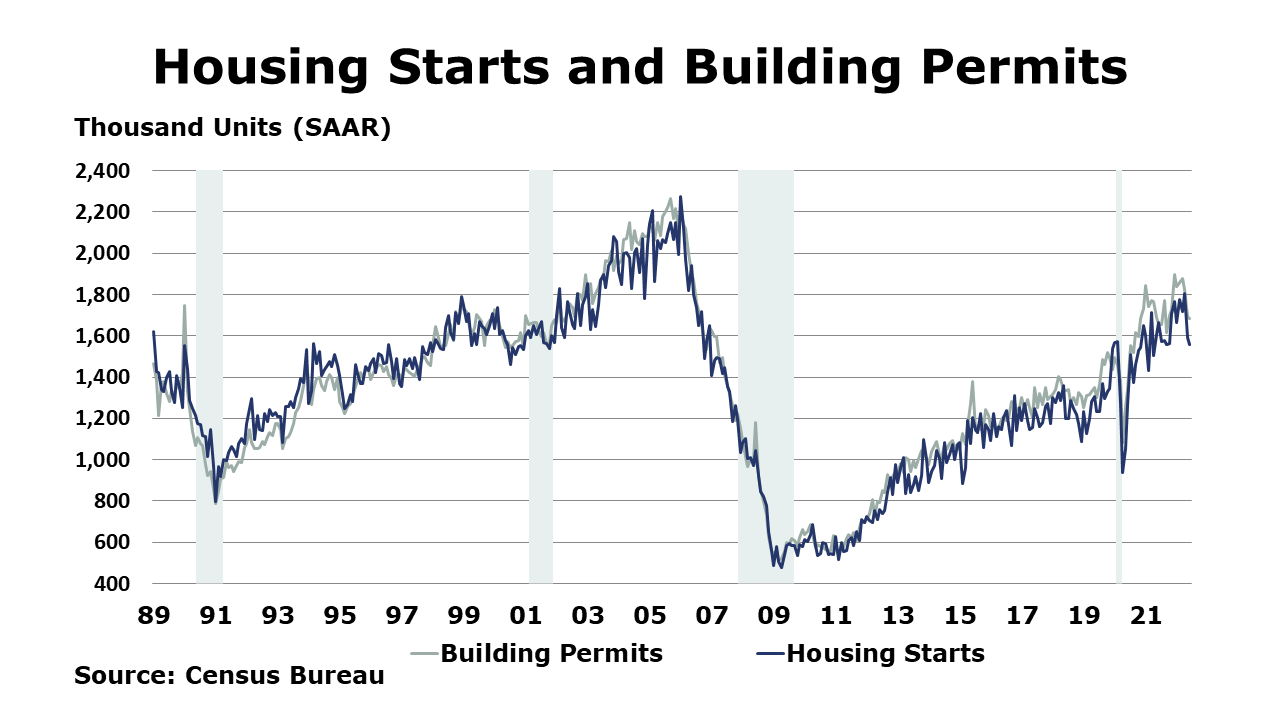
Housing starts unexpectedly fell 2.0% to a nine-month low in June, though data for April and May were revised higher. Chemistry-intensive single-family starts fell 8.1% to their lowest level in nearly two years. Multi-family starts rose strongly, however, as higher mortgage rates and high home prices have priced many potential home buyers out of the single-family market. Forward-looking building permits continued to slide (down 0.6%), with the largest declines in single-family. Compared to a year ago, permits were up 1.4% Y/Y (single-family permits down 11.4% Y/Y) and housing starts were off 6.3% Y/Y (single-family starts down 15.7% Y/Y). As affordability has become increasingly constrained due to high home prices and high mortgage rates, homebuilder confidence collapsed in July, falling 12 points to 55, its lowest level in two years. The NAHB/Wells Fargo Housing Market Index (HMI) saw sharp declines in current sales activity, future sales activity, and current traffic of prospective homebuyers.
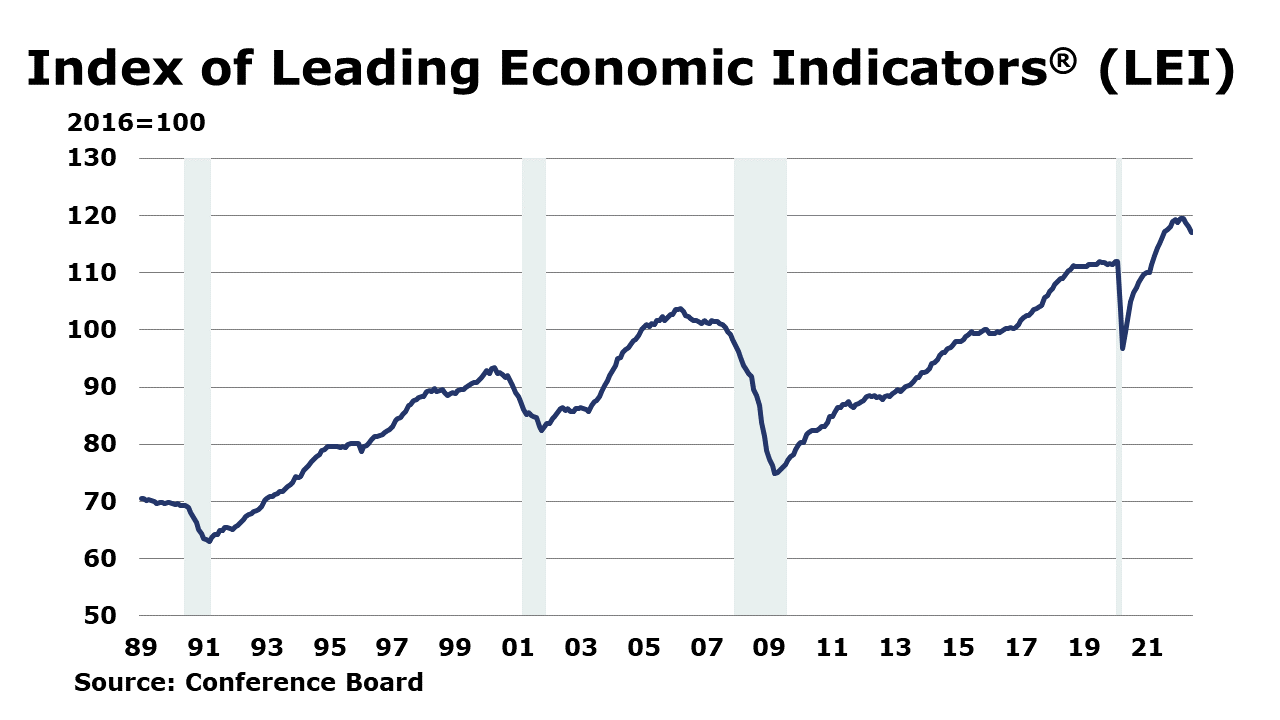
The Conference Board’s Index of Leading Economic Indicators (LEI) fell 0.8% in June, following a revised 0.6% decline in May. It was the fourth consecutive month of decline and suggests economic growth is slowing further in the near-term as recession risks increase. The decline in June was led by weaker consumer sentiment, moderating labor market conditions, lower stock prices, and a deceleration in new orders. Compared to a year ago, the LEI was up 1.7% Y/Y
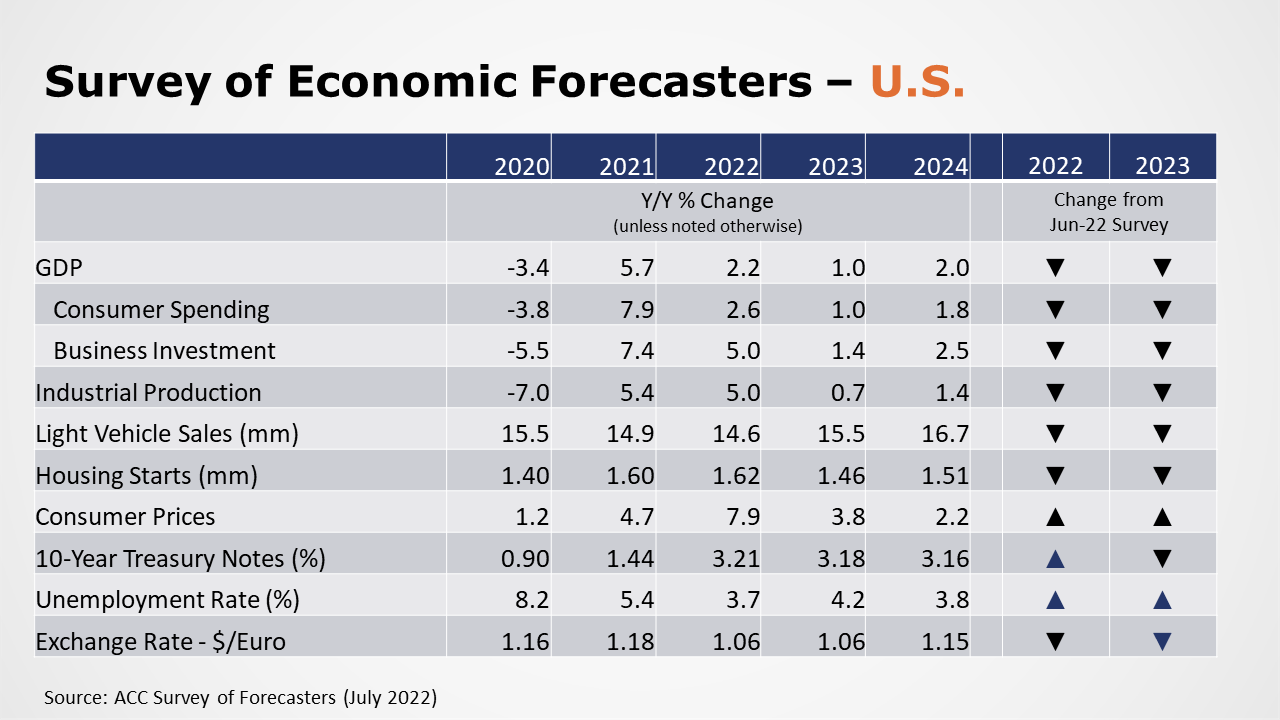
SURVEY OF ECONOMIC FORECASTERS
- The outlook for 2022 and 2023 continues to weaken as expectations rise for more aggressive interest rate hikes as the Fed seeks to get inflation under control. Momentum from the first half of the year gives way to much slower growth in the second half of the year and into 2023.
- U.S. GDP is expected to grow by 2.2% in 2022 as the highest inflation in decades erodes spending and higher interest rates raise borrowing costs. In 2023, forecasters continue to expect U.S. to grow by 1.0%, well below its long-term trend.
- Consumer spending is expected to slow to a 2.2% in 2022 before slowing further to a 1.0% gain in 2023.
- Business fixed investment will be a larger contributor to GDP growth in 2022 with an expected 5.0% gain. In 2023, growth in business investment slows to 1.4%.
- Industrial production, is expected to rise 5.0% in 2022 and 0.7% in 2023.
- With continued supply chain challenges for vehicle manufacturers, expectations for light vehicle sales were lowered again to 14.6 million in 2022 and rising to only 15.5 million in 2023, well below pre-Covid levels.
- Expectations for housing starts were pared down to 1.62 million in 2022, and lowered to 1.46 million in 2023.
- The unemployment rate is expected to average 3.7% in 2022 and 4.2% in 2023.
- Inflation has continued to accelerate. Expectations for gains in consumer prices continued to grow compared to last month’s assessment with forecasters looking for inflation of 7.9% in 2022, before easing to a 3.8% pace in 2023.
- Compared to last month, expectations for interest rates (10-year Treasury) continued to move higher for 2022, as the Fed implements aggressive tightening, but lower for 2023 as expectations for a downturn build.
ENERGY

Oil prices eased this week as Covid restrictions were put in place in several Chinese cities which dampened demand expectations. At the same time Libya restarted some production. Natural gas prices were up sharply during the week as sweltering weather bakes much of the U.S., boosting natural gas demand for power. The combined oil and gas rig count rose by two to 752.
CHEMICALS
For the business of chemistry, the indicators still bring to mind a green banner for basic and specialty chemicals.
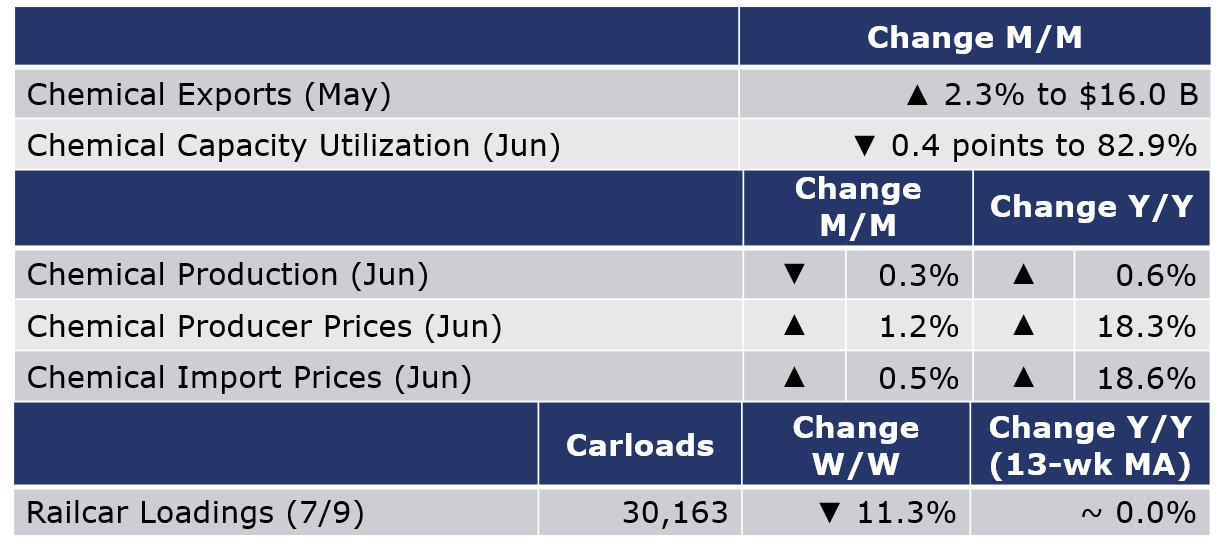
According to data released by the Association of American Railroads, chemical railcar loadings were up 7.8% W/W for the week ending 16 July. The previous week included the Fourth of July holiday. Loadings were down 0.2% Y/Y on a 13-week MA, the first declining comparison since May 2021. Loadings were up 4.4% YTD/YTD and have been on the rise for 6 of the last 13 weeks.
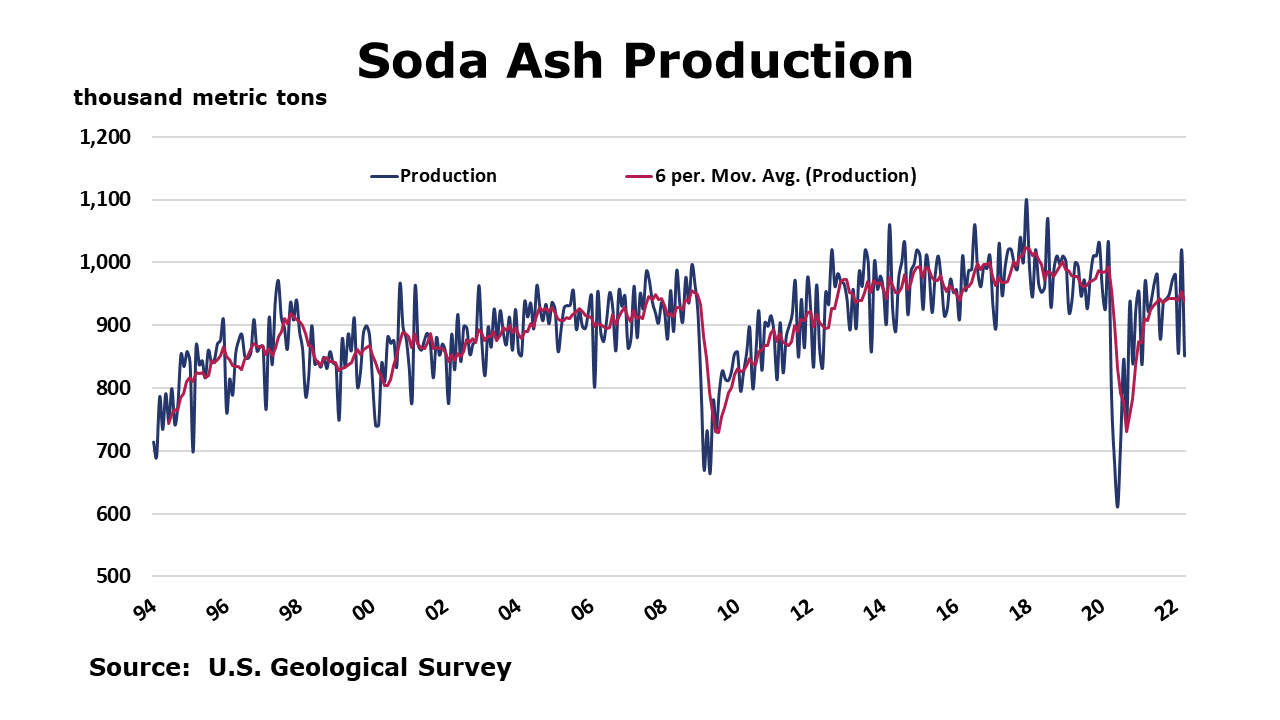
The U.S. Geological Survey reported that monthly production of soda ash in May was 959 thousand tons, up 12.7% compared to the previous month and up 2.2% Y/Y. Stocks rose 15.3% over April to 272 thousand tons at the end of the month, a 9-day supply. Ending stocks were down 0.7% Y/Y.
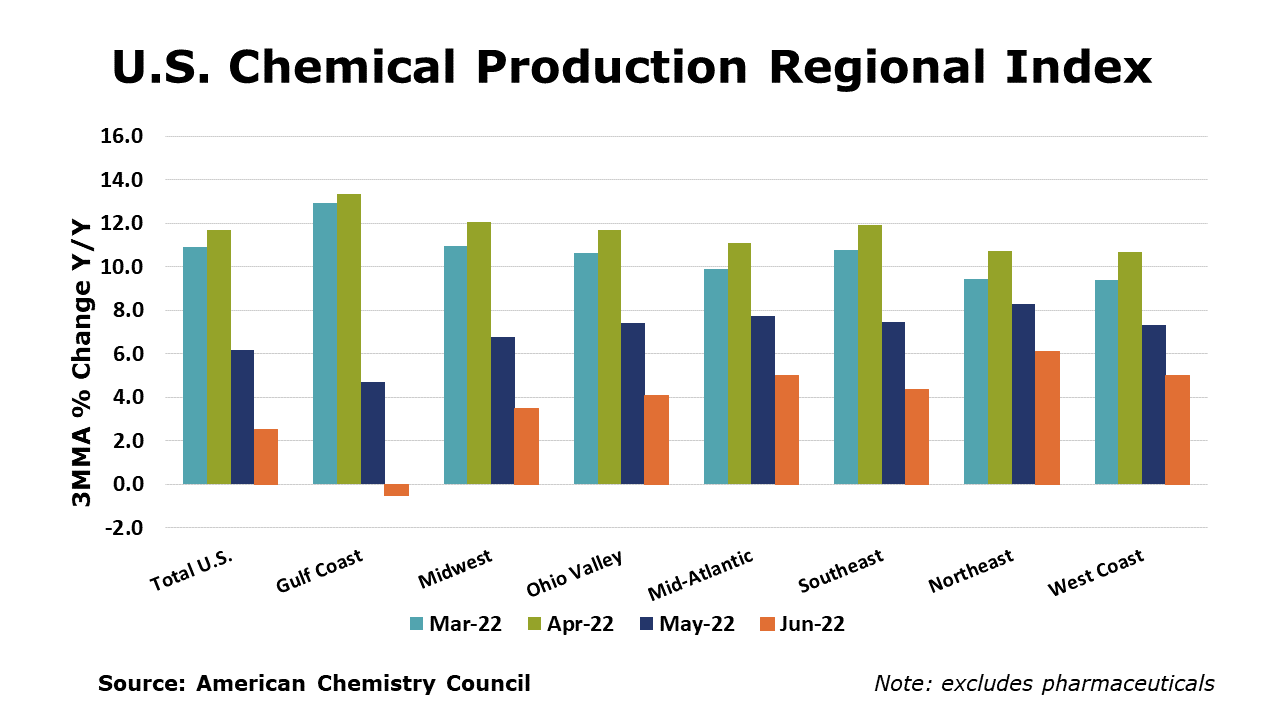
The U.S. Chemical Production Regional Index (U.S. CPRI) eased by 0.1% in June following gains of 0.5% in May and 1.0% in April, according to the American Chemistry Council (ACC). Chemical output was mixed across regions. The U.S. CPRI is measured as a three-month moving average (3MMA). Compared with June 2021, U.S. chemical production was ahead by 2.5%, a slower comparison from last month. Chemical production was higher than a year ago in all regions, except the Gulf Coast which was lower.
On a 3MMA basis, chemical production within segments was mixed. There were gains in the production of synthetic rubber, industrial gases, coatings, manufactured fibers, synthetic dyes and pigments, adhesives, other organic chemicals, crop protection chemicals, other specialty chemicals, and fertilizers. Output of plastic resins, organic chemicals and consumer products was lower
As nearly all manufactured goods are produced using chemistry in some form, manufacturing activity is an important indicator for chemical demand. Manufacturing output eased in June, by 0.1% (3MMA). The 3MMA trend in manufacturing production was mixed, with gains in the output of motor vehicles, aerospace, iron & steel, oil & gas extraction, and rubber products.
Note On the Color Codes
The banner colors represent observations about the current conditions in the overall economy and the business chemistry. For the overall economy we keep a running tab of 20 indicators. The banner color for the macroeconomic section is determined as follows:
Green – 13 or more positives
Yellow – between 8 and 12 positives
Red – 7 or fewer positives
For the chemical industry there are fewer indicators available. As a result we rely upon judgment whether production in the industry (defined as chemicals excluding pharmaceuticals) has increased or decreased three consecutive months.
For More Information
ACC members can access additional data, economic analyses, presentations, outlooks, and weekly economic updates through MemberExchange.
In addition to this weekly report, ACC offers numerous other economic data that cover worldwide production, trade, shipments, inventories, price indices, energy, employment, investment, R&D, EH&S, financial performance measures, macroeconomic data, plus much more. To order, visit https://store.americanchemistry.com/.
Every effort has been made in the preparation of this weekly report to provide the best available information and analysis. However, neither the American Chemistry Council, nor any of its employees, agents or other assigns makes any warranty, expressed or implied, or assumes any liability or responsibility for any use, or the results of such use, of any information or data disclosed in this material.
Contact us at ACC_EconomicsDepartment@americanchemistry.com