MACROECONOMY & END-USE MARKETS
Running tab of macro indicators: 13 out of 20
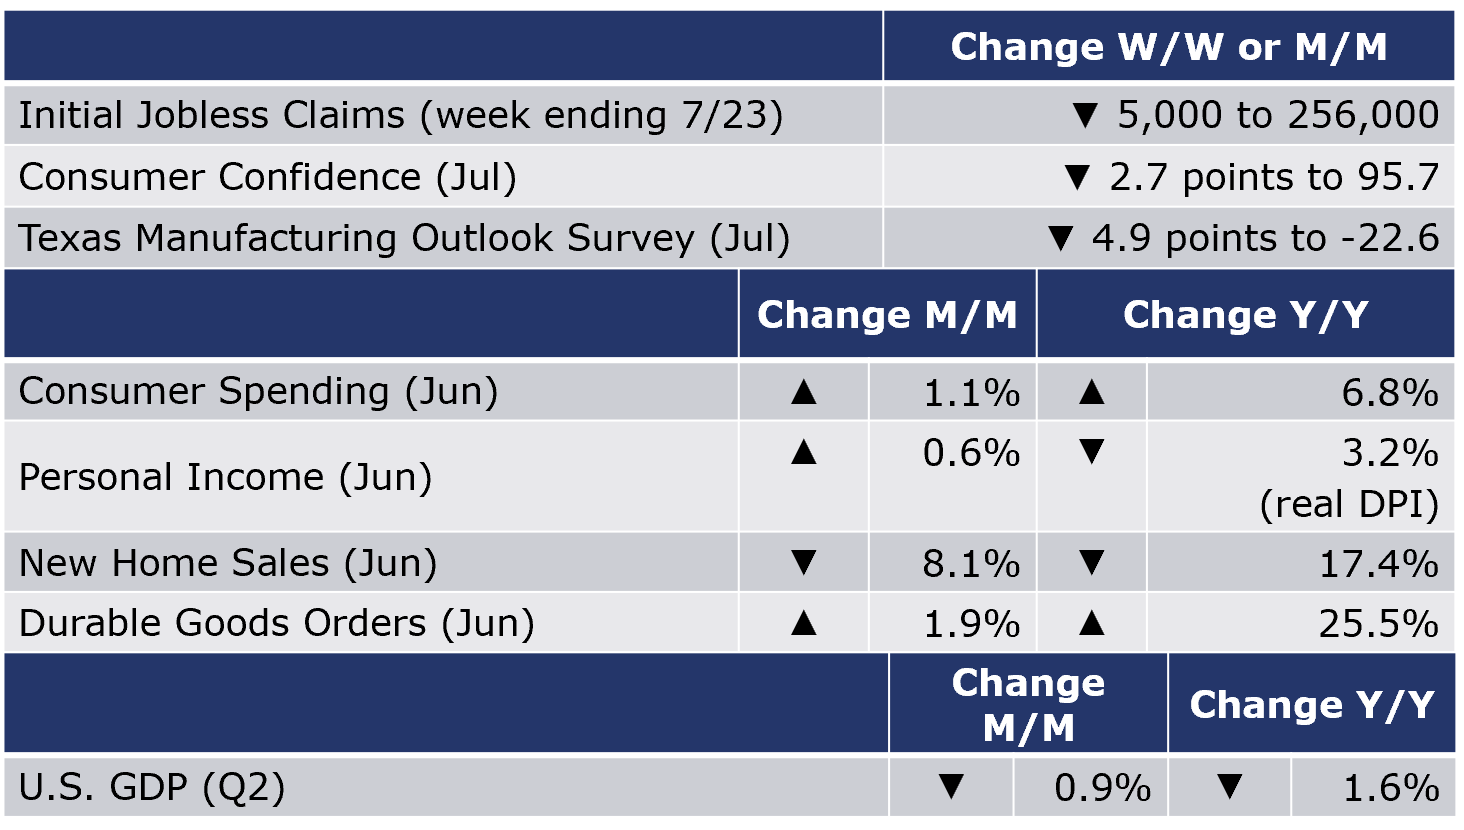
The number of new jobless claims was down 5,000 to 256,000 during the week ending 23 July. Continuing claims decreased by 25,000 to 1.4 million, and the insured unemployment rate for the week ending 16 July was unchanged at 1.0%.
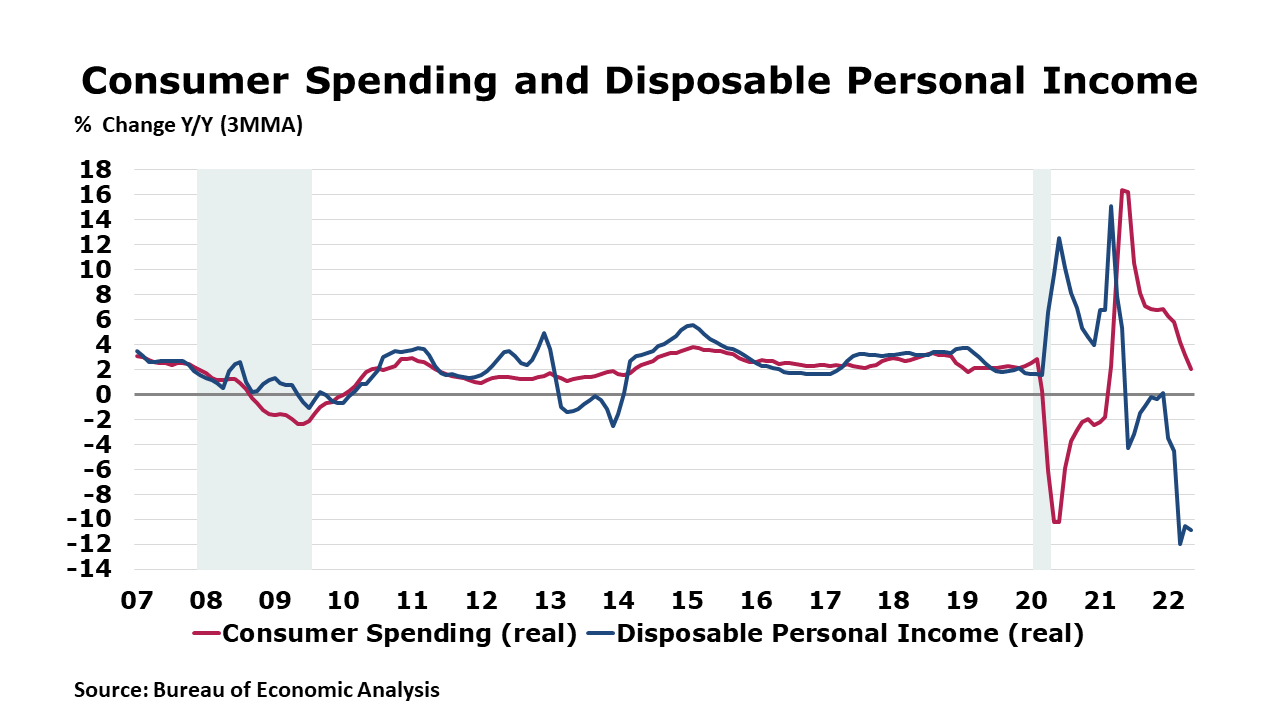
It had looked like consumer spending might’ve been slowing down. After rising 1.2% in March, spending growth decelerated, rising 0.5% in April and then 0.3% in May. Today, the BEA’s measure for nominal spending shows a 1.1% jump in June. The apparent surge in spending includes the effect of inflation and high fuel and food prices. Consumers spent more on gasoline and other energy goods and more on health care and housing. Stripping out inflation, real consumer spending was up just 0.1% in June. Personal income rose another 0.6% in June but after adjusting for inflation and taxes, it was 0.3% lower than the month before. With real disposable income contracting and real spending remaining positive, households are working down excess savings and the savings rate declined to 5.1%. Real disposable personal income was off 3.2% Y/Y and real consumer spending was up by 1.6% Y/Y. The closely-watched PCE price index was up 6.8% Y/Y. Excluding food and energy, the core PCE price index was up 4.8% Y/Y, a slight acceleration since May and well-ahead of the Fed’s 2% target.
The Conference Board’s index of consumer confidence continued to weaken in July, falling 2.7 points to 95.7, a 17-month low. The expectations component fell only slightly but still was at its lowest level in 9 years as consumers struggle with high inflation, especially for gasoline. Plans to purchase a home, car, or appliance fell in July. Inflation and rate hikes are presenting strong headwinds for consumer spending and economic growth over the next six months.
New home sales declined 8.1% in June, the fifth monthly decline in the last six months. Sales rose in the Midwest but this was more than offset by declines in the West, Northeast, and South. Inventories edged lower and the months’ supply moved higher to 9.4 months (compared to 7.5 months in May). Compared to a year ago, new home sales were off 17.4% Y/Y. The median price of a new home was down by 9.5% to $402,000.
Durable goods orders jumped 1.9% in June, but much of the gain was centered in defense goods, especially defense aircraft. New orders for computers and communications equipment and electrical equipment were higher, as well as orders for motor vehicles and parts. Core business orders (nondefense capital goods excluding aircraft) were up 0.5%. Through the end of Q2, it appears that there was still some momentum in manufacturing, though the pace has clearly slowed substantially from earlier in the year.
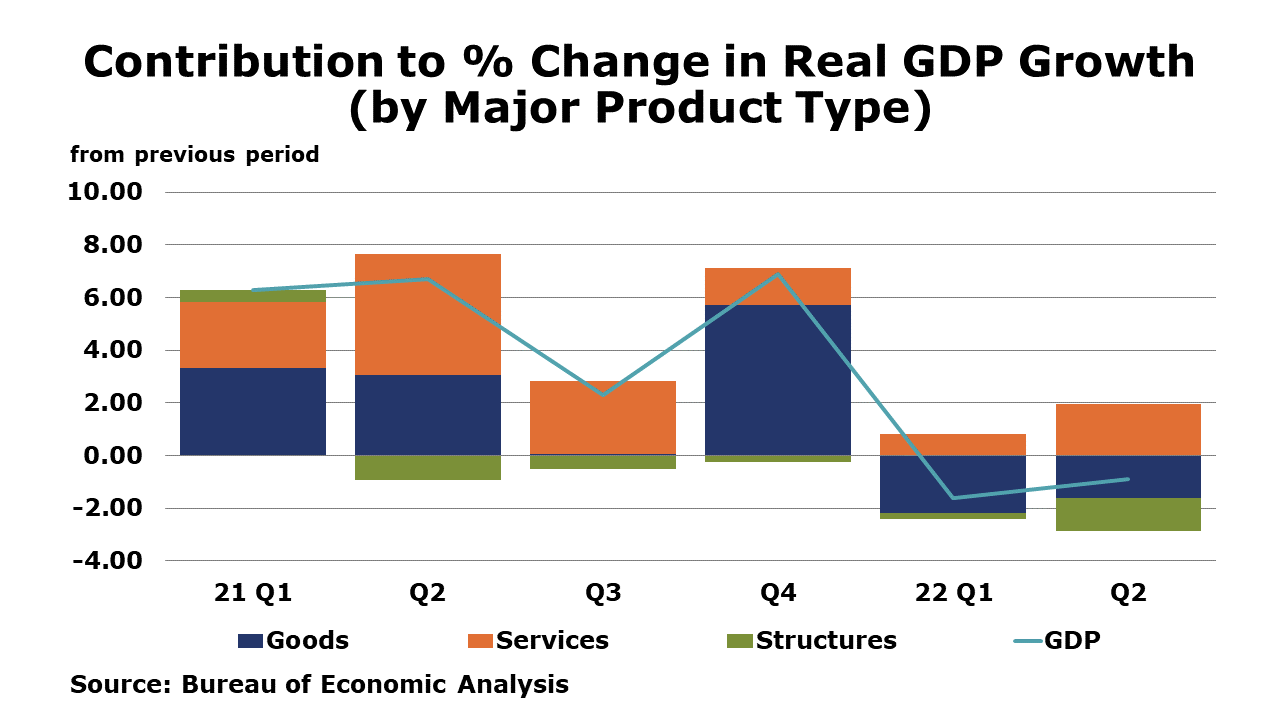
Second quarter GDP fell at a 0.9% seasonally adjusted annual rate (SAAR) according to the first of three estimates. The decline reflected decreases in private inventory investment, residential fixed investment, federal government spending, state and local government spending, and nonresidential fixed investment that were partly offset by increases in exports and personal consumption expenditures (PCE). Imports, which are a subtraction in the calculation of GDP, rose in Q2. Compared to Q2 2021, real GDP was 1.6% lower. The PCE price index accelerated to a 6.5% Y/Y pace while core prices moved lower to a 4.8% Y/Y gain.
ENERGY
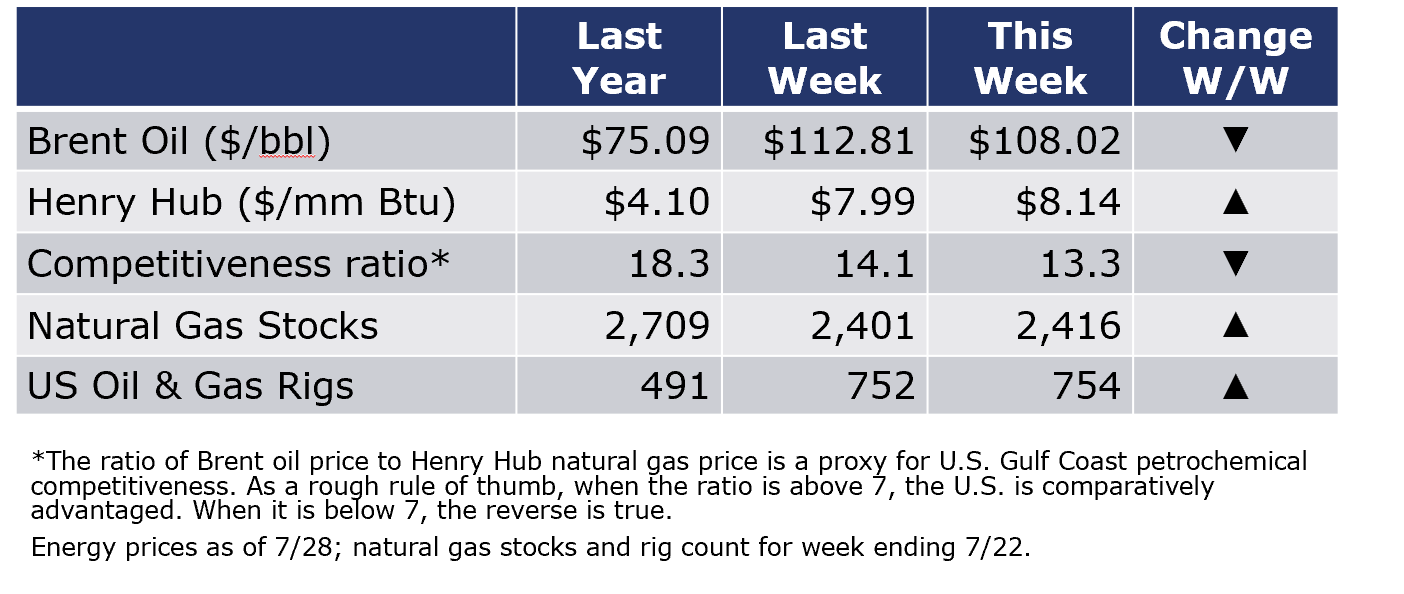
Oil prices were lower than a week ago, reflecting in part, the IMF’s downgrade of global GDP growth. U.S. natural gas prices rose during week on news that Russia is once again cutting flows to Europe. In addition, hot weather across the U.S. boosted power burn and resulted in the smallest inventory build since early-April (15 BCF). The combined oil and gas rig count rose by two to 754 during the week ending 7/23
CHEMICALS
For the business of chemistry, the indicators still bring to mind a green banner for basic and specialty chemicals.
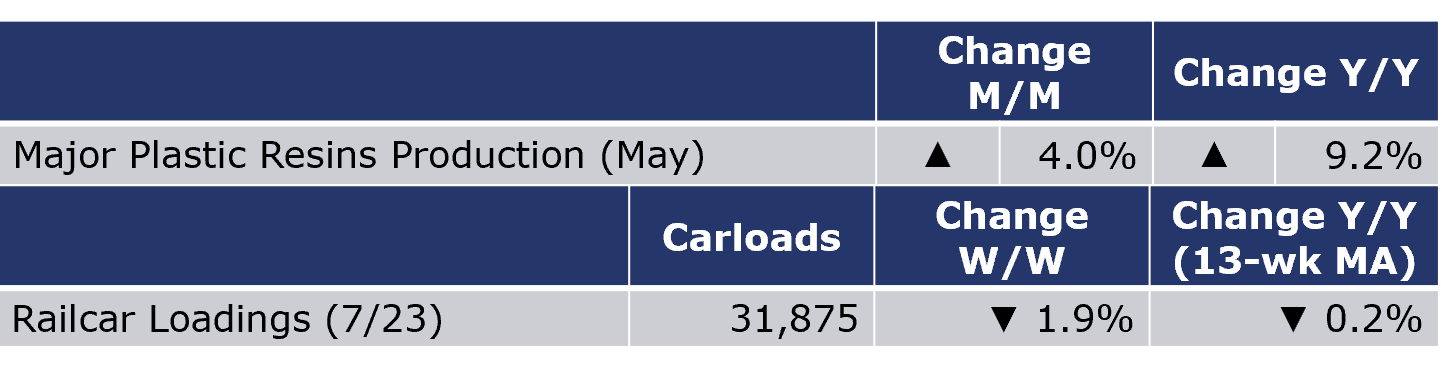
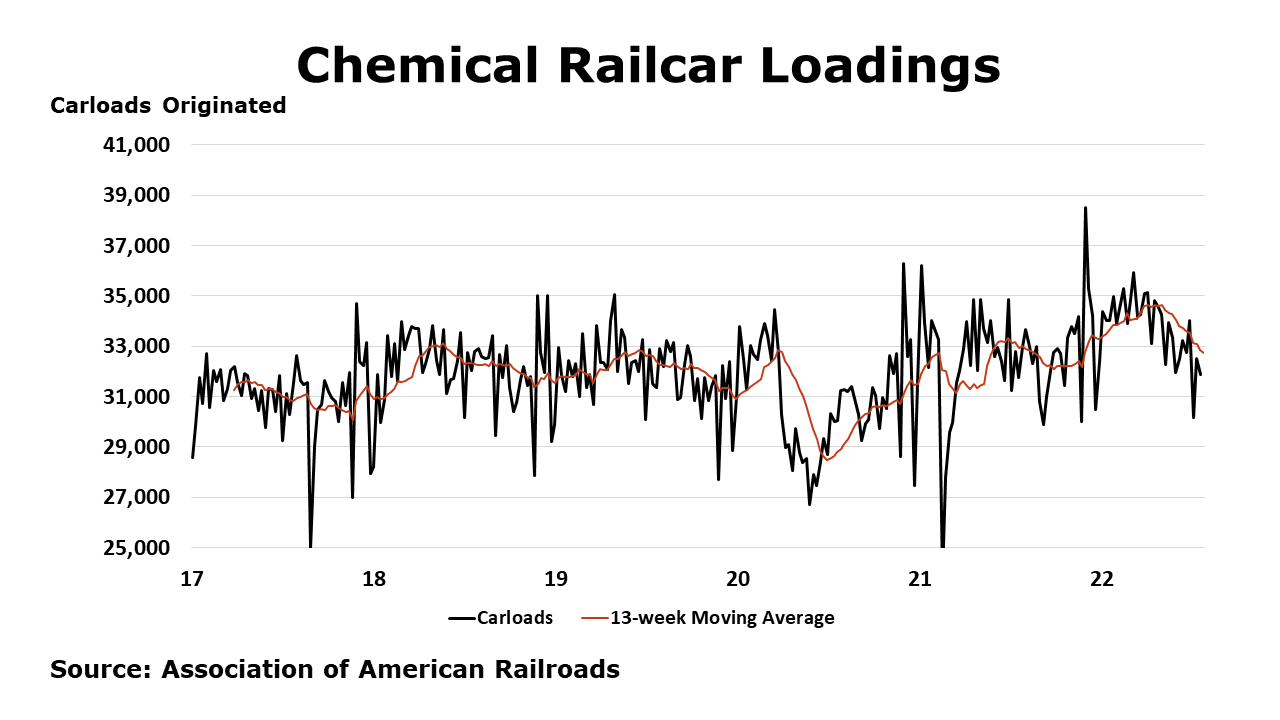
According to data released by the Association of American Railroads, chemical railcar loadings were down 1.9% W/W for the week ending 23 July. Loadings were down 0.2% Y/Y on a 13-week MA. Loadings were up 4.3% YTD/YTD and have only been on the rise for 5 of the last 13 weeks.
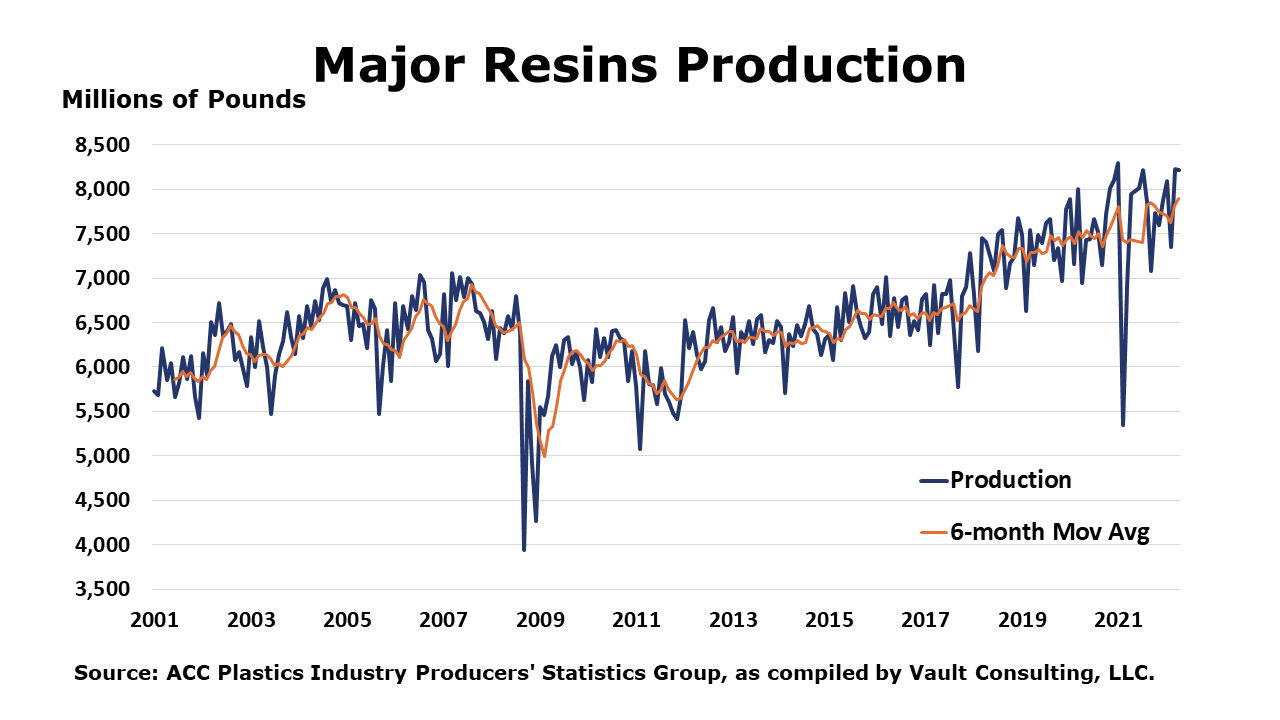
U.S. production of major plastic resins totaled 8.2 billion pounds during May, up 4.0% compared to the prior month, and up 2.9% compared Y/Y, according to statistics from the ACC Plastics Industry Producers’ Statistics Group. Year-to-date production was 39.9 billion pounds, a 9.2% increase Y/Y. Sales and captive (internal) use of major plastic resins totaled 8.0 billion pounds up 1.3% percent compared to April, and up 8.2% Y/Y. Year-to-date sales and captive use were 39.4 billion pounds, an 8.2% increase as compared to the same period in 2021.
Note On the Color Codes
The banner colors represent observations about the current conditions in the overall economy and the business chemistry. For the overall economy we keep a running tab of 20 indicators. The banner color for the macroeconomic section is determined as follows:
Green – 13 or more positives
Yellow – between 8 and 12 positives
Red – 7 or fewer positives
For the chemical industry there are fewer indicators available. As a result we rely upon judgment whether production in the industry (defined as chemicals excluding pharmaceuticals) has increased or decreased three consecutive months.
For More Information
ACC members can access additional data, economic analyses, presentations, outlooks, and weekly economic updates through MemberExchange.
In addition to this weekly report, ACC offers numerous other economic data that cover worldwide production, trade, shipments, inventories, price indices, energy, employment, investment, R&D, EH&S, financial performance measures, macroeconomic data, plus much more. To order, visit https://store.americanchemistry.com/.
Every effort has been made in the preparation of this weekly report to provide the best available information and analysis. However, neither the American Chemistry Council, nor any of its employees, agents or other assigns makes any warranty, expressed or implied, or assumes any liability or responsibility for any use, or the results of such use, of any information or data disclosed in this material.
Contact us at ACC_EconomicsDepartment@americanchemistry.com