MACROECONOMY & END-USE MARKETS
Running tab of macro indicators: 11 out of 20
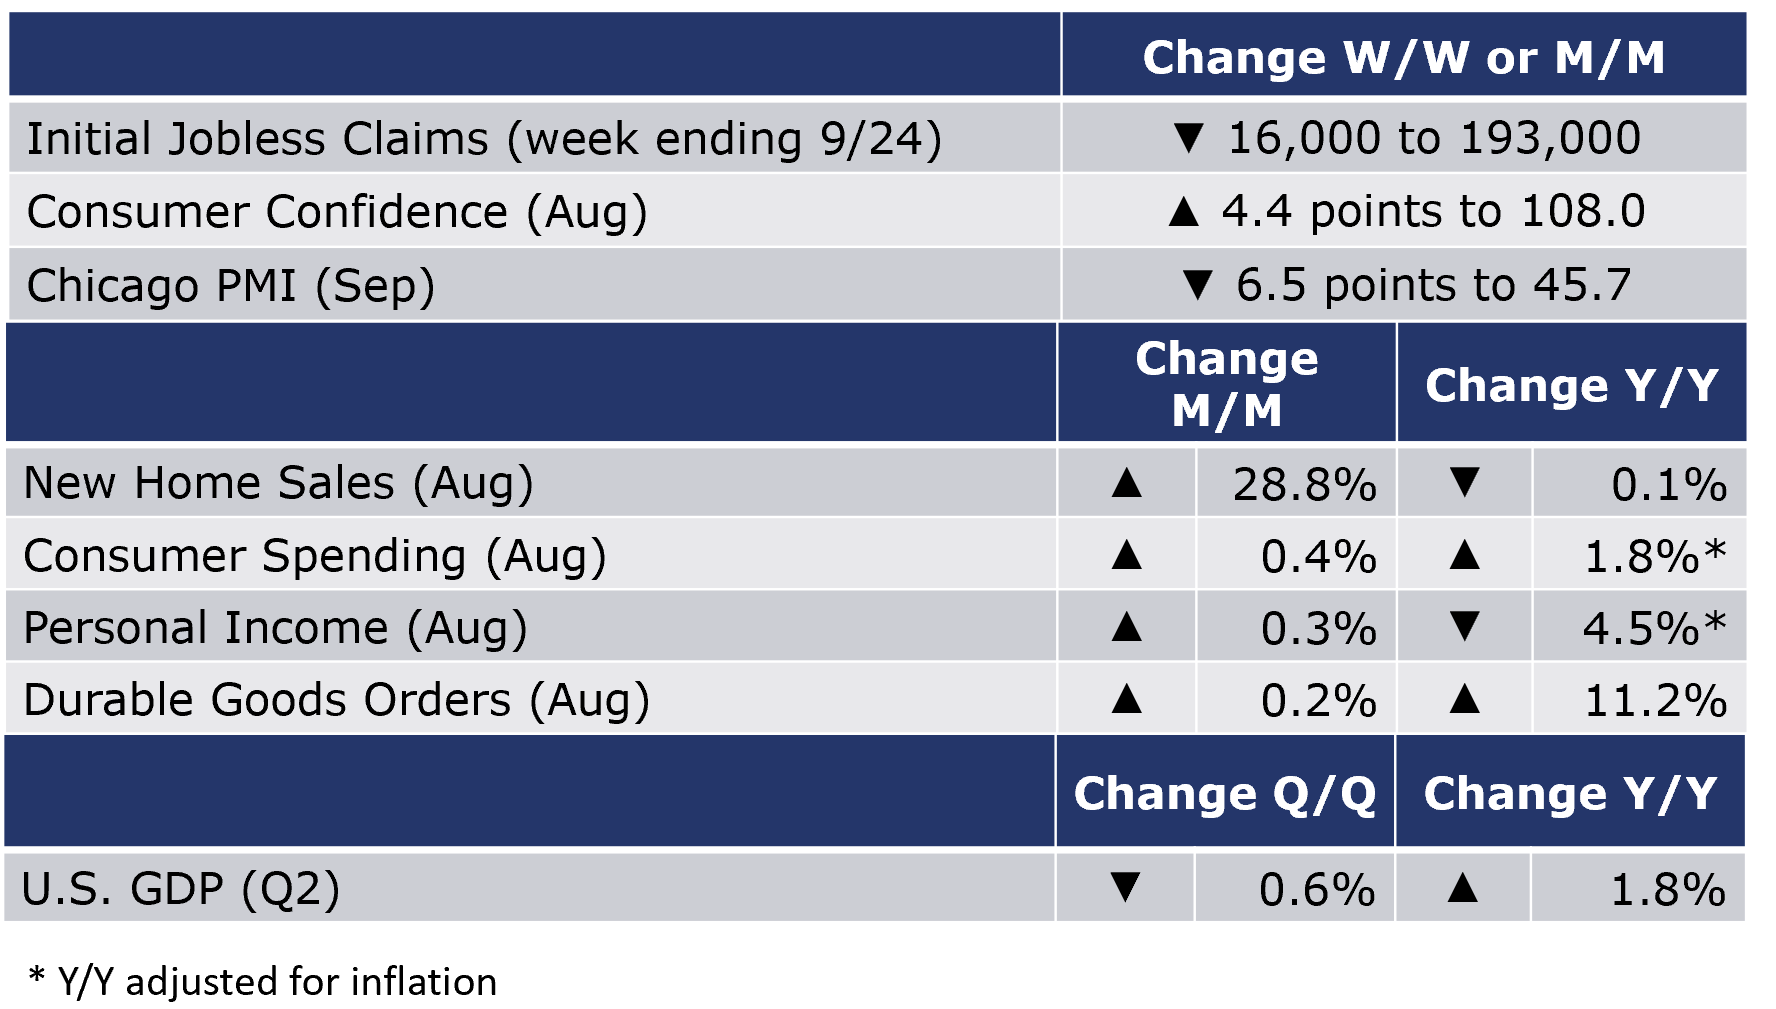
The number of new jobless claims fell by 16,000 to 193,000 during the week ending 24 September. Continued claims declined 29,000 from the previous week’s level to 1.347 million. The insured unemployment rate for the week ending September 17 was unchanged at 1.0%.
Consumer spending rebounded in August, up by 0.4%, in line with expectations. Strong gains in spending on services offset lower spending on nondurable goods (reflecting, in part, lower prices for gasoline). Personal income also rose, up 0.3%. This represents the aggregate spending power in the economy. The savings rate remained steady at 3.5%. Compared to a year ago, real (inflation-adjusted) consumer spending was up 1.8% while personal income was off 4.5% Y/Y (reflecting the removal of pandemic-related fiscal stimulus). The price index for personal consumption expenditures (PCE) rose at a 6.2% annual pace, lower than the 6.4% pace in July, but still elevated. Excluding the volatile food and energy components, the core PCE price index accelerated to a 4.9% annual pace, up from 4.7% in July. Because this is the Fed’s preferred inflation measure, the unexpected acceleration lays the foundation for additional Fed tightening.
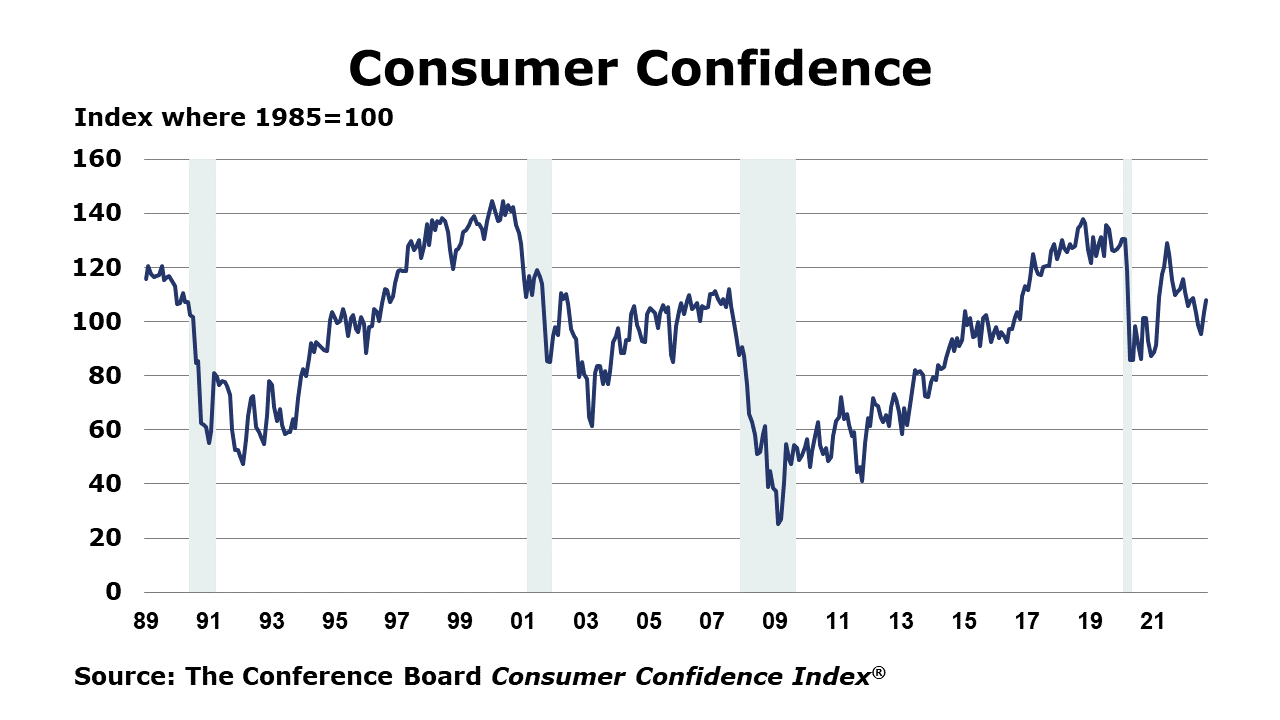
The Conference Board Consumer Confidence Index® rose—up 4.4 points to 108.0—in September following a gain in August. Consumers’ assessment of current business conditions improved as did their assessment of the labor market with more saying jobs were “plentiful” and less saying they were “hard to get” in September. The expectations component, which is based on consumers’ short-term outlook for income, business and labor market conditions improved though it remains at a low-level indicating recession risk. Purchasing plans were mixed with increased intentions to buy appliances and cars but as mortgage rates increase and affordability decreases, plans to buy a home declined. Concerns about inflation moderated to their lowest level so far this year.
New home sales rose in August by 28.8%, a level just 0.1% below the August 2021 level. Sales were higher in all regions compared to July. The number of new homes available for sale at the end of August rose for a ninth consecutive month by 0.4%. At the current sales pace, the inventory of new homes represents an 8.1-month supply, a downturn from July when inventory was at the highest level since 2009.
New orders for durable goods edged down 0.2% in August from July. The slight decline was less than the 0.4% decline economists had forecasted. The decrease was largely due to the 18.5% drop in orders for nondefense aircraft, a possible reflection of the current state of U.S.-China relationship. Total transportation orders were down 1.1% in August from July. Excluding transportation, durables orders were up 0.2%. Total orders excluding defense were down 0.9% - suggesting that defense orders related to the war in Ukraine have provided some floor to total new orders. A proxy for business investment, “core” new orders – new orders minus civilian aircraft capital goods and defense capital goods – was up 1.3% in August.
The third and final estimate of the second quarter GDP was unrevised at -0.6% (SAAR). First quarter GDP was -1.6% (SAAR) and also unrevised. On the upside, personal consumption was higher than previously estimated and increased by 2%, making a positive contribution. Consumers spent more on services and less on goods than in the previous quarter, as the post-pandemic adjustment continues to unfold. The gross investment was lower than previously estimated and fell 14.1%. Higher borrowing costs impacted investment while net exports narrowed to -$1,035.6 billion and made a positive contribution. The change in inventories was up to $145.4 billion, less than the $257.4 billion in the first quarter. In summary, the annual revisions to the GDP data did not change the current picture of the growth in the economy through Q2.
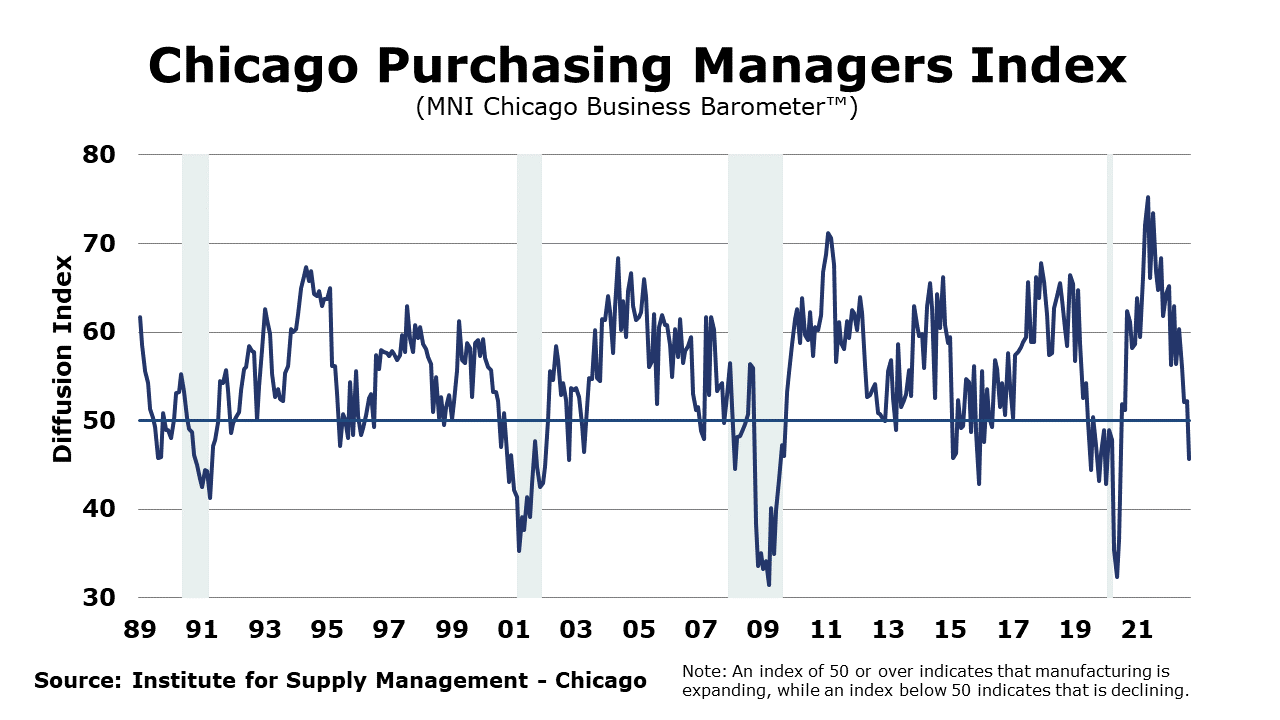
An early look into manufacturing activity for September, the Chicago PMI fell 6.5 points to 45.7, its lowest level in more than two years, and well below expectations. The below-50 reading indicates that manufacturing activity contracted in the Chicago area during September. A number of measures contracted, including new orders which fell for a fourth month.
ENERGY
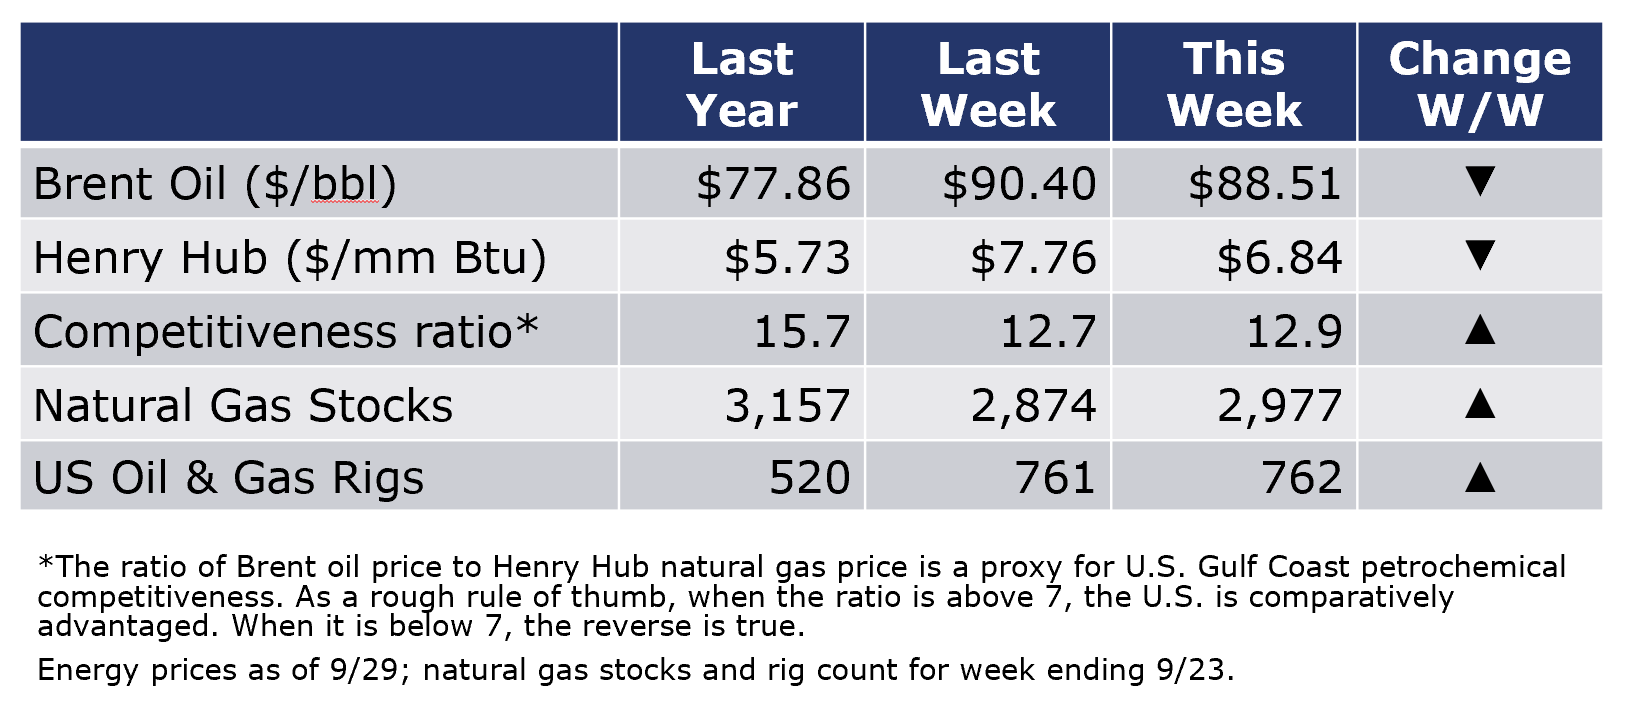
Oil prices declined slightly during the week as concerns about global oil demand weakened in line with growth expectations. U.S. natural gas prices also fell as storage injections have been strong in recent weeks. The combined oil and rig count rose by one to 762 during the week ending 9/30.
CHEMICALS
For the business of chemistry, the indicators still bring to mind a yellow banner for basic and specialty chemicals.
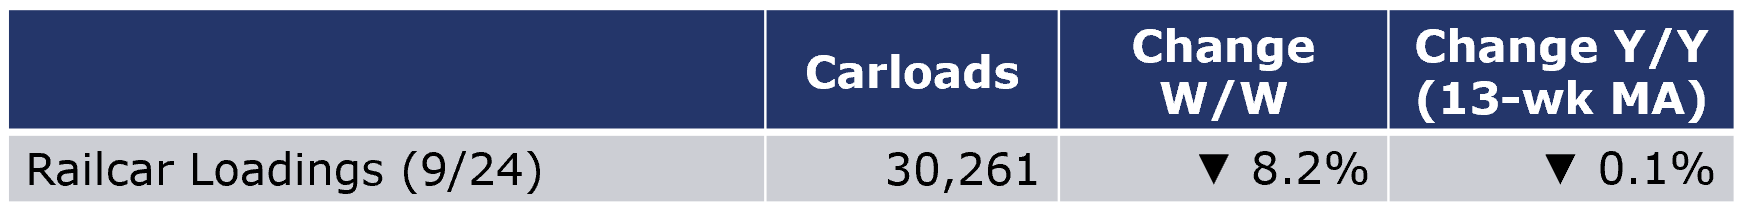
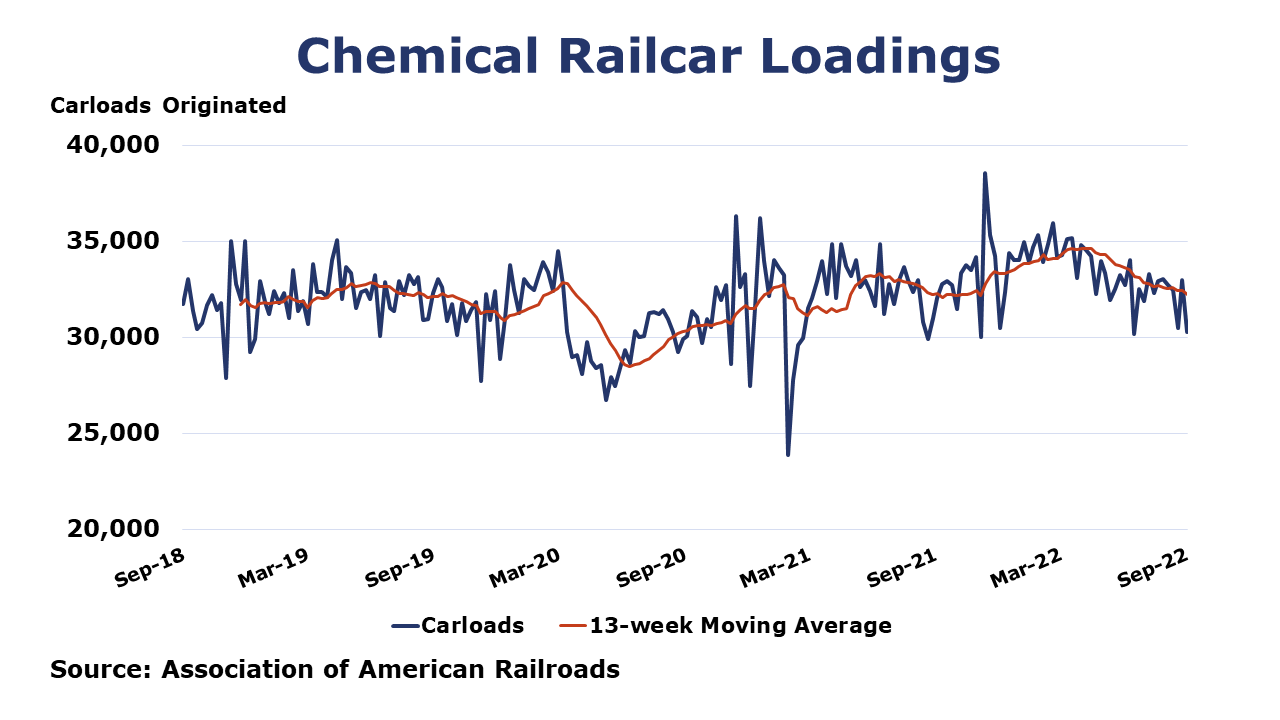
According to data released by the Association of American Railroads, chemical railcar loadings were down 8.2% to 30,261 during the week ending 24 September. Loadings were down 0.1% Y/Y (13-week MA), up 3.4% YTD/YTD and have been on the rise for six of the last 13 weeks.
Note On the Color Codes
The banner colors represent observations about the current conditions in the overall economy and the business chemistry. For the overall economy we keep a running tab of 20 indicators. The banner color for the macroeconomic section is determined as follows:
Green – 13 or more positives
Yellow – between 8 and 12 positives
Red – 7 or fewer positives
For the chemical industry there are fewer indicators available. As a result we rely upon judgment whether production in the industry (defined as chemicals excluding pharmaceuticals) has increased or decreased three consecutive months.
For More Information
ACC members can access additional data, economic analyses, presentations, outlooks, and weekly economic updates through MemberExchange.
In addition to this weekly report, ACC offers numerous other economic data that cover worldwide production, trade, shipments, inventories, price indices, energy, employment, investment, R&D, EH&S, financial performance measures, macroeconomic data, plus much more. To order, visit http://store.americanchemistry.com/.
Every effort has been made in the preparation of this weekly report to provide the best available information and analysis. However, neither the American Chemistry Council, nor any of its employees, agents or other assigns makes any warranty, expressed or implied, or assumes any liability or responsibility for any use, or the results of such use, of any information or data disclosed in this material.
Contact us at ACC_EconomicsDepartment@americanchemistry.com