MACROECONOMY & END-USE MARKETS
Running tab of macro indicators: 8 out of 20
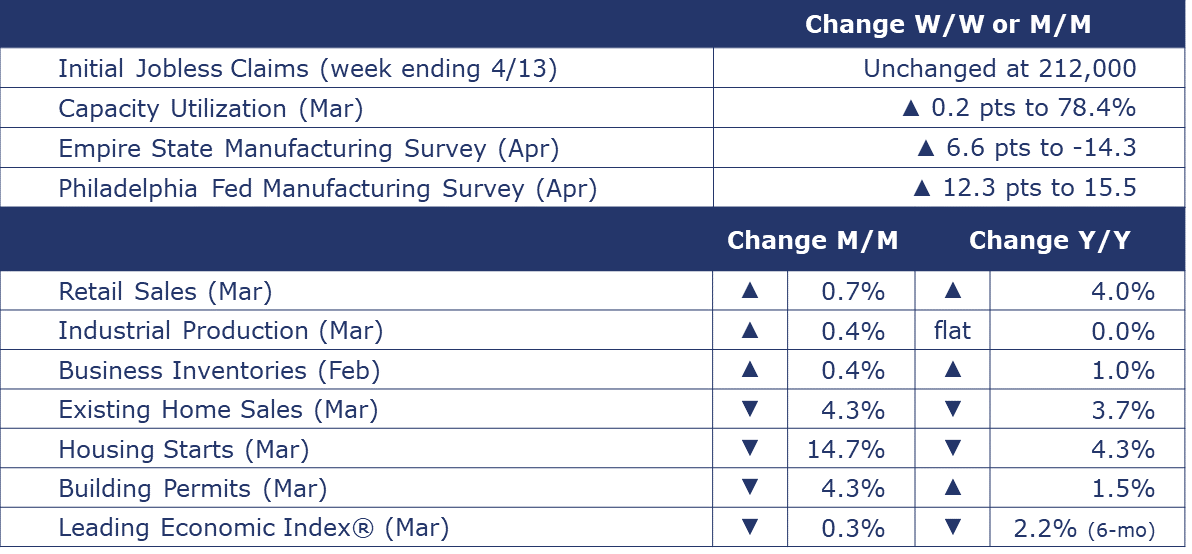
The number of new jobless claims was unchanged at 212,000 during the week ending 13 April. Continuing claims increased by 2,000 to 1.812 million, and the insured unemployment rate for the week ending 6 April was unchanged at 1.2%.
Following an upwardly revised 0.9% rebound in February, retail sales rose 0.7% in March, again exceeding expectations. Excluding sales at motor vehicle & parts dealers (which declined), retail sales rose 1.1%, the highest monthly gain in more than a year. Sales of online platforms surged 2.7% and there were also gains in sales at general merchandise stores, building material dealers & garden centers, gas stations and restaurants & bars. These gains more than offset lower sales at electronic and appliance stores, clothing & accessories stores, sporting goods & hobby stores, and furniture & furnishings stores. Compared to a year ago, retail sales were up 4.0% Y/Y.
Existing home sales fell 4.3% in March to a 4.19 million annual pace and were off 3.7% Y/Y. Housing inventories rose 4.7% from February levels and now represent a 3.2-month supply at the current sales pace. While higher than the 2.9-month supply in February and the 2.7-month supply a year ago, inventories remain at historically lean levels. The median sales price was up 4.8% Y/Y to $393,500, the ninth consecutive month of Y/Y gains and the highest ever price ever for March.
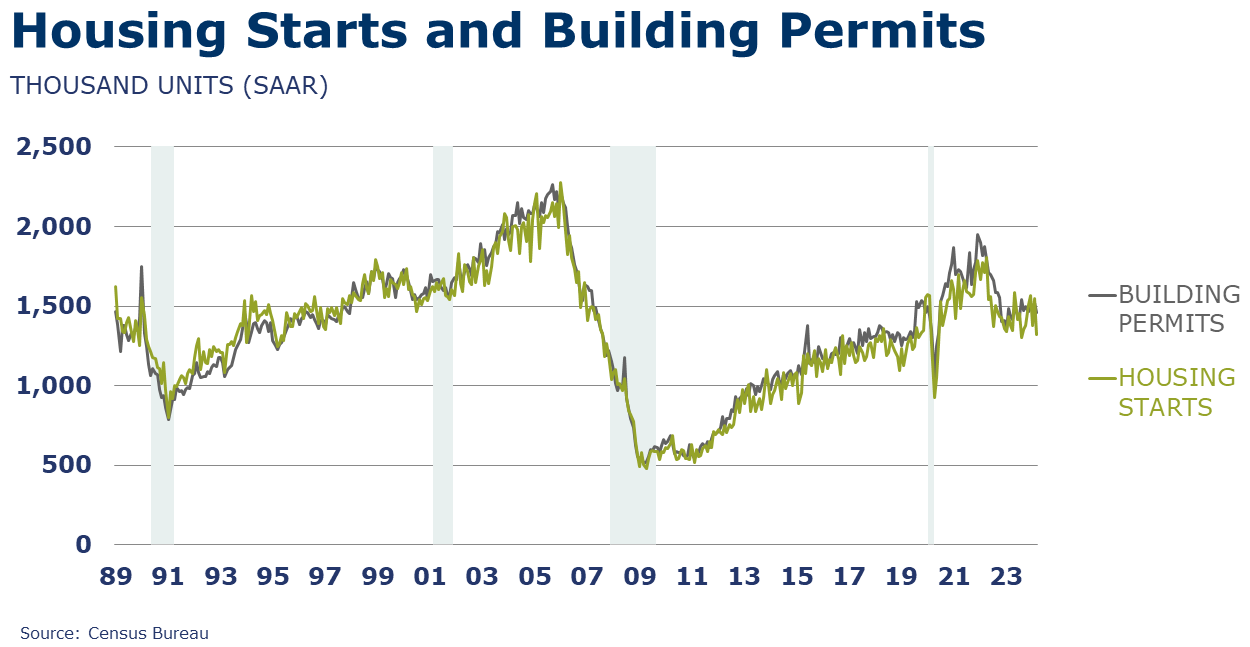
Housing starts and building permits declined sharply in March. Starts fell to a 1.321-million-unit pace, which was down 14.7% M/M and down 4.3% Y/Y. There were steep drops in both single and multi-family starts in March. Starts were down in all regions except the West. Building permits were at a 1.458-million-unit pace, which was down 4.3% M/M but up 1.5% Y/Y. Permits for single family homes fell 5.7% M/M but were up 17.4% Y/Y. Permits declined in all regions except the West where there was a gain in permits in multi-family.
Following four months of gains, NAHB’s homebuilder sentiment measure was flat in April. At 51, the index remained ahead of the neutral mark, indicating slightly positive sentiment toward the market for newly built single-family homes. With mortgage rates back near 7% and prospects for a near-term interest rate cut fading, the higher cost of borrowing is weighing on prospective homebuyers.
Combined business inventories rose 0.4% in February, following flat growth in January. Inventories rose across manufacturers, wholesalers, and retailers. Inventory investment contributes to the calculation of GDP. Sales also rose in all three major segments of the supply chain with a gain of 1.6%. Compared to a year ago, both sales and inventories were up 1.0% Y/Y. The inventories-to-sales ratio edged lower from 1.39 in January to 1.38 in February. A year ago, the ratio was 1.37.
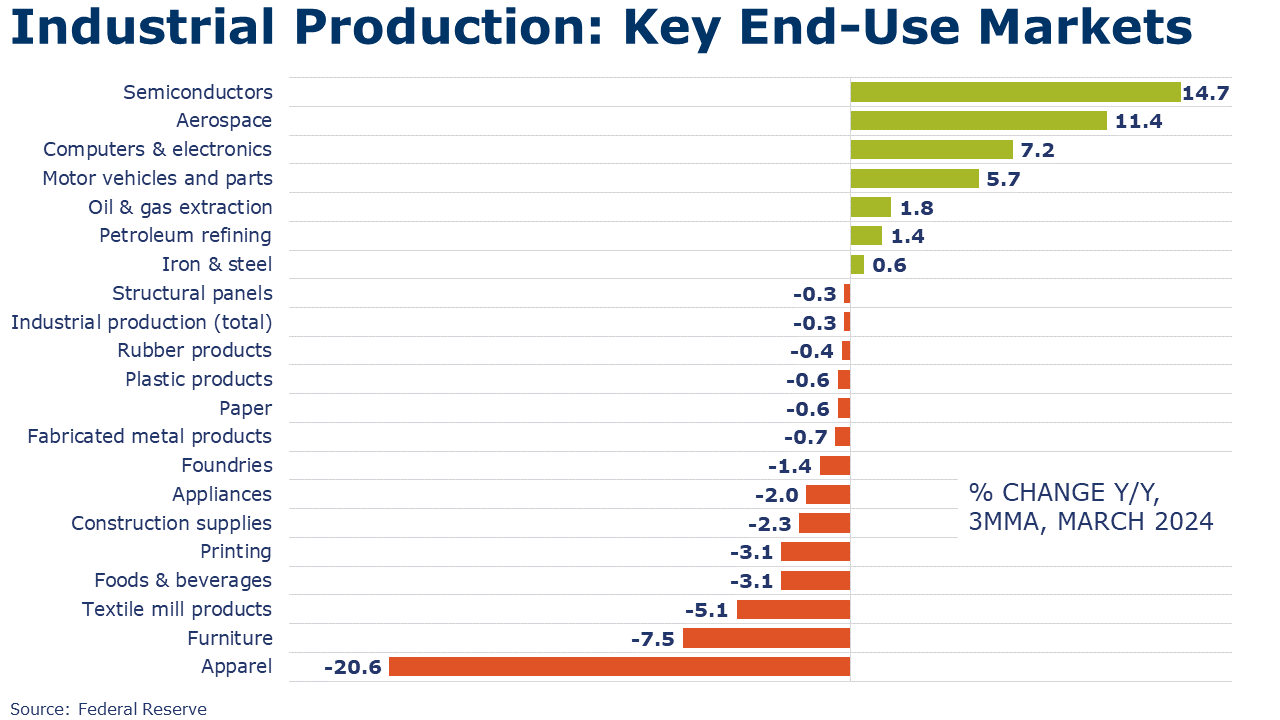
Industrial production rose for a second month in March, up by 0.4%, led by higher manufacturing output. Within manufacturing, output was mixed. The largest M/M percentage gains were in refining, motor vehicles & parts, printing, and aerospace. The largest M/M declines were in nonmetallic mineral products, apparel & leather, textiles, and furniture. Compared to a year ago, overall industrial production was flat while manufacturing output was up 0.8% Y/Y. Capacity utilization tightened by 0.2 percentage points to 78.4%, still below the 79.5% rate in March 2023. Over the past year, overall industrial capacity grew by 1.4%.
Following the first gain in two years in February, the Conference Board’s Leading Economic Index® (LEI) for the U.S. decreased by 0.3% in March. Over the past six months, the LEI was off by 2.2%, though the pace of contraction has slowed. The decline in March was driven by negative contributions from the yield spread, new building permits, consumers’ outlook on business conditions, new orders, and initial unemployment insurance claims.
SURVEY OF ECONOMIC FORECASTERS
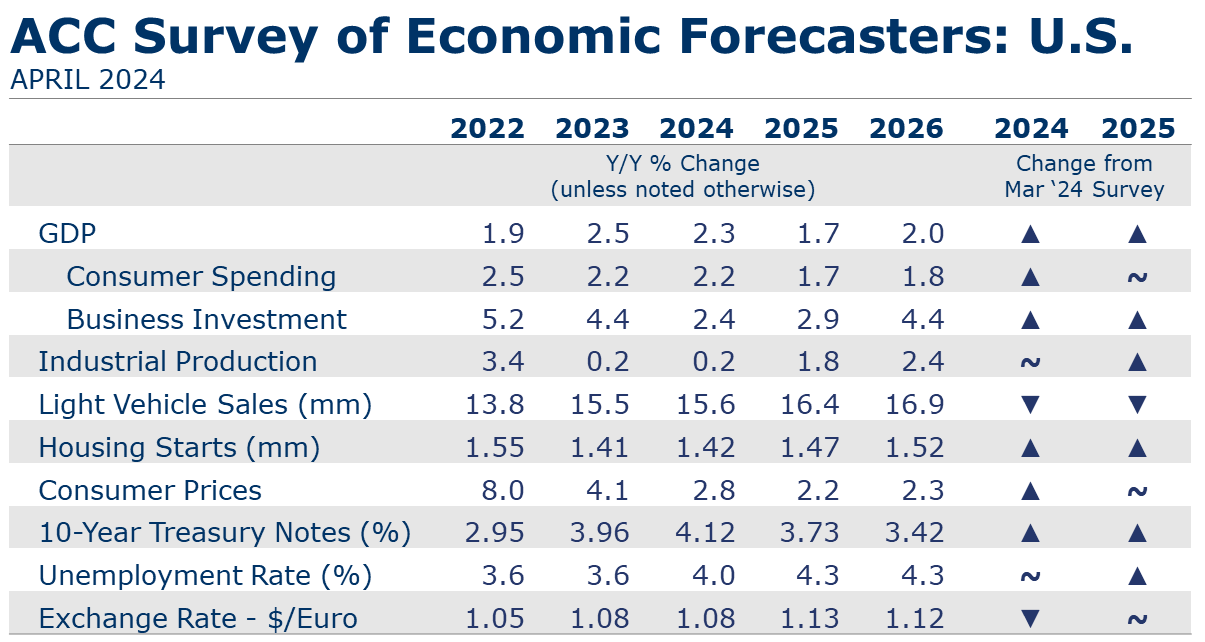
U.S. Forecasts:
- Moving into Q2, the U.S. economy remains resilient. The labor market remains strong and rising incomes are supporting spending. There are signs of recovery in manufacturing. Expectations for 2024 continued to improve for several key indicators.
- U.S. GDP is expected to grow by 2.3% in 2024 and by 1.7% in 2025.
- Consumer spending growth is expected to grow at last year’s 2.2% Y/Y pace in 2024 but will slow to a 1.7% gain in 2025.
- Higher borrowing costs and election uncertainty have dampened business investment which is expected to decelerate to a 2.4% pace in 2024 before increasing to a 2.9% gain in 2025 as interest rates decline.
- Following a 0.2% gain in 2023, we look for industrial production to come in around the same pace (0.2%) in 2024 before strengthening to a 1.8% pace in 2025.
- Higher borrowing costs and the impact on auto imports from the Baltimore bridge collapse have created headwinds. Sales of autos and light trucks are expected to grow to 15.6 million in 2024 (still below trend) before rising to a 16.4 million pace in 2025.
- Struggling with high prices, labor costs, and mortgage rates, new homebuilding has found some support from historically low inventories of existing homes. Housing starts are expected to remain essentially flat at 1.42 million in 2024 before rising to a 1.47 million pace in 2025 as mortgage rates come down.
- The unemployment rate is expected to move higher from near 50-year lows to average 4.0% in 2024 and 4.3% in 2025.
- Recent data shows that inflation remains sticky and remains above the Fed’s target. Growth in consumer prices is expected to decelerate to a 2.8% pace in 2024 and 2.2% in 2025.
- Sticky inflation has led to recent comments from the Fed suggesting that rates may stay higher for longer than expected at the beginning of this year. Expectations for 10-year Treasury yields were slightly higher for 2024 and 2025 as expected rate cuts get pushed back.
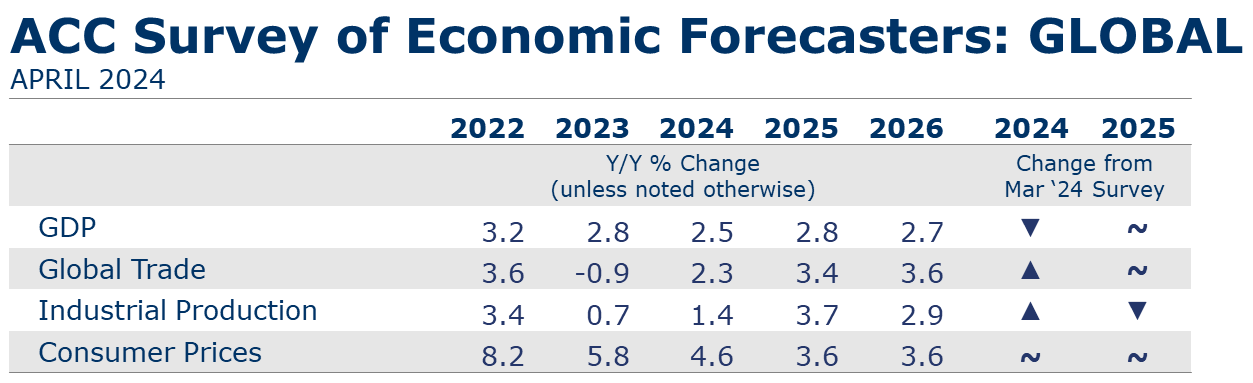
Global Forecasts:
- Global GDP growth was revised down slightly from 2.6% to 2.5% for 2024. The 2025 global growth forecast was unchanged at 2.8%. Global activity is forecast to expand at a 2.7% pace in 2026.
- Global inflation pressures have eased since 2022. Inflation will continue to moderate, advancing at a 4.6% pace this year (2024) and further easing toward an average 3.3% pace over the 2027-2031 period.
- Global manufacturing was weak and lacked momentum through 2023, expanding by less than 1% over the year. Growth will return as demand recovers. The industrial sector is forecast to grow 1.4% this year and pick up to a 3.7% pace in 2025.
- Relatively weak demand for manufactured goods was observed throughout the past year in flat or falling new orders – both domestic and export. Muted external demand for industrial goods hampered world trade volumes and trade contracted in 2023. Trade volumes are forecast to recover this year by and upwardly revised 2.3% and by 3.4% in 2025.
Fed Beige Book
A compilation of anecdotal information on the regional economies in the 12 districts, the Beige Book is published eight times per year. Interesting excerpts follow here:
- On balance, overall economic activity has expanded slightly since late February. The economic outlook among contacts was cautiously optimistic.
- Ten out of twelve Districts experienced either slight or modest economic growth—up from eight in the previous report, while the other two reported no changes in activity.
- Consumer spending barely increased overall, but reports were quite mixed across Districts and spending categories. Several reports mentioned weakness in discretionary spending, as consumers' price sensitivity remained elevated. Auto spending was buoyed notably in some Districts by improved inventories and dealer incentives, but sales remained sluggish in other Districts.
- Tourism activity increased modestly, on average, but reports varied widely.
- Manufacturing activity declined slightly, as only three Districts reported growth in that sector.
- Disruptions in the Red Sea and the collapse of Baltimore's Key Bridge caused some shipping delays.
- Contacts reported slight increases in nonfinancial services activity, on average, and bank lending was roughly flat overall.
- Residential construction increased a little, on average, and home sales strengthened in most Districts. In contrast, nonresidential construction was flat, and commercial real estate leasing fell slightly.
- Disruptions in the Red Sea and the collapse of Baltimore's Key Bridge caused some shipping delays but did not lead to widespread price increases.
ENERGY
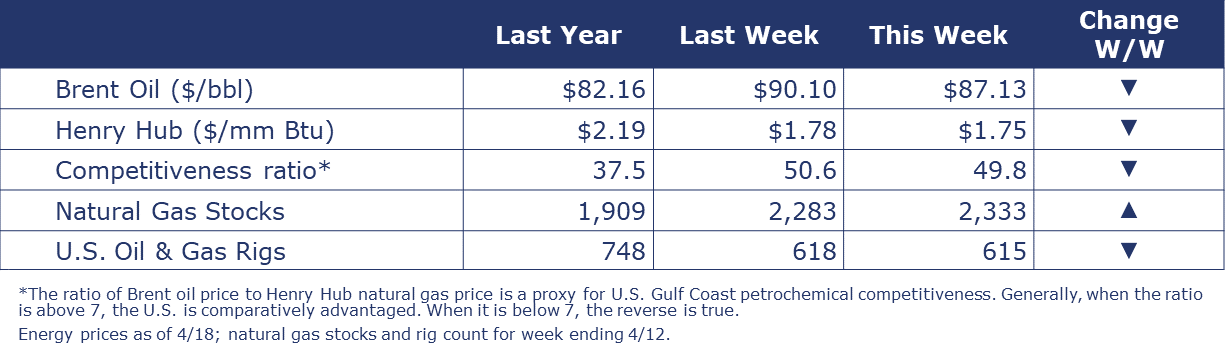
Oil prices eased a bit following Iran’s attack on Israel last weekend. While the attack was largely fended off, Israel is considering retaliation, which could add to the geopolitical risk premium. Natural gas prices were also slightly lower. The combined oil and gas rig count fell by three to 615. Natural gas inventories rose by 50 BCF and were 36.4% above the five-year average.
CHEMICALS
Indicators for the business of chemistry bring to mind a yellow banner.
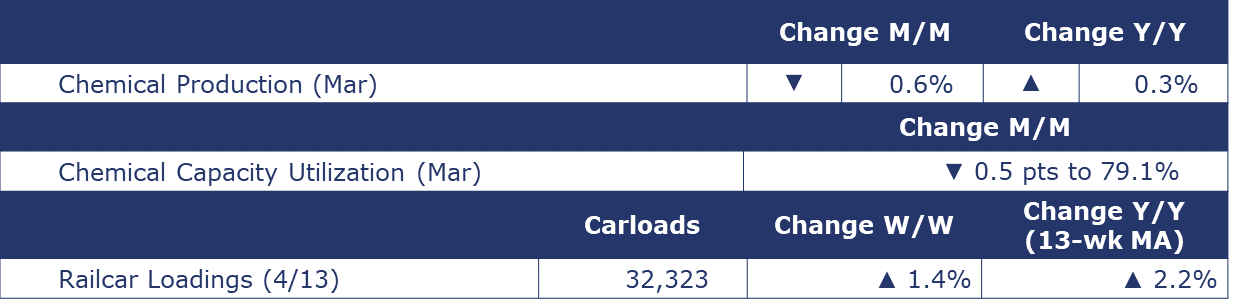
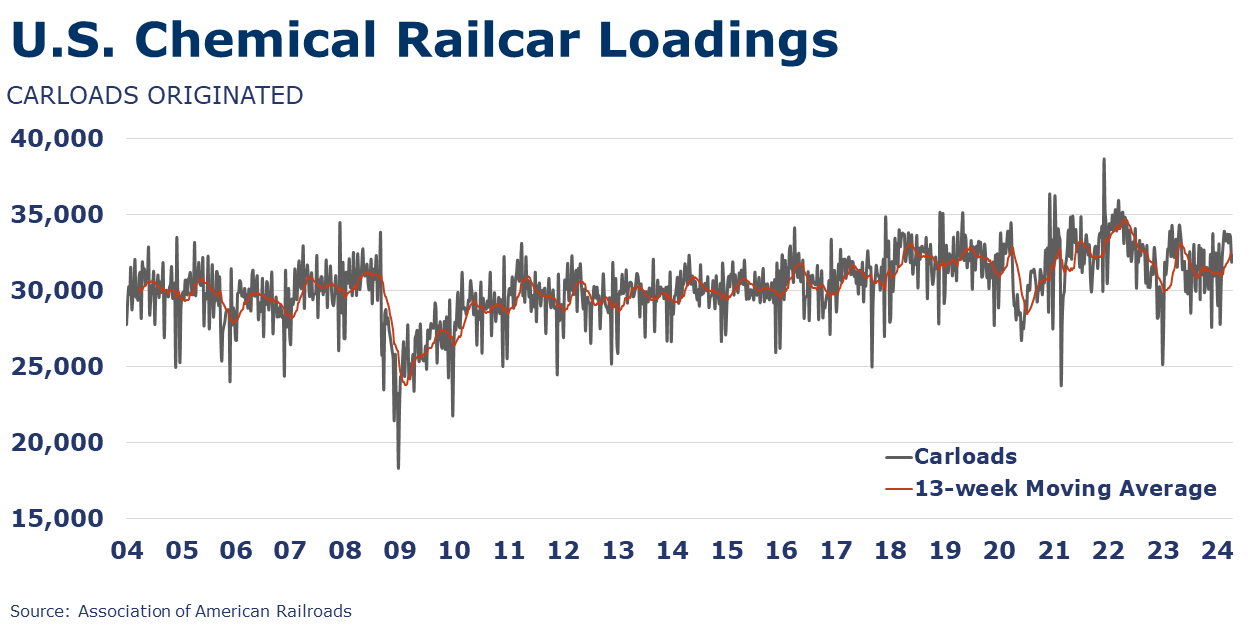
According to data released by the Association of American Railroads, chemical railcar loadings were up to 32,323 for the week ending April 13. Loadings were up 1.4% Y/Y (13-week MA), up (4.3%) YTD/YTD and have been on the rise for seven of the last 13 weeks.
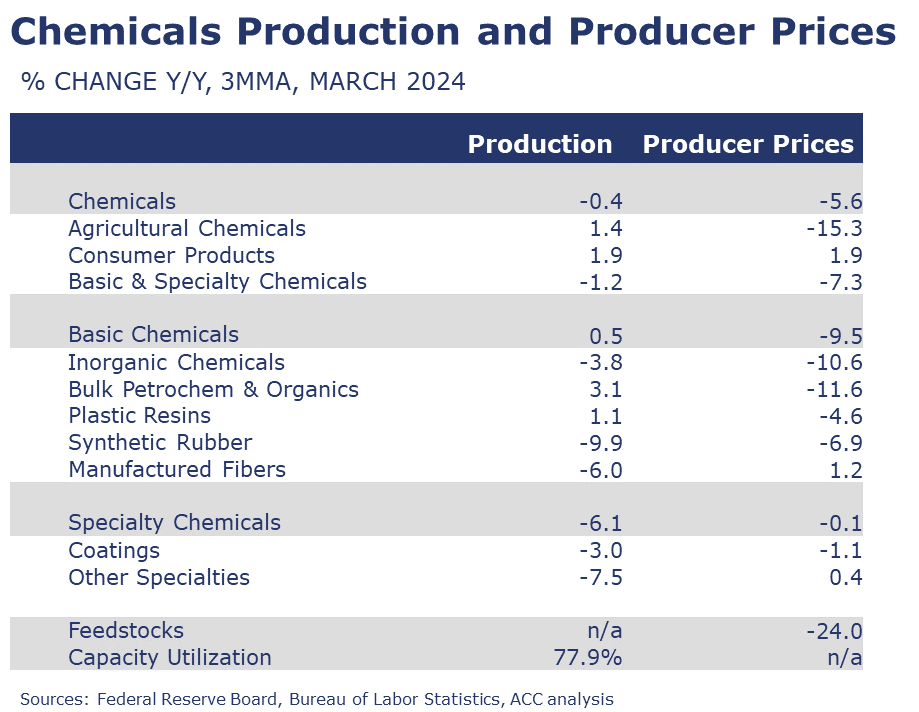
Following a 2.4% rebound in February, chemical production declined 0.6% in March. Output was higher for organic chemicals, inorganic chemicals, synthetic rubber, and manufactured fibers. Those gains were more than offset by lower production of plastic resins, coatings, other specialty chemicals, fertilizers, crop protection chemicals and consumer products. Despite the sequential decline, chemical production was up 0.3% from a year ago, the second positive Y/Y comparison in the past 17 months.
Chemical capacity utilization eased by 0.5 percentage points to 79.1% in March. This was down from 79.4% in March 2023. Over the past year, chemical capacity was 0.7% higher.
Note On the Color Codes
Banner colors reflect an assessment of the current conditions in the overall economy and the business chemistry of chemistry. For the overall economy we keep a running tab of 20 indicators. The banner color for the macroeconomic section is determined as follows:
Green – 13 or more positives
Yellow – between 8 and 12 positives
Red – 7 or fewer positives
There are fewer indicators available for the chemical industry. Our assessment on banner color largely relies upon how chemical industry production has changed over the most recent three months.
For More Information
ACC members can access additional data, economic analyses, presentations, outlooks, and weekly economic updates through ACCexchange.
In addition to this weekly report, ACC offers numerous other economic data that cover worldwide production, trade, shipments, inventories, price indices, energy, employment, investment, R&D, EH&S, financial performance measures, macroeconomic data, plus much more. To order, visit http://store.americanchemistry.com/.
Every effort has been made in the preparation of this weekly report to provide the best available information and analysis. However, neither the American Chemistry Council, nor any of its employees, agents or other assigns makes any warranty, expressed or implied, or assumes any liability or responsibility for any use, or the results of such use, of any information or data disclosed in this material.
Contact us at ACC_EconomicsDepartment@americanchemistry.com.