MACROECONOMY & END-USE MARKETS
Running tab of macro indicators: 10 out of 20
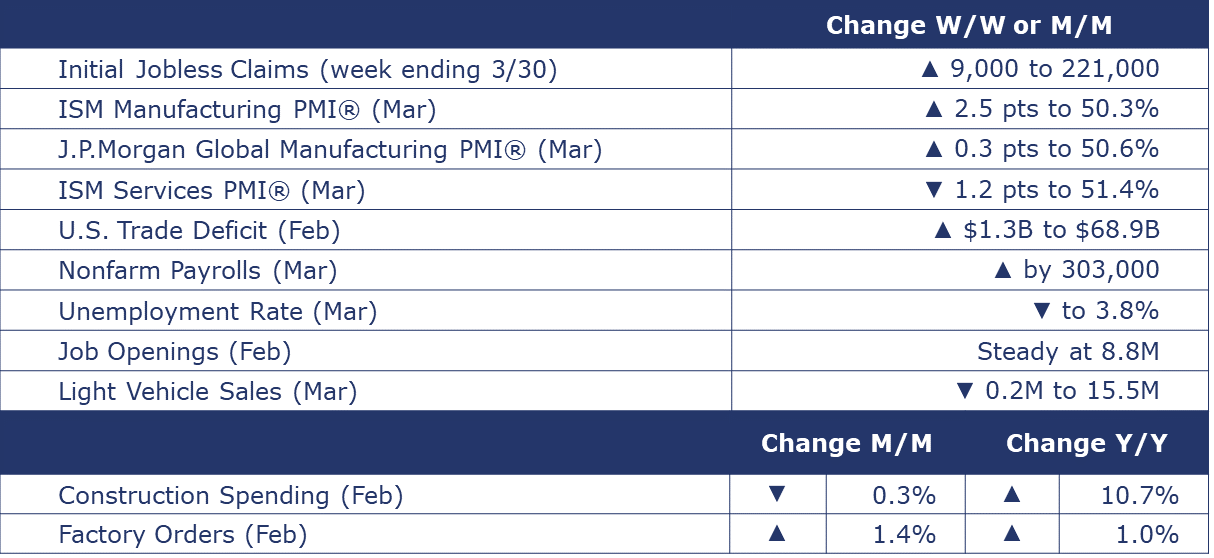
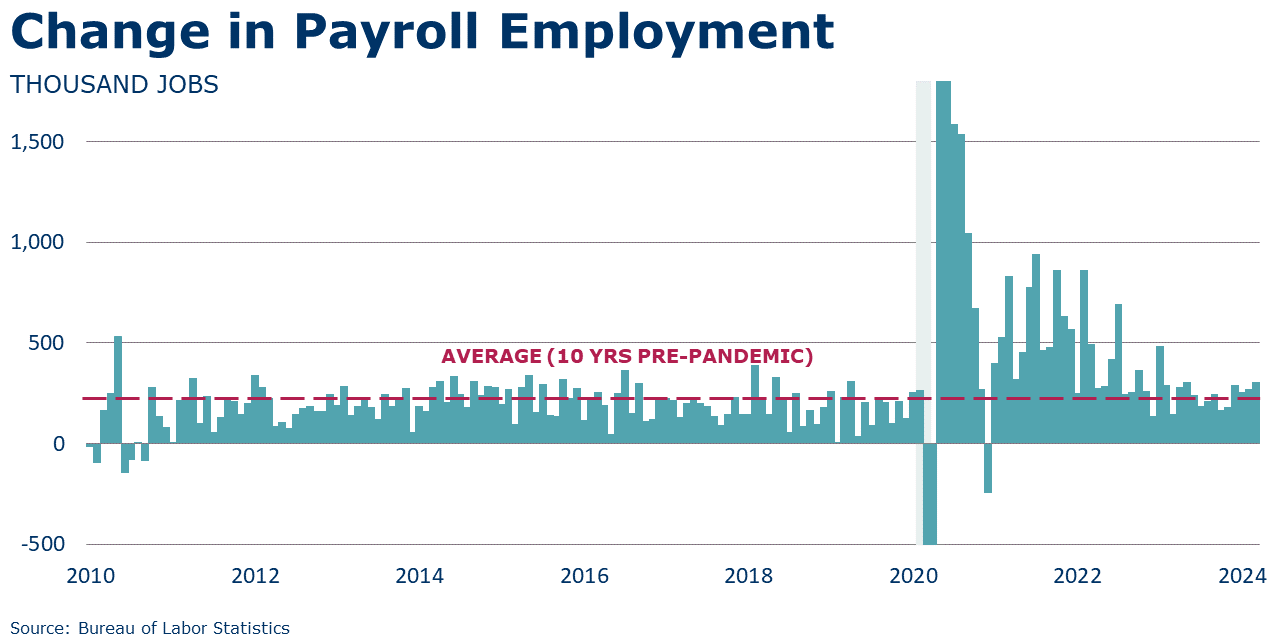
Job growth accelerated in March with nonfarm payrolls expanding by 303,000, once again coming in ahead of expectations. Job gains were broad based, however, there were fewer jobs in nondurable manufacturing and utilities. Employment in temporary help services, a bellwether, continued to drift lower. The average workweek ticked higher and average hourly earnings (for all employees) rose 4.1% Y/Y. The growth in average hourly earnings is a driver of services inflation and the annual increase in March was the lowest in nearly three years. This is good news for the Fed as it evaluates when to start cutting interest rates. The unemployment rate dipped from 3.9% in February to 3.8% in March, still historically low. The labor force grew, and the participation rate rebounded to 62.7%. Employment also rose strongly according to the household survey and the ranks of the unemployed eased slightly.
The number of new jobless claims rose by 9,000 to 221,000 during the week ending March 30. Continuing claims fell by 19,000 to 1.79 million, and the insured unemployment rate for the week ending March 23 was unchanged at 1.2%.
JOLTS data showed stability in job openings, hires, and separations. Demand for labor remained strong with openings holding steady around 8.8 million in February, little changed from January and having eased downward from the series high of 12.2 million in March 2022. Job openings continue to outnumber unemployed people in the U.S. There were 1.4 job openings for every unemployed person in February, down from 2.0 in early 2022. Hires held steady but included a decline in durable goods manufacturing. Separations also held steady with the quits rate remaining low at 2.2% which suggests workers are less willing and/or able to leave their jobs. The number of layoffs rose slightly in February and included increases in leisure and hospitality.
Construction spending fell for the second month in a row, down 0.3% in February. Spending remains 10.7% higher Y/Y, however. Spending was down in all categories except single family housing (up 1.4%) and transportation (up 0.7%). Construction spending was up 17.2% Y/Y in single family and up 6.1% in multifamily. Manufacturing construction spending declined 0.6% but was at a level up 31.8% Y/Y.
Light vehicle sales decreased by 0.2 million to a 15.5 million seasonally adjusted annual rate (SAAR) in March, with decreases in both the passenger car and light truck (including SUVs and minivans) categories. The share of “light trucks” is at 80% and has been steadily increasing for decades.
The ISM Services PMI® declined 1.2 percentage points to 51.4%, a reading indicating expansion in the services sector of the economy. The expansionary reading was the 15th consecutive. The index has pointed to expansion 45 of the last 46 months. The report about March included slower growth of new orders, faster growth in business activity, contracting employment and inventories.
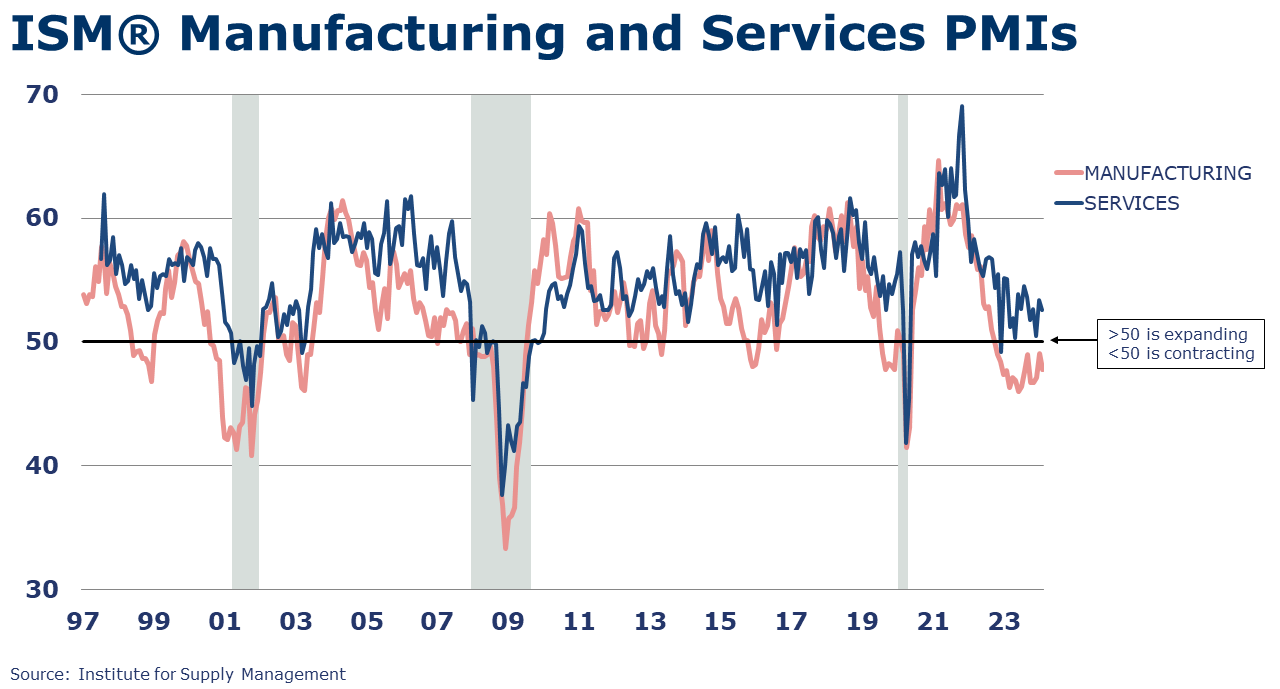
The ISM Manufacturing PMI® signaled expansion in the U.S. industrial sector for the first time since September 2022. The index rose above the 50-mark to 50.3% in March. There were signs that demand was strengthening as new orders (both domestic and exports) picked up, backlog of orders remained in moderate contraction and customer inventories were seen as “too low” for a fourth month. The ISM report indicated output “surged” rising 7.7 points as production increased notably and contraction in labor slowed. Supplier deliveries were faster and raw materials inventories improved (but continue to contract). Raw material prices continued to increase for the third month in a row following 8 months of moderation. Volatility in commodity prices was noted. Chemicals were one of the nine manufacturing industries reporting growth.
J.P.Morgan’s Global Manufacturing PMI® rose another 0.3 points to 50.6% in March, indicating global manufacturing expansion. The reading was the highest since June 2022. Manufacturing output growth strengthened as new orders rose and employment stabilized, according to J.P.Morgan. New export orders continued to decline but at a slower pace. Fourteen of the 29 countries tracked saw expansion in output.
U.S. factory orders rose 1.4% in February following two months of decline. The gain was led by demand for machinery and nondefense aircraft. Core business orders (nondefense capital orders, excluding aircraft) rose 0.7%. Unfilled orders (a measure of the manufacturing pipeline) have held steady so far this year. Manufacturing shipments were up 1.4%. Inventories nudged up 0.3% in February following several months of flat growth. The inventories-to-shipments ratio for the broader manufacturing sector declined slightly from 1.49 to 1.47.
The U.S. deficit in goods and services trade widened by $1.3B to $68.9B in February. Both exports and imports rose over the month. Exports of goods increased in February and included gains in industrial supplies and materials (including crude oil), soybeans, capital goods (including civilian aircraft). Exports of cars declined. Imports of goods also rose and included gains in consumer goods, foods, feeds, and beverages, and auto parts.
ENERGY
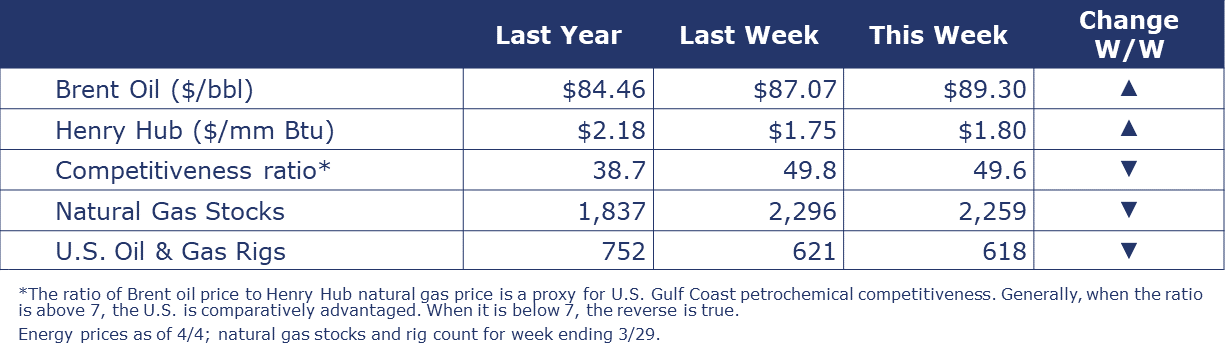
Oil prices rose over the week reaching near six-month highs on heightened risk of escalation in the Middle East, ongoing Ukrainian attacks against Russian refineries and an unconfirmed oil spill in Kazakhstan. U.S. natural gas prices rose but remained near historic lows as the warm winter in the northern hemisphere allowed supplies to build in the U.S. and LNG-importing nations. Working gas in storage declined by 37 Bcf from the previous week. The combined oil and gas rig count came down by 3 to 618.
CHEMICALS
Indicators for the business of chemistry bring to mind a yellow banner.
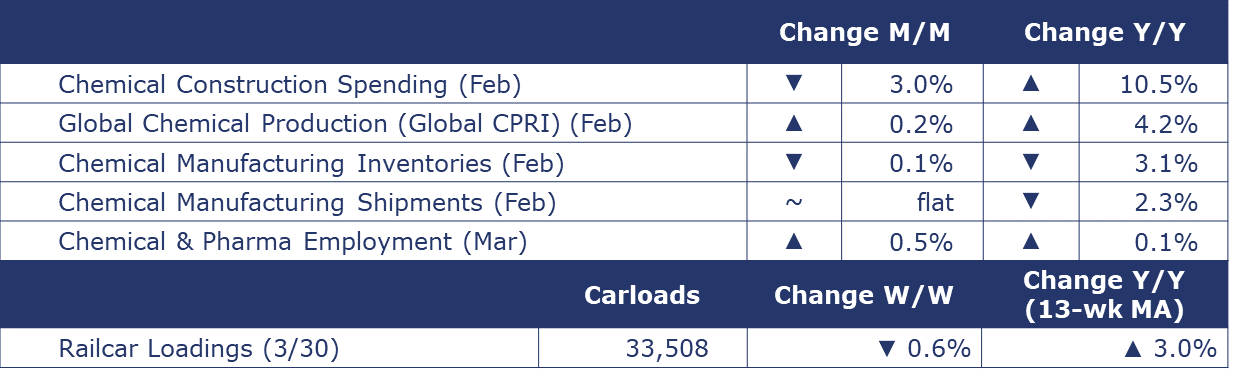
According to data released by the Association of American Railroads, chemical railcar loadings were down to 33,508 for the week ending March 30. Loadings were up 3.0% Y/Y (13-week MA), up (4.5%) YTD/YTD and have been on the rise for 7 of the last 13 weeks.
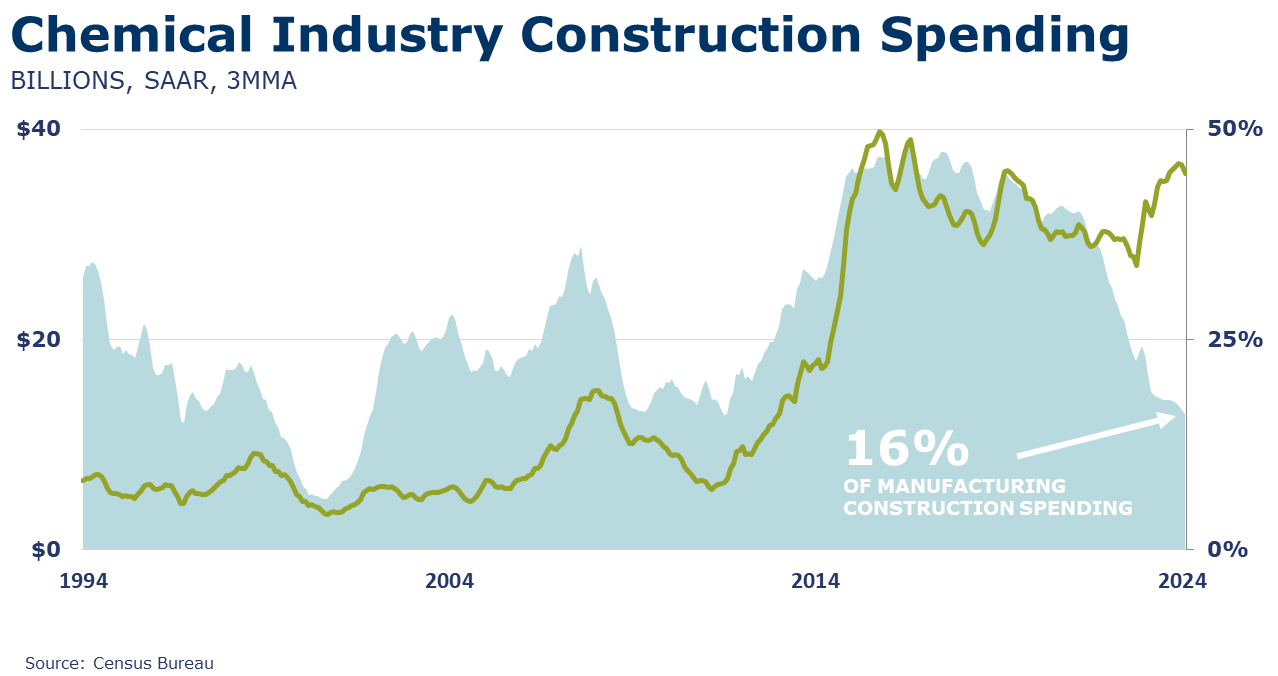
Chemical industry construction spending declined 3.0% in February but remains 10.5% higher Y/Y. Chemical industry spending represented about 16% of total manufacturing construction spending in February.
The ISM Manufacturing PMI® report indicated the chemical industry was one of the nine manufacturing industries that registered growth in March. One respondent from the chemical industry commented, “Performance continues to defy projections of a downturn in activity. Demand remains strong, and the pipeline for orders is robust.” Chemicals reported increased production and rising new orders (including export orders). Chemical manufacturers increased inventories in March. A decrease in employment was reported. A good sign for future production, chemical manufacturers reported their companies’ customers continue to have a shortage of their products in inventory. Chemical companies saw slower supplier deliveries and continue to navigate higher prices for raw materials.
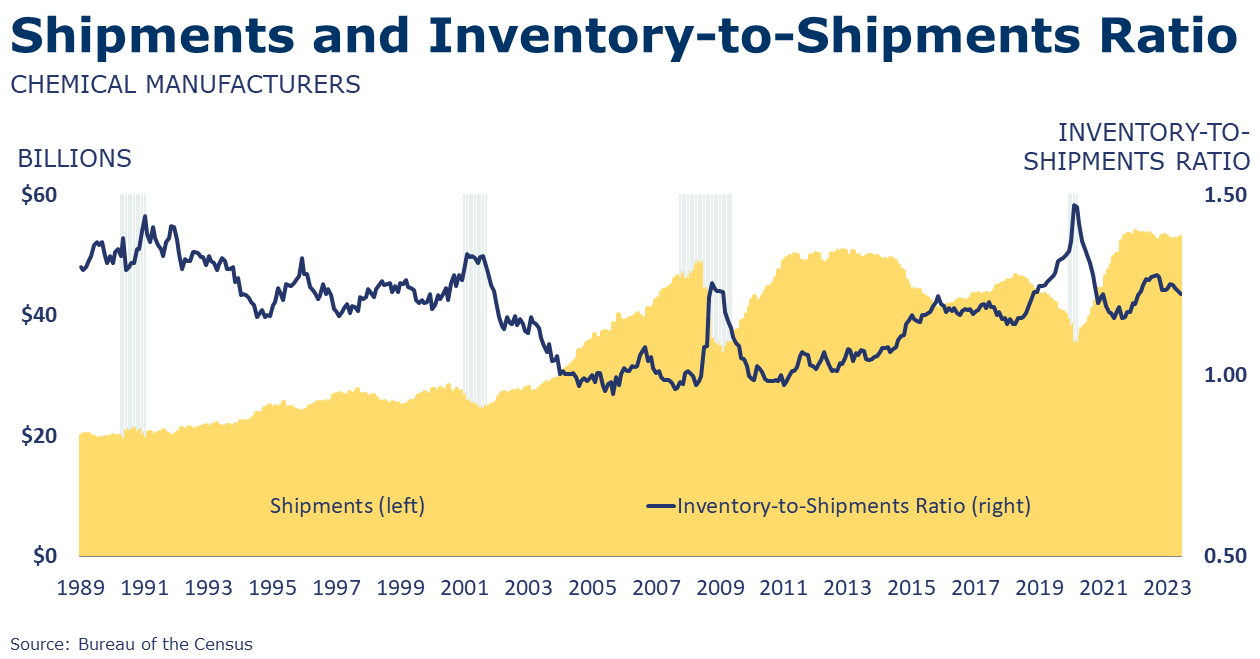
Chemical shipments were flat in February as shipments held steady in “all other chemicals”, declined in agricultural chemicals, and gained in coatings and adhesives. Chemical inventories fell by 0.1% as a build in agricultural chemicals was offset by declines in other chemicals. Compared to a year ago, shipments were 2.3% lower and inventories were down 3.1% Y/Y. The inventories-to-shipments ratio decreased from 1.23 to 1.22 in February. A year ago, the ratio was 1.23.
Chemical and pharmaceutical employment jumped by 4,400 (0.5%) in March to 899,500. The gain reflected increases in both production and non-production workers. Average hourly earnings for production and nonsupervisory workers rose 3.9% Y/Y, the slowest annual growth in wages since October 2022. The average workweek jumped by 42 minutes to 41.5 hours. Combined with the gain in the number of production workers, the labor input into the chemical industry rose, suggesting the chemical industry expanded in March. This was consistent with the ISM Manufacturing PMI® details that reported the chemical industry grew last month.
ACC’s Global Chemical Production Regional Index (Global CPRI) stabilized in February with a 0.2% increase over the previous period. Most regions recorded gains except for South America and Europe, where production declined. Activities in the U.S. improved as production rebounded from the January freeze. China’s output resumed as workers returned to work after the Lunar New Year celebration. Global chemicals production growth was up 4.2% Y/Y
Note On the Color Codes
Banner colors reflect an assessment of the current conditions in the overall economy and the business chemistry of chemistry. For the overall economy we keep a running tab of 20 indicators. The banner color for the macroeconomic section is determined as follows:
Green – 13 or more positives
Yellow – between 8 and 12 positives
Red – 7 or fewer positives
There are fewer indicators available for the chemical industry. Our assessment on banner color largely relies upon how chemical industry production has changed over the most recent three months.
For More Information
ACC members can access additional data, economic analyses, presentations, outlooks, and weekly economic updates through ACCexchange.
In addition to this weekly report, ACC offers numerous other economic data that cover worldwide production, trade, shipments, inventories, price indices, energy, employment, investment, R&D, EH&S, financial performance measures, macroeconomic data, plus much more. To order, visit http://store.americanchemistry.com/.
Every effort has been made in the preparation of this weekly report to provide the best available information and analysis. However, neither the American Chemistry Council, nor any of its employees, agents or other assigns makes any warranty, expressed or implied, or assumes any liability or responsibility for any use, or the results of such use, of any information or data disclosed in this material.
Contact us at ACC_EconomicsDepartment@americanchemistry.com.