MACROECONOMY & END-USE MARKETS
Running tab of macro indicators: 16 out of 20
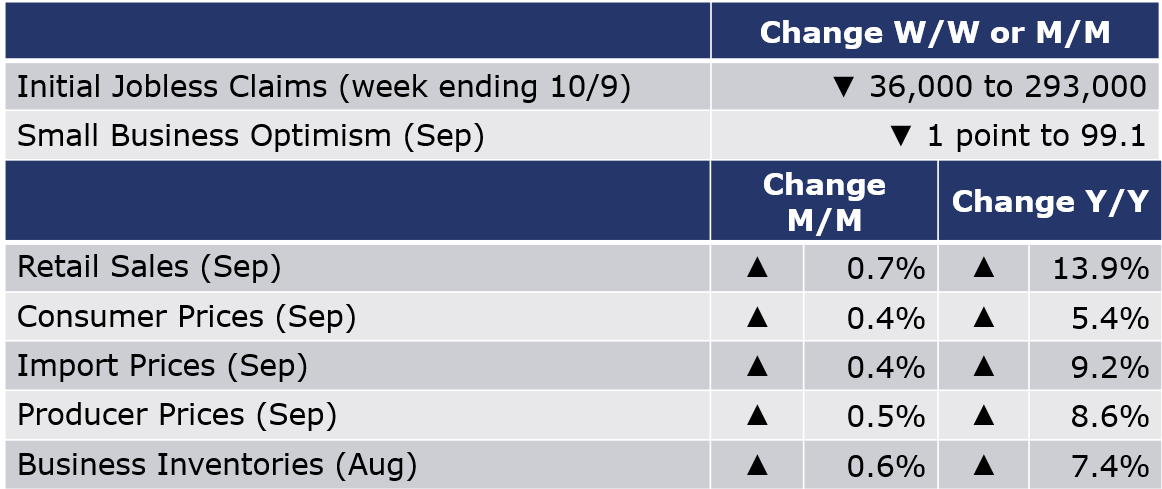
The number of new jobless claims fell by 36,000 to 293,000 during the week ending 9 October. Continuing claims decreased by 134,000 to 2.59 million, and the insured unemployment rate for the week ending 2 October declined by 0.1% points to 1.9%.
With a boost from back-to-school and return-to-work, headline food service and retail sales came in ahead of expectations, up 0.7% in September. There were broad gains across most categories, except electronics and health & personal care stores. Compared to a year ago, retail sales were up 13.9% Y/Y.
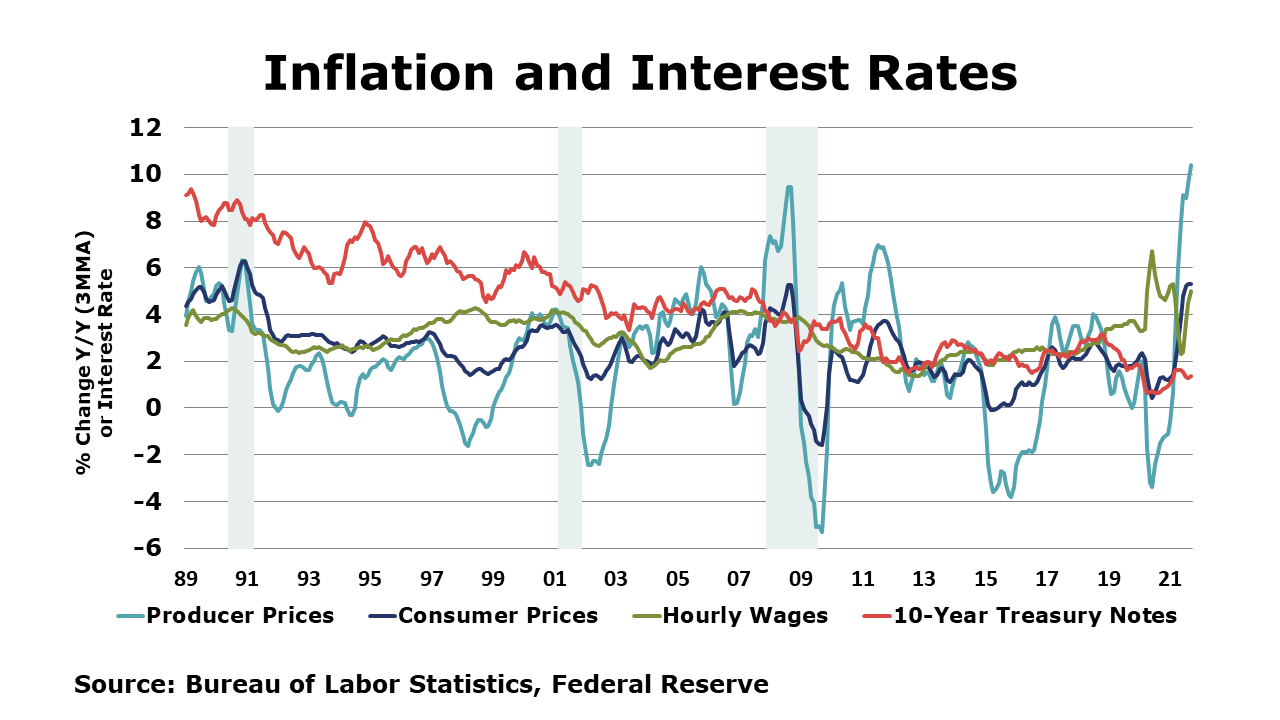
Driven by gains in energy, food, and new vehicles, consumer prices accelerated by 0.4% in September and were higher by 5.4% Y/Y, the highest pace since 2008. Core consumer prices rose 0.2% and were ahead 4.0% Y/Y, a lower comparison than in June and July. Producer prices continued to accelerate in September, up 0.5%, following a 0.7% increase in August and a 1% increase in July. Nearly 80% of the September increase was due to demand for final demand goods, especially energy, where prices rose 2.8% overall and gasoline prices rose 3.9%. Not all goods saw a price increase; the price of plastic resins and materials, for example, fell 3.9%. Compared to a year ago, headline prices were up 8.6% Y/Y while core prices were up by 5.9% Y/Y. With imported fuel prices up in September, import prices also rose by 0.4% (following a 0.3% decline in August). Prices for nonfuel imports were flat. Export prices edged higher by 0.1% as lower prices for agricultural exports offset a small gain in prices for non-agricultural exports. Compared to a year ago, import prices were up by 9.2% Y/Y while export prices were up 16.3% Y/Y.
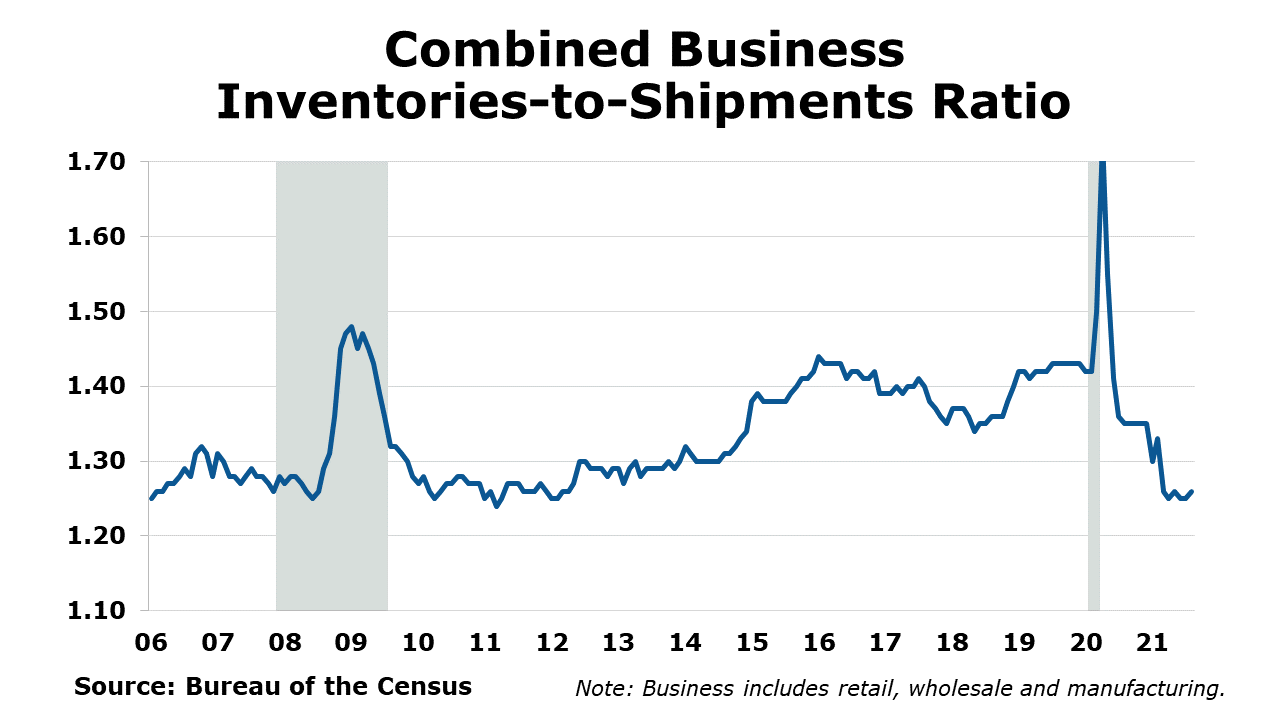
In line with expectations, combined business inventories continued to build in August, up 0.6% on gains across all three segments. Sales edged lower by 0.1%, the first decline since May. Compared to a year ago, sales were up 15.3% Y/Y while inventories were up 7.4% Y/Y. The inventories-to-sales ratio ticked higher to 1.26 from a recent low of 1.25 in July. A year ago, the ratio was 1.35.
Citing labor shortages and inflation pressures, small business optimism fell 1 point to 99.1 according to the National Federation of Independent Business (NFIB). It was the lowest level since March and reflects growing challenges for small businesses.
ENERGY
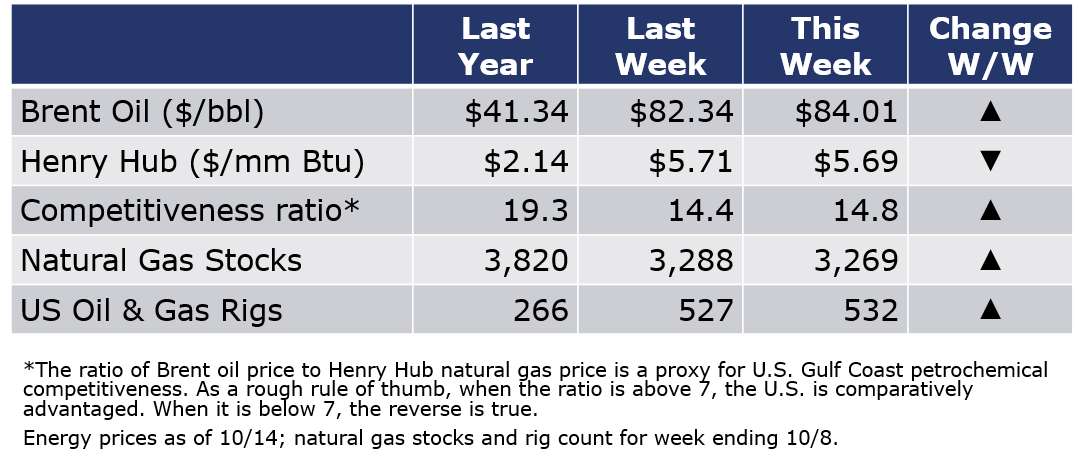
The combined oil and gas rig count rose by five to 532 rigs during the week ending 8 October. Oil prices continued to advance during the week as OPEC dismissed calls for additional production increases in light of growing concerns that high natural gas prices in Europe and Asia could motivate fuel switching to oil. Natural gas prices remained elevated as inventories rose by less than expected.
CHEMICALS
For the business of chemistry, the indicators still bring to mind a green banner for basic and specialty chemicals.
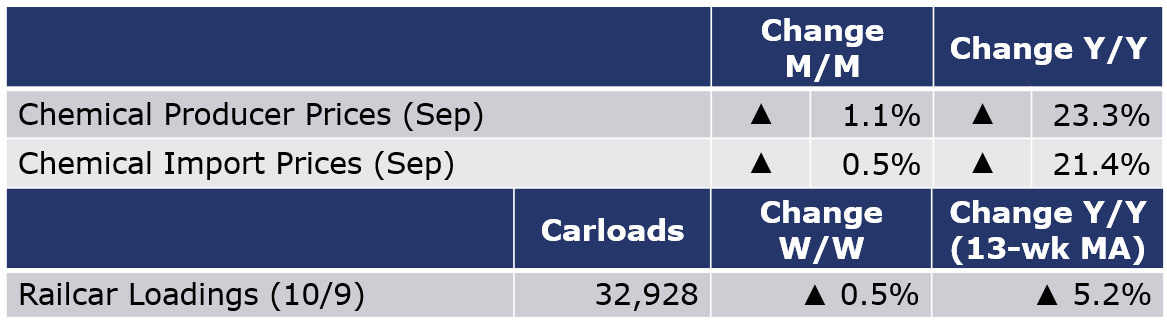
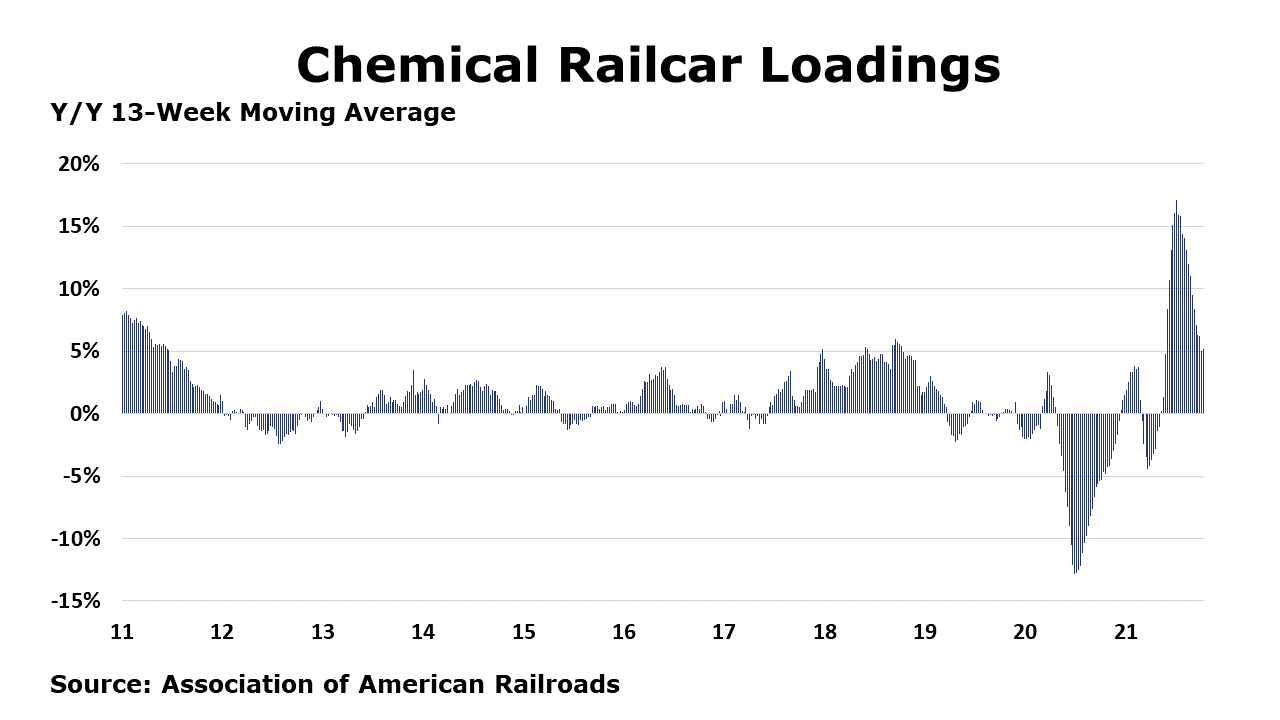
According to data released by the Association of American Railroads, chemical railcar loadings, the best ‘real time’ indicator of chemical industry activity, rose slightly (by 166 carloads) to 32,928 railcars during the week ending 9 October (week 40). Loadings were up 6.0% Y/Y, up 5.6% YTD/YTD and have been on the rise for 8 of the last 13 weeks.
Chemical producer prices rose by 1.1% in September, the 16th consecutive monthly increase. Prices rose across all categories, with the exception of plastic resins which eased following sixteen consecutive months of gains. Compared to a year ago, chemical prices were up 23.3% Y/Y. Chemical import prices rose by 0.5% while export prices eased by 1.3%. Compared to a year ago, prices for chemical imports were higher by 21.4% Y/Y while export prices were up 24.6% Y/Y.
Note On the Color Codes
The banner colors represent observations about the current conditions in the overall economy and the business chemistry. For the overall economy we keep a running tab of 20 indicators. The banner color for the macroeconomic section is determined as follows:
Green – 13 or more positives
Yellow – between 8 and 12 positives
Red – 7 or fewer positives
For the chemical industry there are fewer indicators available. As a result we rely upon judgment whether production in the industry (defined as chemicals excluding pharmaceuticals) has increased or decreased three consecutive months.
For More Information
ACC members can access additional data, economic analyses, presentations, outlooks, and weekly economic updates through MemberExchange.
In addition to this weekly report, ACC offers numerous other economic data that cover worldwide production, trade, shipments, inventories, price indices, energy, employment, investment, R&D, EH&S, financial performance measures, macroeconomic data, plus much more. To order, visit http://store.americanchemistry.com/.
Every effort has been made in the preparation of this weekly report to provide the best available information and analysis. However, neither the American Chemistry Council, nor any of its employees, agents or other assigns makes any warranty, expressed or implied, or assumes any liability or responsibility for any use, or the results of such use, of any information or data disclosed in this material.
Contact us at ACC_EconomicsDepartment@americanchemistry.com