MACROECONOMY & END-USE-MARKETS
Running tab of macro indicators: 13 out of 20
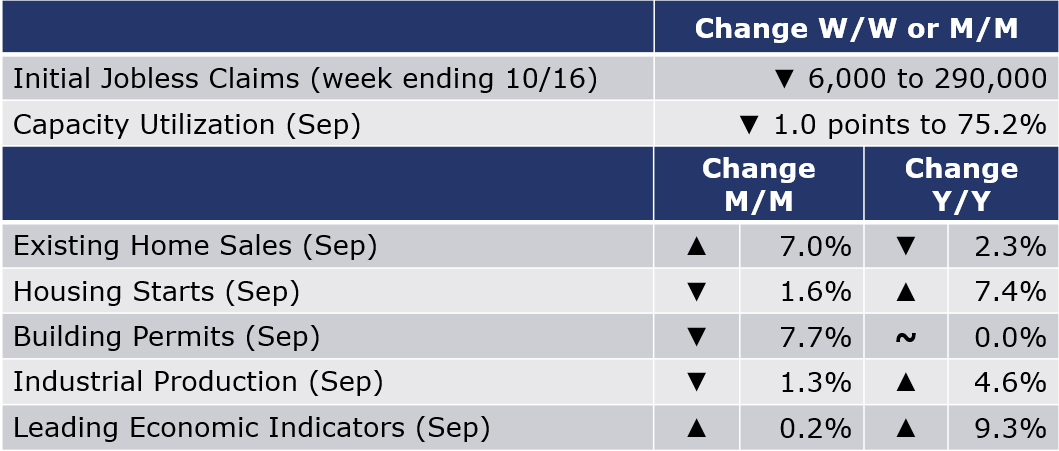
The number of new jobless claims fell by 6,000 to 290,000 during the week ending 16 October. Continuing claims decreased by 122,000 to 2.5 million, and the insured unemployment rate for the week ending 9 October declined by 0.1 points to 1.8%.
After last month’s drop, existing home sales rose 7.0% in September (down 2.3% Y/Y) with increases across all four major regions. Inventories eased 0.8% to 1.27 million units, representing a 2.4-month supply. With the tight inventory situation, median existing home prices were up 13.3% Y/Y to nearly $352,800.
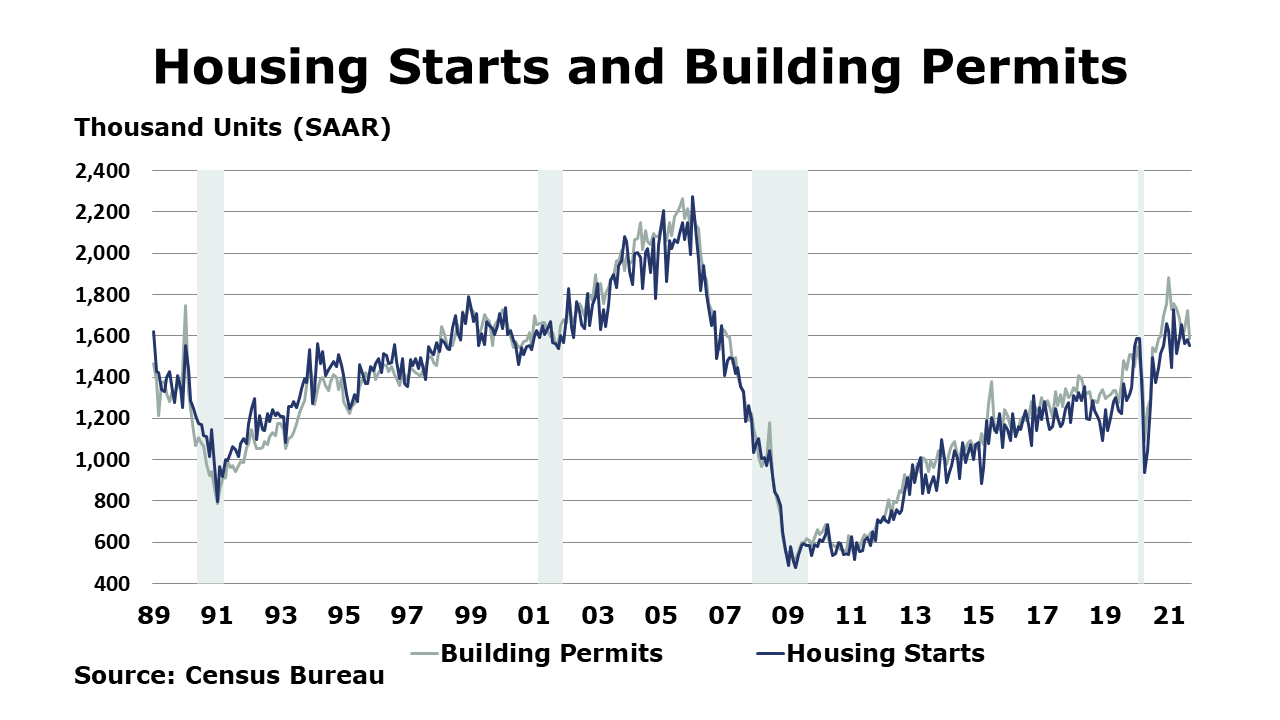
Reflecting labor and material shortages, housing starts slid lower by 1.6% in September. The decline was centered in multifamily as chemistry-intensive single-family starts were flat, following two months of declines. Gains in the Midwest and West offset declines in the Northeast and South. Forward-looking building permits also fell, down 7.7%. Separately, the NAHB/Wells Fargo homebuilder sentiment measure edged higher for a second month in October on strong consumer demand.
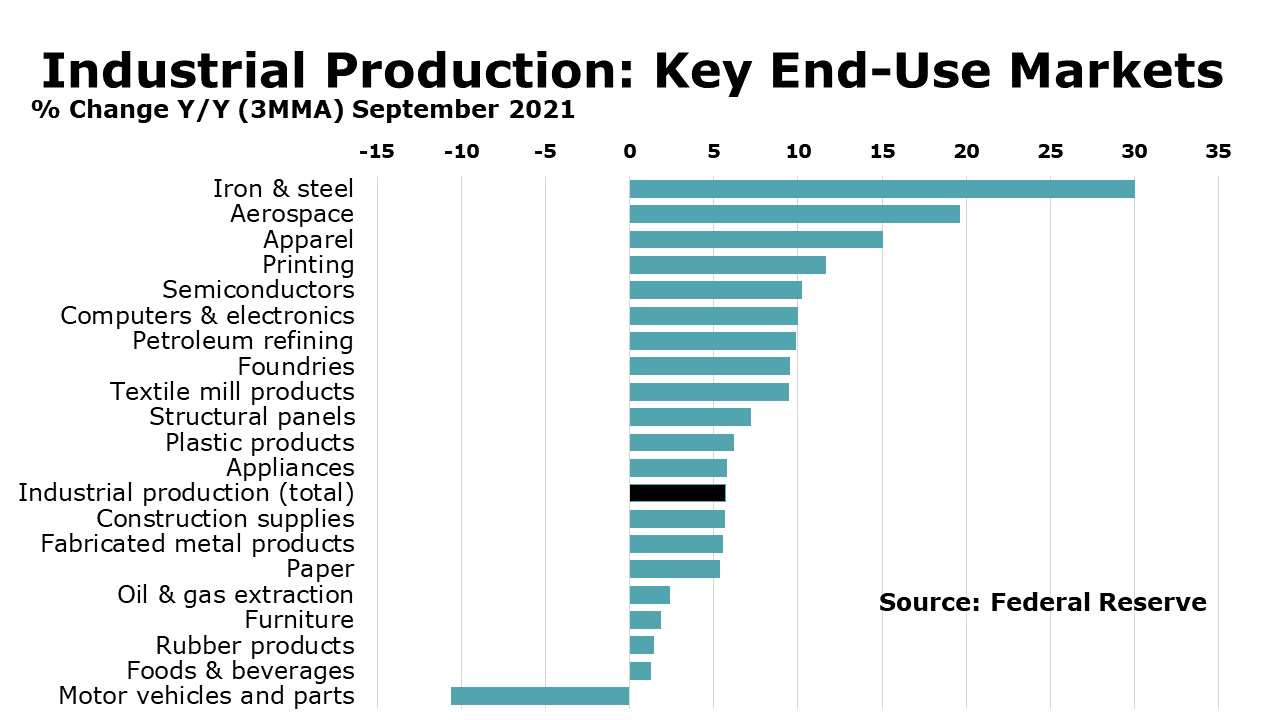
Between continued supply chain disruptions and the lingering effects of Hurricane Ida, which hit at the end of August, industrial production fell 1.3% in September. The Fed estimates that Hurricane Ida alone lowered industrial production by 0.6%. Both mining and utility output fell sharply. NAICS-based manufacturing output fell 0.8% with gains in primary metals, electrical equipment & appliances, aerospace, furniture, textiles, and printing offset by declines in motor vehicles (down 7.2%), chemicals, petroleum products, wood products, and nonmetallic mineral products. Compared to a year ago, industrial production was up 4.6% Y/Y. Capacity utilization fell by 1.0 percentage points to 75.2% during the month, but remained higher than 72.1% in September 2020.
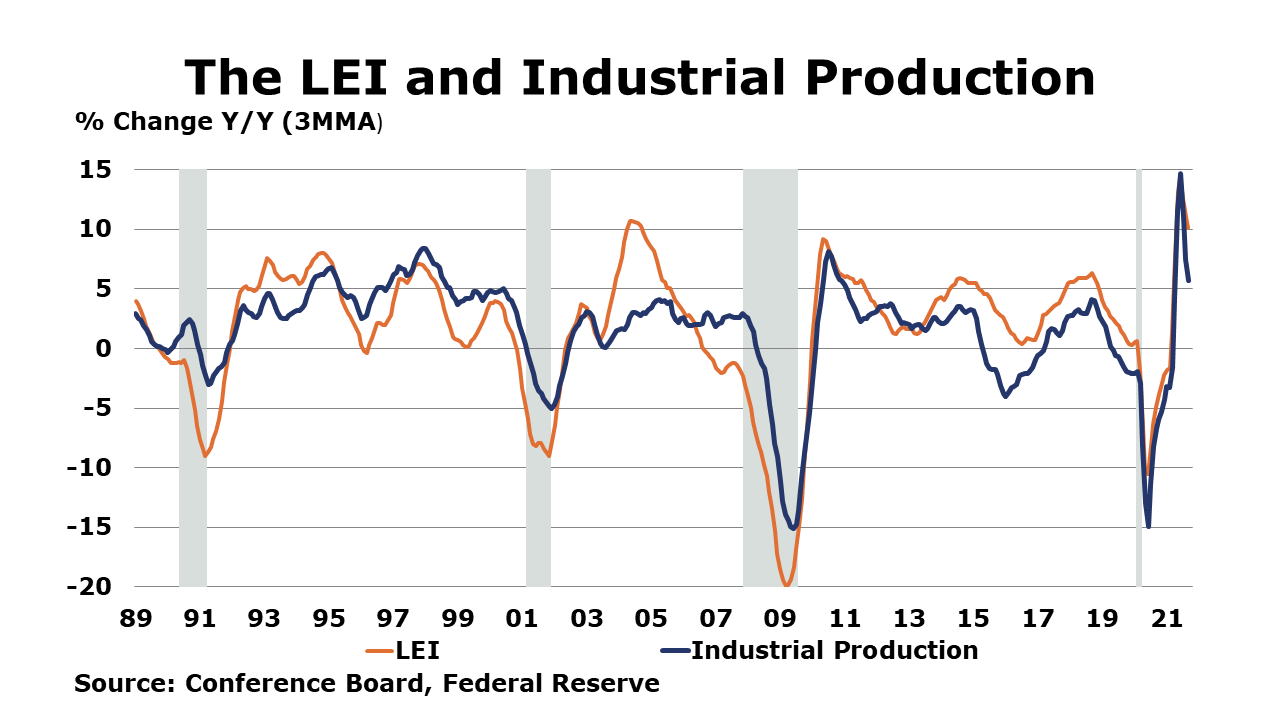
Reflecting continued supply chain constraints and impacts from the Delta variant, the Conference Board’s Index of Leading Economic Indicators rose just 0.2% in September, following gains of 0.9% and 0.8% in July and August. There were broad gains among the components, but the deceleration in the LEI suggests more moderate growth prospects compared to earlier in the year.
ENERGY
The combined oil and gas rig count rose by nine to 543 rigs during the week ending 15 October. Despite ending higher compared to last Thursday, oil prices eased toward the end of the week on forecasts for a warmer weather in the U.S. due the reemergence of La Niña weather patterns. Natural gas prices also eased on a solid gain in inventories and the warmer forecast.
CHEMICALS
For the business of chemistry, the indicators bring to mind a yellow banner for basic and specialty chemicals.
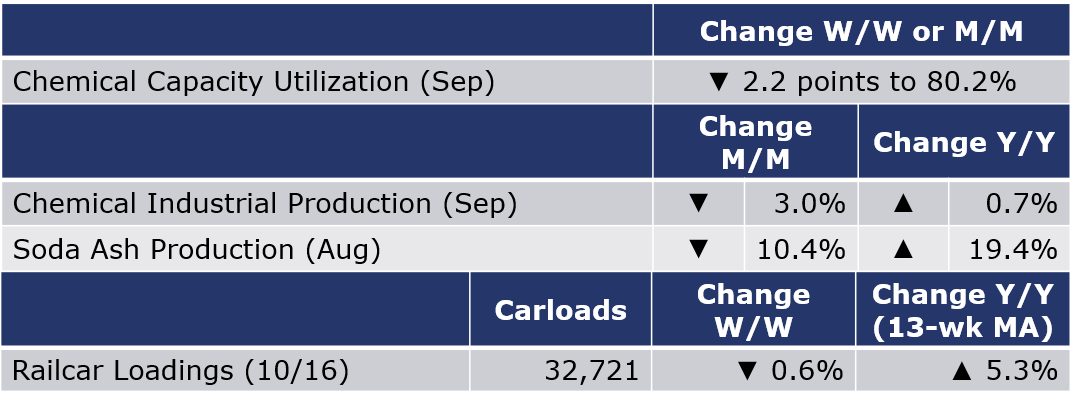
According to data released by the Association of American Railroads, chemical railcar loadings, the best ‘real time’ indicator of chemical industry activity, fell slightly (by 207 carloads) to 32,721 railcars during the week ending 16 October (week 41). Loadings were up 10.1% Y/Y, up 5.7% YTD/YTD and have been on the rise for 7 of the last 13 weeks.
The U.S. Geological Survey reported that monthly production of soda ash in August was 878 thousand tons, down 10.4% compared to the previous month but up 19.4% Y/Y on a YTD basis. Stocks fell 9.6% over July to 236 thousand tons at the end of the month, an 8-day supply. Ending stocks were down 31.0% Y/Y.
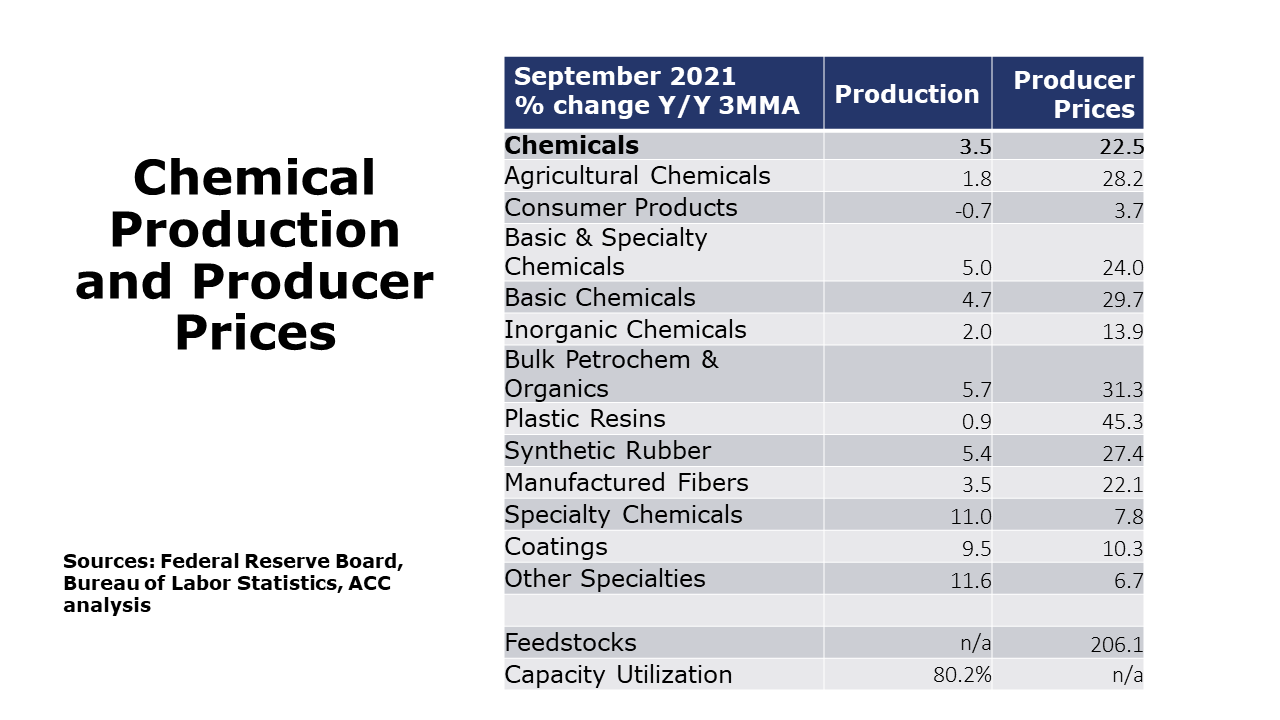
Reflecting the impact of Hurricane Ida, and to a lesser extent Hurricane Nicholas, chemical production fell 3.0% in September following a 1.6% decline in August. There were declines among multiple segments, but the hardest hit were organic chemicals, inorganic chemicals, coatings & adhesives, and agricultural chemicals. There were also smaller declines in the output of plastic resins and other specialty chemicals. These declines were partially offset by gains in the production of consumer products, synthetic resin, and manufactured fibers. Compared to a year ago, production was up by 0.7%. Chemical capacity utilization also fell 2.2 points to 80.2%, the lowest level since March when Gulf Coast producers were still recovering from the impacts of the February freeze. A year ago, capacity utilization was only a slightly higher (80.8%) due to the impact of Hurricane Laura.
Note On the Color Codes
The banner colors represent observations about the current conditions in the overall economy and the business chemistry. For the overall economy we keep a running tab of 20 indicators. The banner color for the macroeconomic section is determined as follows:
Green – 13 or more positives
Yellow – between 8 and 12 positives
Red – 7 or fewer positives
For the chemical industry there are fewer indicators available. As a result we rely upon judgment whether production in the industry (defined as chemicals excluding pharmaceuticals) has increased or decreased three consecutive months.
For More Information
ACC members can access additional data, economic analyses, presentations, outlooks, and weekly economic updates through MemberExchange.
In addition to this weekly report, ACC offers numerous other economic data that cover worldwide production, trade, shipments, inventories, price indices, energy, employment, investment, R&D, EH&S, financial performance measures, macroeconomic data, plus much more. To order, visit http://store.americanchemistry.com/.
Every effort has been made in the preparation of this weekly report to provide the best available information and analysis. However, neither the American Chemistry Council, nor any of its employees, agents or other assigns makes any warranty, expressed or implied, or assumes any liability or responsibility for any use, or the results of such use, of any information or data disclosed in this material.
Contact us at ACC_EconomicsDepartment@americanchemistry.com