Running tab of macro indicators: 7 out of 20

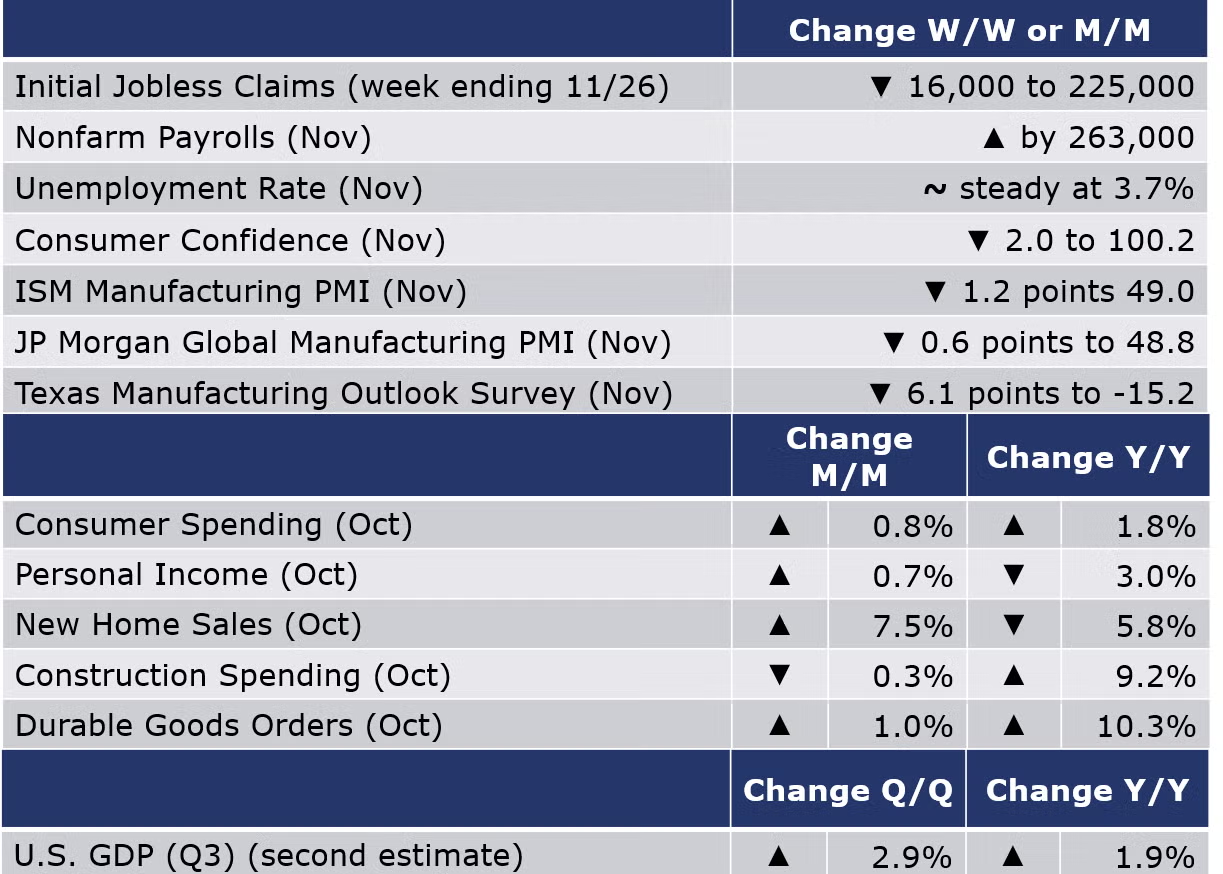
Nonfarm payrolls expanded by 263,000 in November, following an upwardly revised gain of 284,000 in October. While it was the slowest monthly gain this year, it was well above expectations and calls into question the efficacy of Fed rate hikes. Average wages rose 5.1% Y/Y, also higher than expected. Job gains were mixed with gains in goods-producing industries (including manufacturing) and many service sectors. Payrolls fell in wholesale & retail trade and transportation & warehousing. Temporary staffing services employment also fell for a fourth consecutive month. In contrast to the establishment survey (discussed above), the household survey found that employment contracted for a second month. The disagreement between the two series is not unusual during turning points, however. The labor force also continued to edge lower (and with it, the participation rate). With unemployment and labor force declining, the unemployment rate was unchanged at 3.7%.
Separately, the number of job openings eased in October to 10.3 million and the number and rate of hires were little changed. Voluntary quits (a measure of workers’ willingness or ability to leave their job) were also little changed. Compared against the number of unemployed people, there were 1.7 job openings per unemployed person in October. The labor market remains very tight.
The number of new jobless claims fell by 16,000 to 225,000 during the week ending 26 November, which included the Thanksgiving holiday. Continuing claims increased by 57,000 to 1.6 million, and the insured unemployment rate for the week ending 19 November was unchanged at 1.1%.
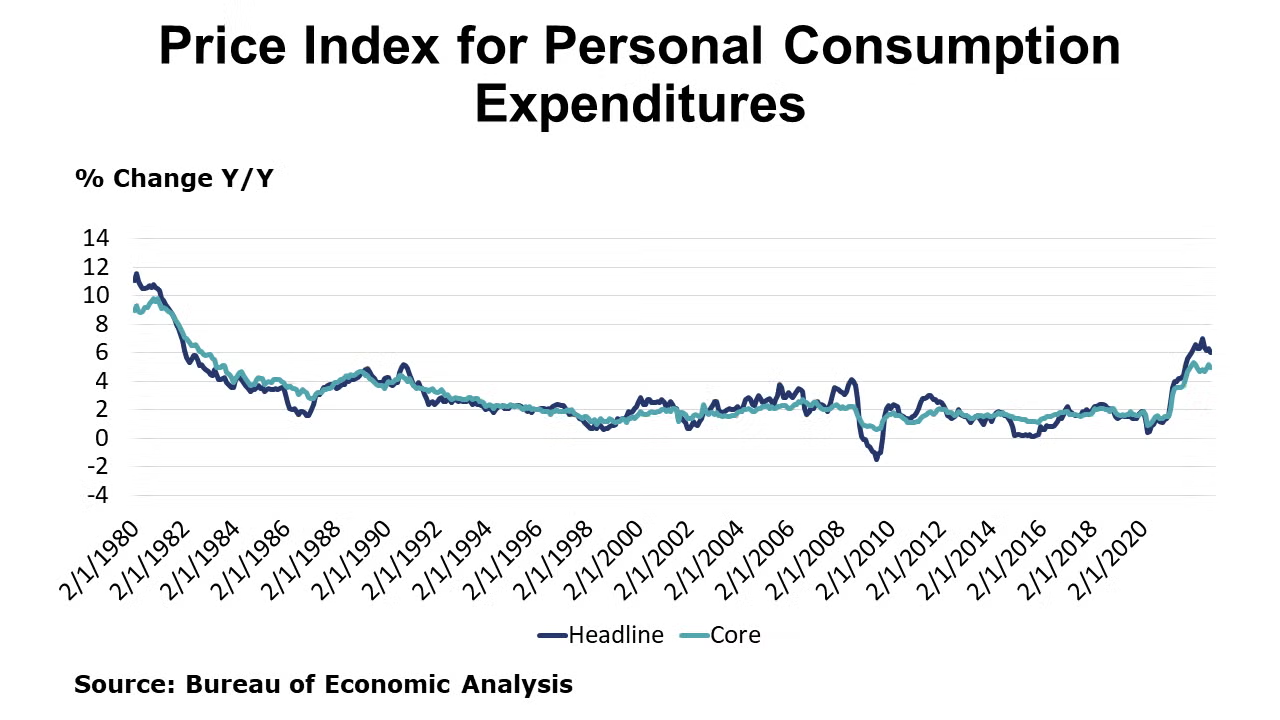
Consumer spending rose by a better than expected 0.8% in October, with the strongest gain in durable goods spending since January, with a sharp increase in spending on autos that are becoming more available. There were also smaller gains in spending on nondurable goods and services. Personal income also rose by 0.7%. Compared to a year ago, consumer spending was up 1.8% Y/Y (a slowing comparison) while income was off 3.0%. With some spending being financed by lower savings, the savings rate fell to 2,3%, the second lowest rate on record! The price index for personal consumption expenditures (PCE) was up 6.0% Y/Y, the slowest annual pace in nearly a year while growth in core PCE price index edged lower to 5.0%, still well above the Fed’s preferred 2% pace.
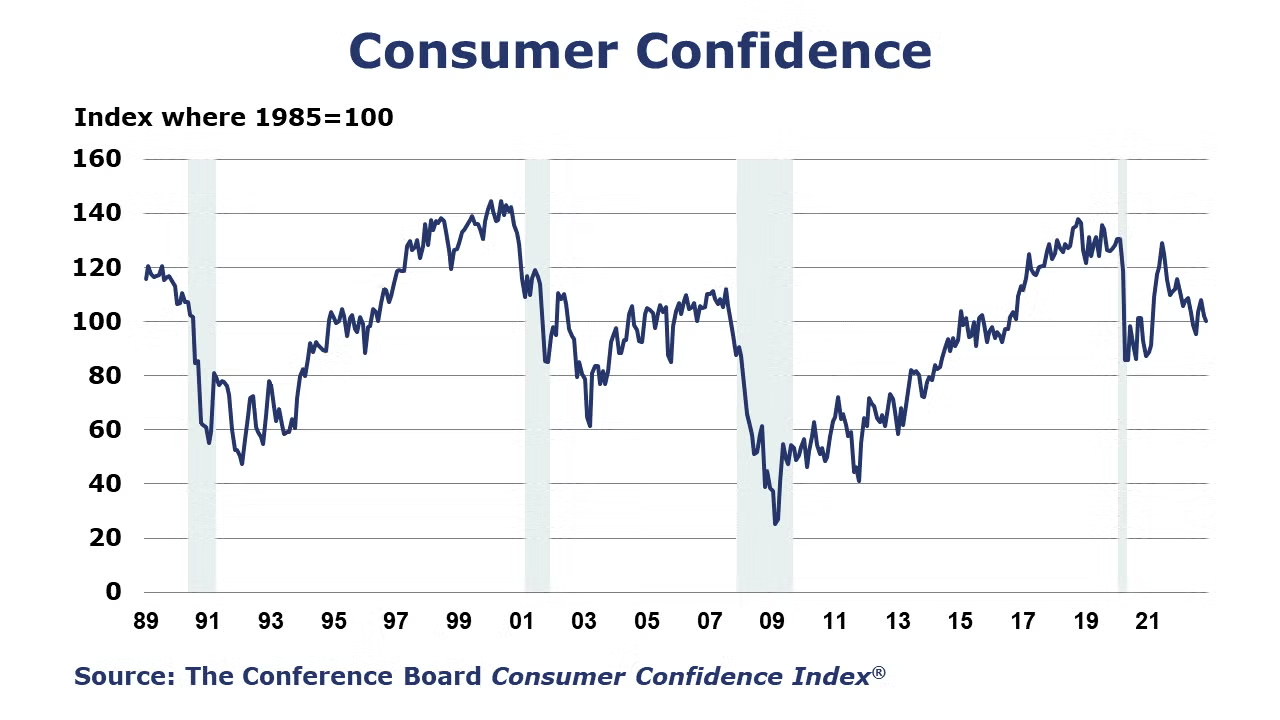
The Conference Board Consumer Confidence Index® fell to 100.2 in November (from 102.2 in October), the second monthly decline, and the lowest level since July. The increase in gas and food prices led to increased inflation expectations and consumer intent to purchase large items (e.g., houses, cars) fell. Consumers’ assessment of current business conditions was mixed but their assessment of the labor market was more favorable, with a 1.0% increase in consumers indicating jobs were “plentiful.”
New home sales rose by 7.5% in October, following a downwardly revised September estimate. Sales were higher in the Northeast and South but fell in the Midwest and West. The inventory of unsold homes edged higher by 1.5%. As a result, the supply of unsold homes fell from 9.4 months to 8.9 months. The median sales price rose by 15.4% Y/Y.
Construction spending dipped 0.3% in October from September’s revised figure. Residential construction spending also dropped by 0.3%. Spending on multi-family home construction rose 0.6% while spending on single family home construction fell 2.6%. Non-residential spending declined 0.8% in October; the largest increase was in amusement and recreation (3.8%). Public spending on construction rose 0.6%.
Durable goodsorders rose 1.0% in October, following smaller gains in August and September. Gains were broad based with increases across most major sectors. The largest gains were in aircraft, computers, and communications equipment. Core business orders rose by 0.7% following a decline in September. Compared to a year ago, headline orders were up 10.3% while core business orders were up 6.4% Y/Y.
In its second of three estimates, the BEA reported that Q3 U.S. GDP expanded at a 2.9% seasonally adjusted annual rate, higher than the 2.6% gain in last month’s “advance” estimate. The second estimate primarily reflected upward revisions to consumer spending and nonresidential fixed investment that were partly offset by a downward revision to private inventory investment. Imports, which are a subtraction in the calculation of GDP, decreased more than previously estimated. Compared to Q3 2021, U.S. GDP was up 1.9% Y/Y. The PCE price index increased 4.3%, an upward revision of 0.1 percentage point.
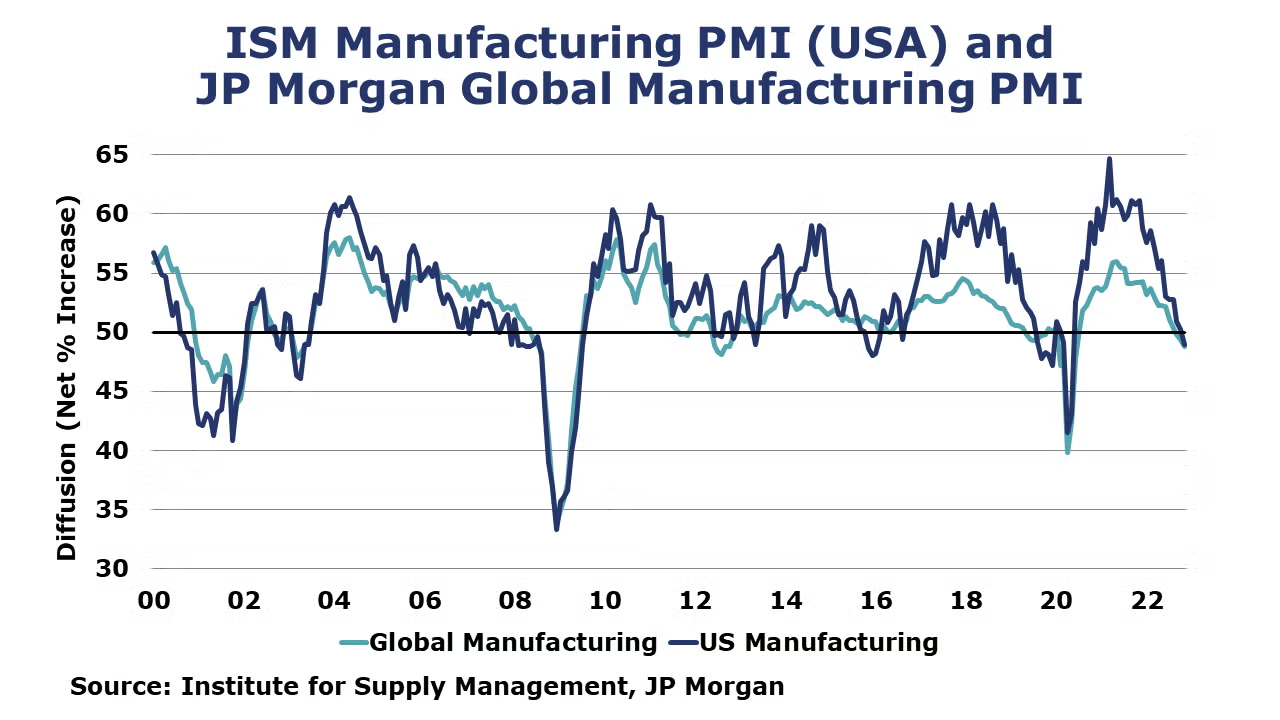
At 49.0%, the ISM’s Manufacturing PMI® contracted in November for the first time since May 2020. Out of 18 industries tracked, only six reported growth. Demand eased, with new orders remaining in contraction territory. Production also declined and contributed to a negative 2.4 percent point impact on the Manufacturing PMI calculation. Supply challenges are easing with faster deliveries, while inventories expanded at a slower rate.
The JP Morgan Global Manufacturing PMI fell in November to its lowest since June 2020 as the headline index eased by 0.6 points to 48.8. Most nations registered contraction in their headline PMIs, with only Australia, India, Indonesia, Kazakhstan, Russia, Thailand, and the Philippines recording expansion. Both production and new orders continued to fall while inventories grew. Price inflation and supply chain pressures eased as global goods trade flows softened. Together, the signs from this release point to weakening demand and lower production.

Oil prices were up from a week ago and the EU has tentatively agreed to a $60/barrel price cap on Russian crude. OPEC+ will meet again on Sunday and is widely expected to adhere to its current plans to reduce production by 2 million BPD. U.S. natural gas prices eased compared to a week ago on solid production gains. The combined oil and gas rig count rose by four to 627.
For the business of chemistry, the indicators still bring to mind a yellow banner for basic and specialty chemicals.
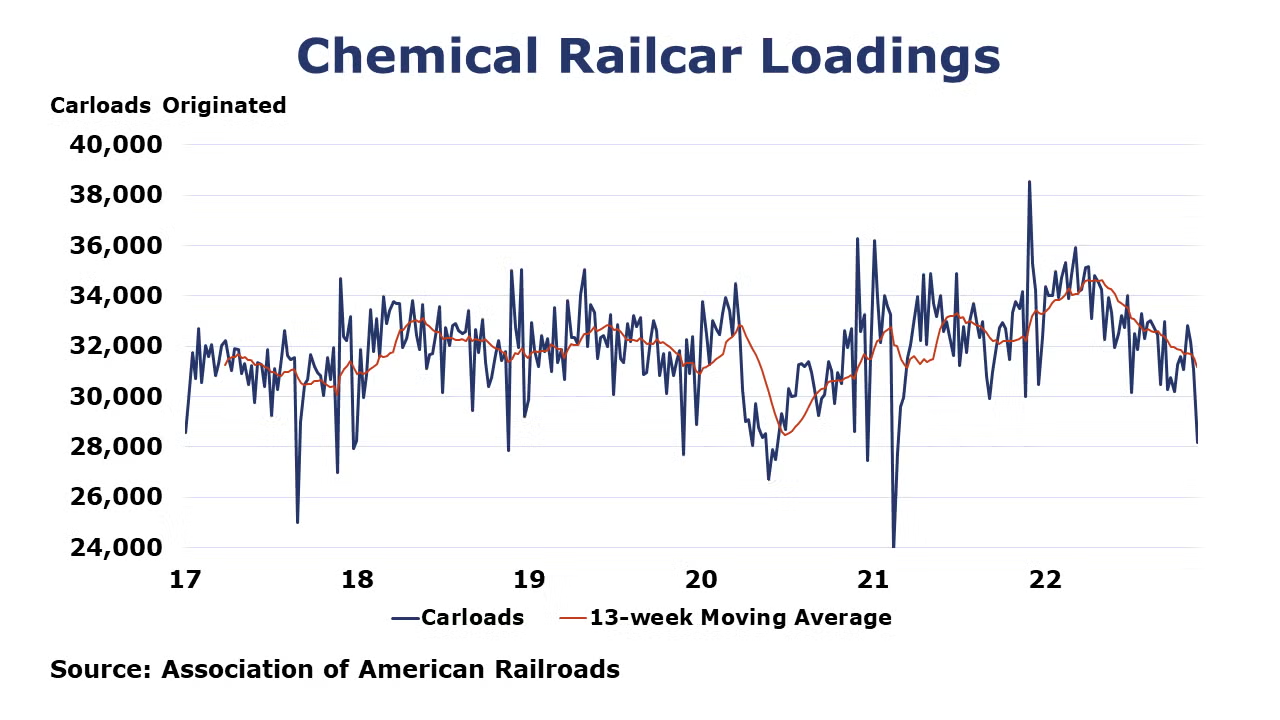
According to data released by the Association of American Railroads, chemical railcar loadings were down 9.3% W/W to 28,184 for the week ending 26 November, which included the Thanksgiving holiday. Loadings were down 3.1% Y/Y (13-week MA), up 1.7% YTD/YTD and have been on the rise for 5 of the last 13 weeks.
Within the details of the ISM report, the chemical industry was reported to have contracted in November. There were contractions in new orders, production, employment, and new export orders. One chemical industry respondent noted that “Future volumes are on a downward trend for the next 60 days”, which is consistent with the contraction observed. The chemical industry was one of 6 industries that reported that customer inventories as too high.
Chemical industry employment (including pharmaceuticals) grew by 4,700 (0.5%) in November with gains in both production workers and supervisory/non-production jobs. Compared to a year ago, chemical industry employment was higher by 30,700 (4.6%). Average hourly wages for production workers were up 5.2% Y/Y, the fastest pace since mid-2018. The average workweek for chemical industry workers rose by 18 minutes in November to 41.3 hours and the total labor input into the chemical industry was higher by 0.3% in November, in contrast with the ISM report that suggested that the chemical industry output contracted.
Chemical industry construction spending edged sharply lower (17.7%) in October. Compared to a year ago, chemical construction spending was off by 25.8%.
Note On the Color Codes
The banner colors represent observations about the current conditions in the overall economy and the business chemistry. For the overall economy we keep a running tab of 20 indicators. The banner color for the macroeconomic section is determined as follows:
Green – 13 or more positives
Yellow – between 8 and 12 positives
Red – 7 or fewer positives
For the chemical industry there are fewer indicators available. As a result we rely upon judgment whether production in the industry (defined as chemicals excluding pharmaceuticals) has increased or decreased three consecutive months.
For More Information
ACC members can access additional data, economic analyses, presentations, outlooks, and weekly economic updates through MemberExchange.
In addition to this weekly report, ACC offers numerous other economic data that cover worldwide production, trade, shipments, inventories, price indices, energy, employment, investment, R&D, EH&S, financial performance measures, macroeconomic data, plus much more. To order, visit http://store.americanchemistry.com/.
Every effort has been made in the preparation of this weekly report to provide the best available information and analysis. However, neither the American Chemistry Council, nor any of its employees, agents or other assigns makes any warranty, expressed or implied, or assumes any liability or responsibility for any use, or the results of such use, of any information or data disclosed in this material.
Contact us at ACC_EconomicsDepartment@americanchemistry.com

