Next week is the Thanksgiving holiday, so we will not publish the Weekly Chemistry and Economic Trends report.
Over the next two weeks, we’ll be looking at incoming data on new and existing home sales, durable goods orders, consumer spending, personal income, the Leading Economic Index®, ISM Manufacturing PMI®, and construction spending.
Running tab of macro indicators: 8 out of 20
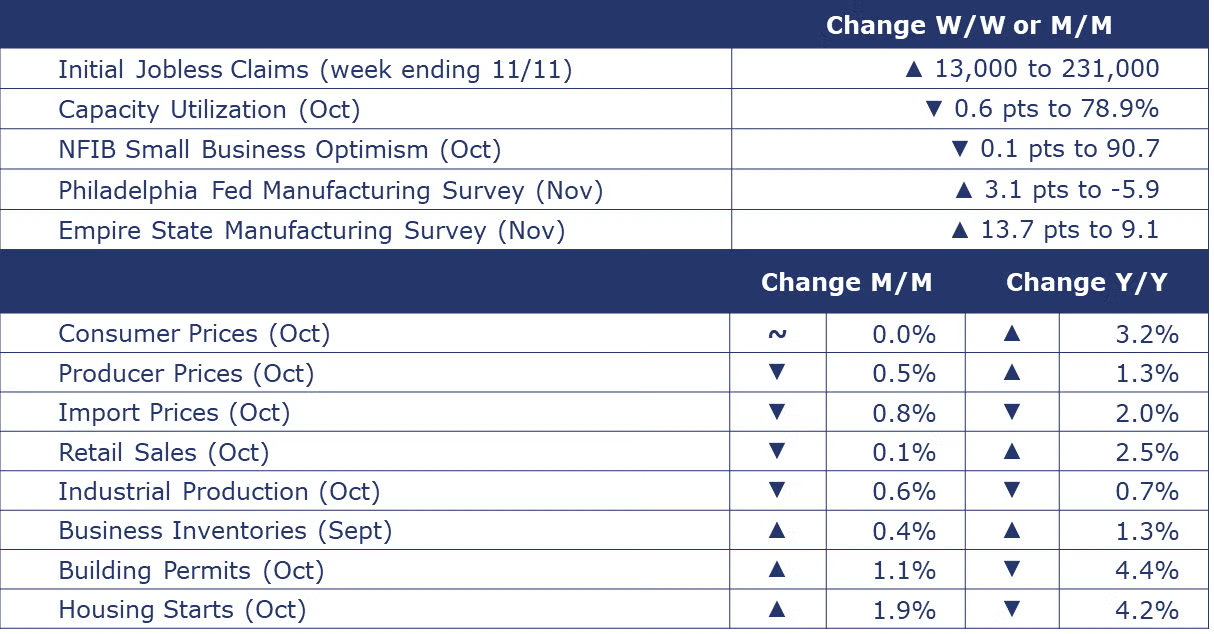
The number of new jobless claims rose by 13,000 to 217,000 during the week ending November 11. Continuing claims increased by 33,840 to 1.633 million, and the insured unemployment rate for the week ending November 4 was up 0.1 percentage point to 1.3%.
The first decline since March, retail sales edged down 0.1% in October, after an upwardly revised 0.9% increase in September. The decline was recorded in most sectors except for electric and appliances, food and beverage, health and personal care, online retailers, and restaurants. Sales were up 2.5% Y/Y.
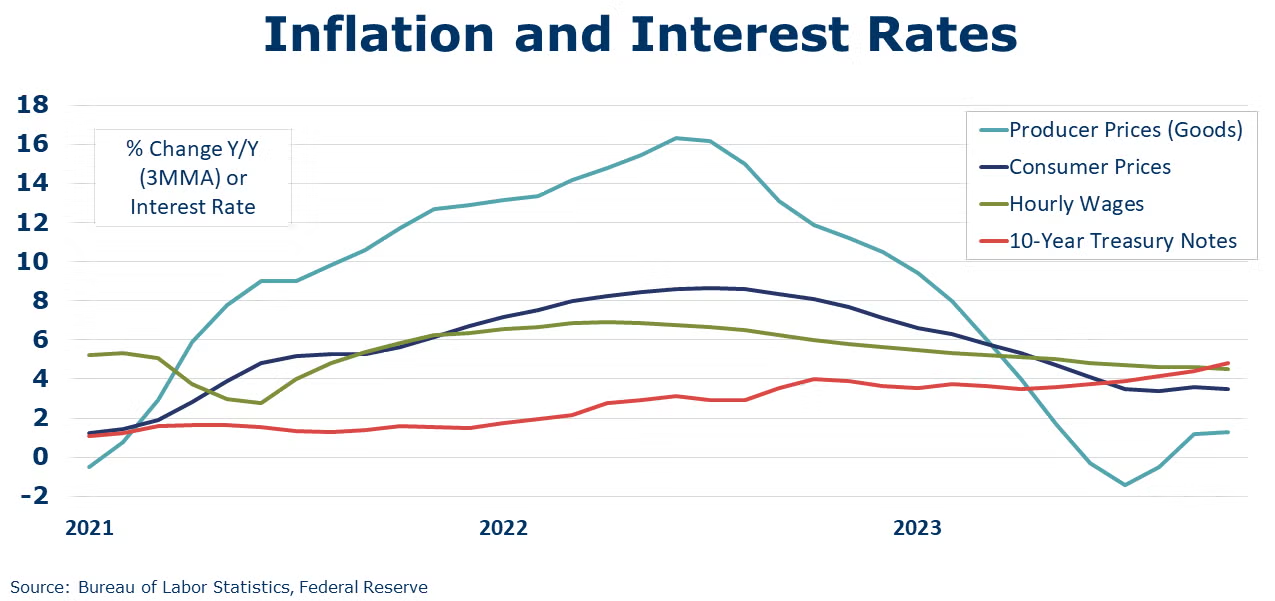
Headline consumer prices were flat in October, led by lower energy prices. Excluding volatile food & energy, core consumer prices were up 0.2%, with higher prices of rent, owner’s equivalent rent, car insurance, medical care, recreation, and personal care. Headline consumer prices were up 3.2% Y/Y while core consumer prices were up 4.0% Y/Y. Both measures were improvements from the previous month. There was also good news in the producer price report. Producer prices declined 0.5% in October due to lower prices for energy, food, and trade margins. Over 80% of the decline in the index for final demand goods was attributable to a 15.3% drop in gasoline prices. Core producer prices for goods edged slightly higher by 0.1%. Headline producer prices were up 1.3% Y/Y while core prices were up 2.9% Y/Y.
The cost of U.S. imports declined 0.8% in October and included a 6.3% drop in imported fuel costs. The 12-month percent change in the import price index has declined for nine months straight, falling 2.0% over the 12 months period ended October 2023. U.S. export prices fell 1.1% in October following 3 months of gains and were down 4.9% Y/Y.
Combined sales for manufacturers, retailers and wholesalers rose by 1.1% in September to a level up 1.6% Y/Y. At the same time business inventories increased 0.4% to a level up 1.3% Y/Y. As a result, the business inventories-to-sales ratio was 1.36 in September, down slightly from 1.37 for the same time last year.
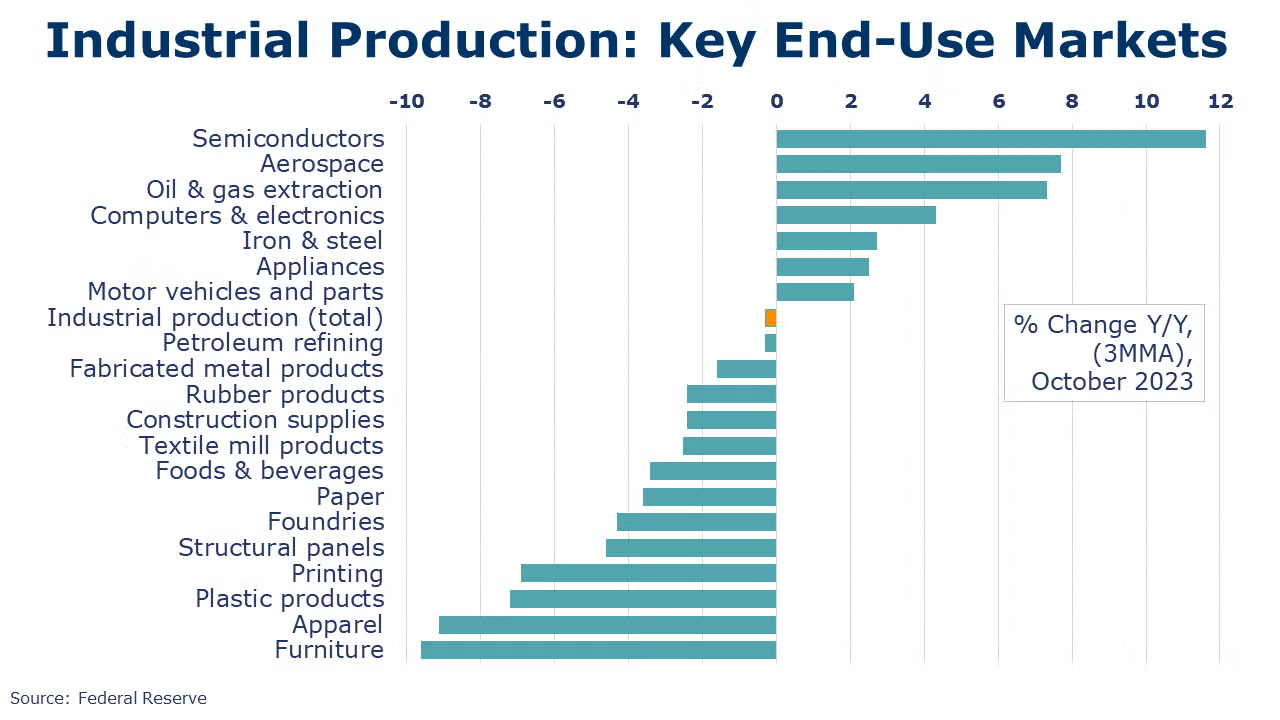
Industrial production moved lower in October, led by a 10.0% decline in motor vehicle & parts production disrupted by the UAW strike that ended on October 30th. Vehicle assemblies fell to their lowest level in two years. There were also declines in the output of primary metals, wood products, furniture, machinery, and plastic & rubber products. Those declines were partially offset by gains in refinery products, aerospace, electrical equipment, computers & electronics, nonmetallic mineral products, and paper. Overall industrial production was off 0.7% Y/Y. Capacity utilization fell 0.6 points during the month to 78.9% and was down from 80.6% a year ago. Overall industrial capacity was 1.5% higher Y/Y.
Homebuilder confidence fell for a fourth straight month in November to its lowest level since the end of 2022. All three components of the NAHB/Wells Fargo Housing Market Index (current sales conditions, sales expectations, and buyer traffic) declined. Housing starts were up 1.9% in October driven by multi-family units. Single-family starts were nearly flat. Compared to the same period last year, multi-family starts are down 31.8% while single-family starts are up 13.1%. Forward-looking building permits rose 1.1% in October, as single-family permits were up 0.5% and multi-family rose 2.2%. Compared to last year, permits for single-family are up 13.9% while multi-family was down 27.8%.
The National Federation of Independent Businesses (NFIB) is celebrating 50 years of the Small Business Economic Trends survey, but small business owners are not feeling optimistic in the current economic environment. The NFIB Small Business Optimism Index fell 0.1 points in October to 90.7, the 22nd consecutive month below the 50-year average. Small business owners remained concerned about future business conditions, inflation, and difficulty finding qualified workers.
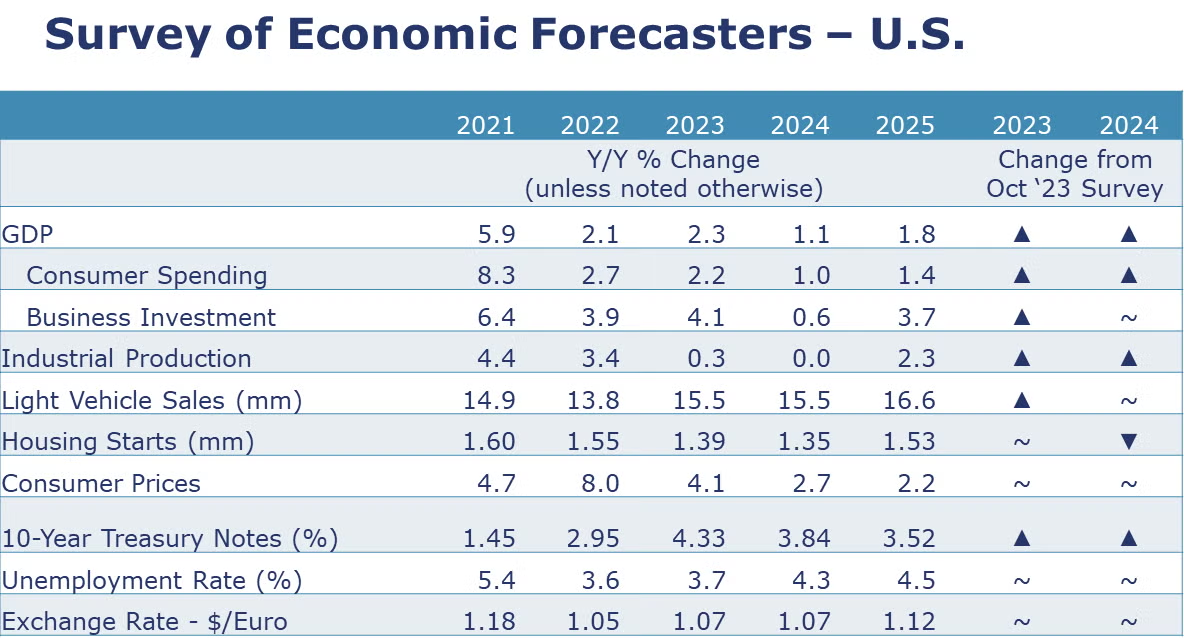
Survey of Economic Forecasters
- Resilient consumer spending has boosted the U.S. economy in 2023 and driven, in part, by recent legislation (i.e., IRA), business investment has held up despite higher interest rates.
- Compared to last month, our expectations for 2023 continue to improve for GDP, consumer spending, business investment and industrial production.
- U.S. GDP is expected to grow by 2.3% in 2023 and by 1.1% in 2024.
- Consumer spending growth is expected to slow to a 2.2% Y/Y pace in 2023 (from 2.7% in 2022) and slow further to a 1.0% gain in 2024.
- Dampened by higher borrowing costs, growth in business investment is also expected to decelerate to a 4.1% pace in 2023 before slowing to a 0.6% gain in 2024.
- We look for industrial production to edge higher by 0.3% this year and flat in 2024.
- U.S. vehicle production continues to be a relatively bright spot in an otherwise lackluster outlook. As a result, sales of autos and light trucks are expected to grow to 15.5 million in both 2023 and 2024 (still below trend).
- Struggling with high prices, labor costs, and mortgage rates, new homebuilding has found some support from historically low inventories of existing homes. Housing starts are expected to come in at 1.39 million in 2023 before easing slightly to a 1.35 million pace in 2024.
- The unemployment rate is expected to move higher from 50-year lows to average 3.7% in 2023 and 4.3% in 2024.
- Recent data suggests that inflation is slowing, though it has a way to go to get back to the Fed’s target and the Fed has announced it’s keeping the door open to future rate increases. Growth in consumer prices is expected to decelerate to a 4.1% pace in 2023 and 2.7% in 2024 (down from 8.0% in 2022).
- Expectations for interest rates (10-year Treasury) were higher for both 2023 and 2024, reflecting the expectation that interest rates will be “higher for longer”.
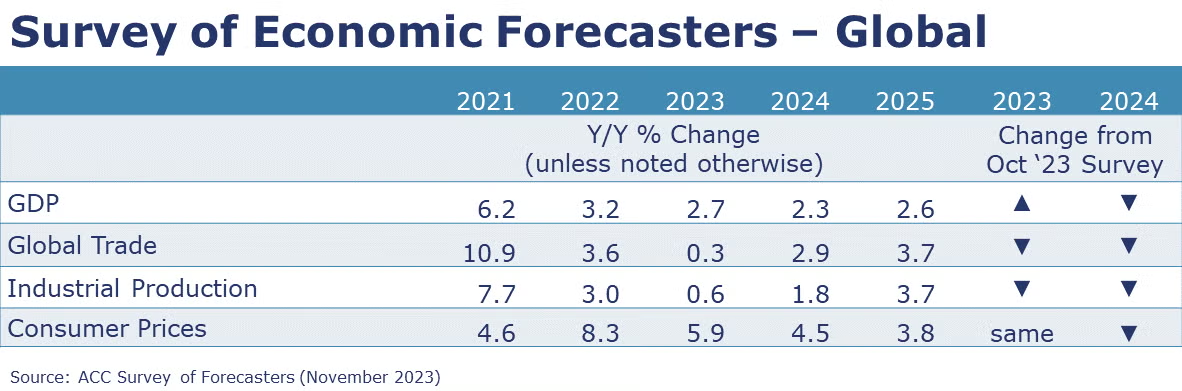
- Resiliency was a surprise theme in many economies this past year. Our Global GDP growth forecast for 2023 was nudged up to 2.7%. Projections are for lower growth, however. The forecast for 2024 was revised downward to 2.3%. Global activity is forecast to expand at a 2.6% pace in 2025 and 2.7% in 2026.
- Global inflation will have increased 5.9% in 2023, a relief from 8.3% in 2022. Inflationary pressures will moderate over the forecast period with a 4.5% pace projected next year (2024) and a 3.3% pace over the 2027-2031 period.
- Weakening demand for goods exports pulled global trade this year. Forecasters estimate just 0.3% global trade growth in 2023. Trade volumes will pick up modestly in 2024 and 2025.
- Growth in the industrial sector is forecast to dip to a 0.6% pace in 2023. Global manufacturing will gain traction next year (2024), growing 1.8% then 3.7% in 2025.
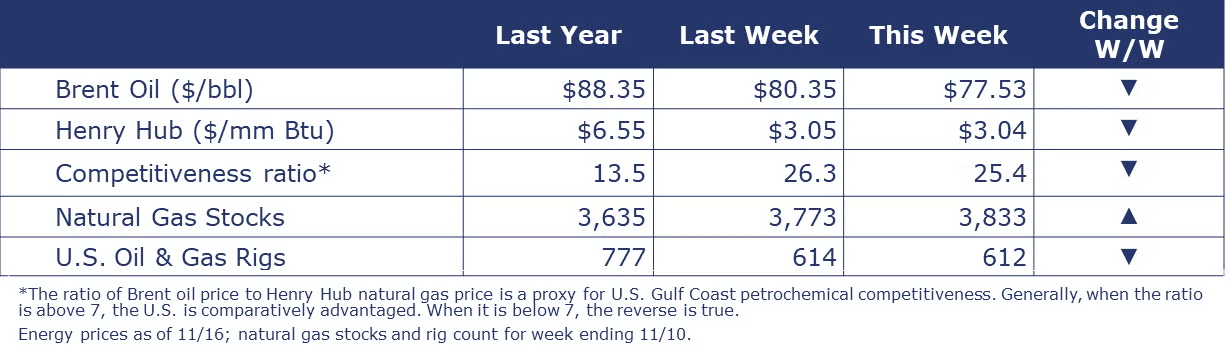
Oil prices continued to fall and are now nearly 20% lower than their recent highs in late-September. Higher U.S. production and concerns about the Chinese economy have outweighed production cuts in recent weeks. In the first week of November, U.S. crude oil production reached a new record of 13.2 million barrels per day.
U.S. natural gas also moved lower over the past week. It’s getting colder, but EIA reports ample storage in the U.S. going into the winter heating season. The combined oil and gas rig count fell by two to 612.
Indicators for the business of chemistry bring to mind a yellow banner.
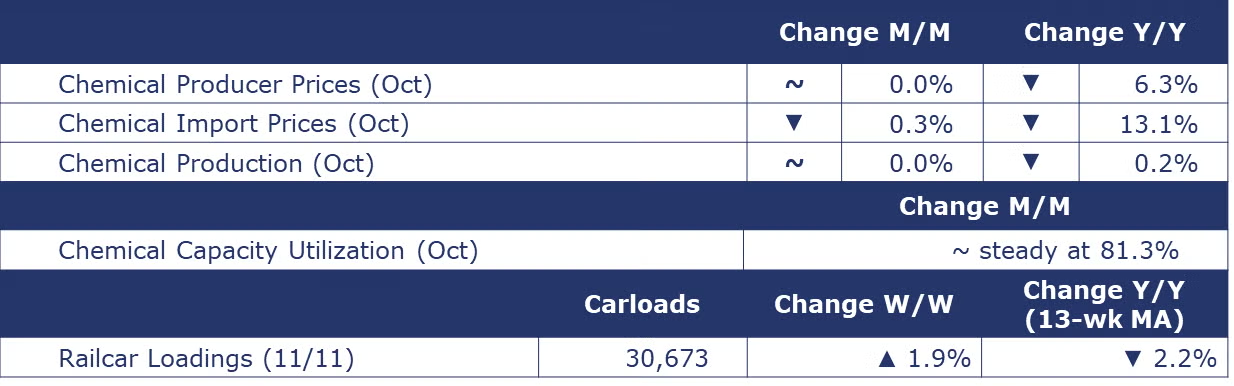
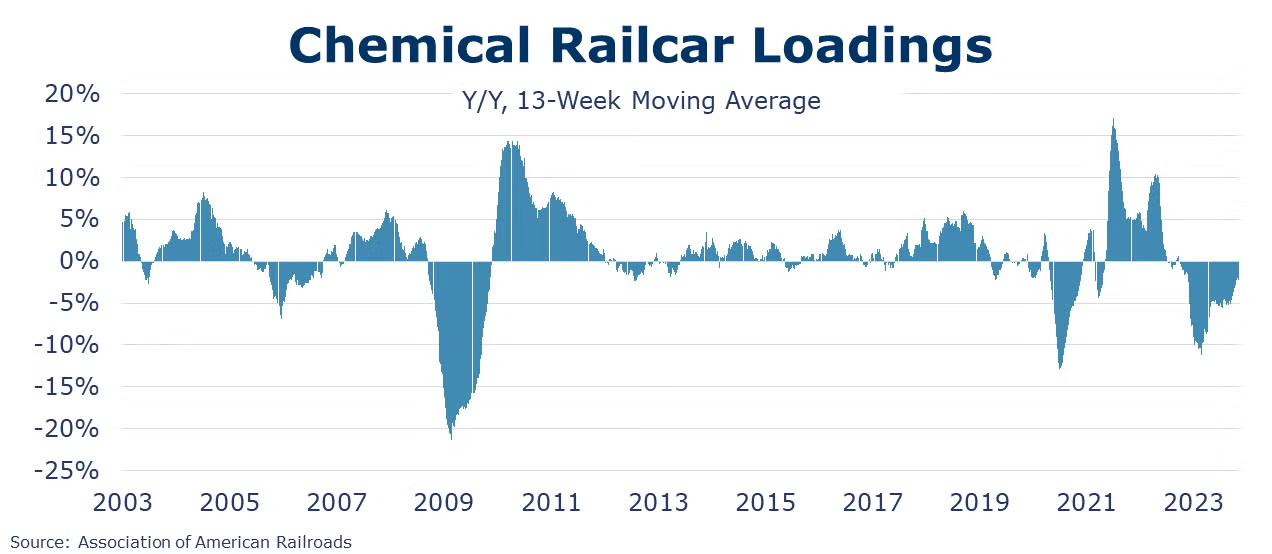
According to data released by the Association of American Railroads, chemical railcar loadings were up 30,673 for the week ending November 11. Loadings were down 2.2% Y/Y (13-week MA), down (2.2%) YTD/YTD and have been on the rise for 7 of the last 13 weeks. Year-over-year comparisons on the 13-week MA have been negative for 60 weeks straight.
Chemical production was flat in October after edging slightly lower in September. Production was higher for inorganic chemicals, consumer products, synthetic rubber, manufactured fibers, coatings, fertilizers, and pesticides. Offsetting those gains were lower production of organic chemicals and plastic resins. Compared to a year ago, chemical output was off 0.2% Y/Y. Chemical capacity utilization was steady at 81.3%.
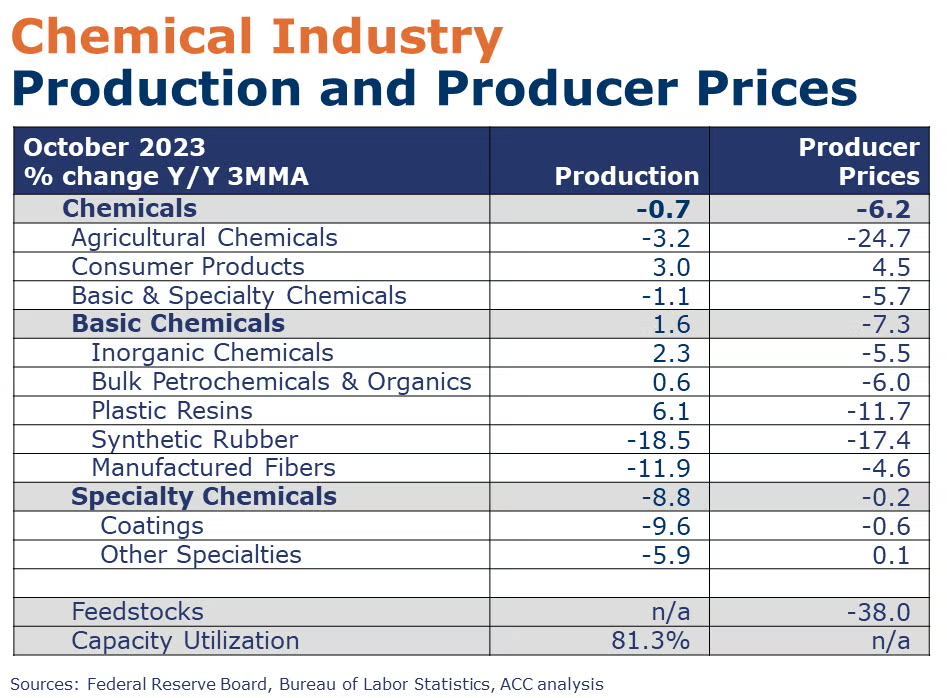
Chemical producer prices were flat in October, for a second month in a row. Higher prices for inorganic chemicals, organic chemicals (including petrochemicals), synthetic rubber, and manufactured fibers were offset by lower prices for agricultural chemicals, coatings, other specialty chemicals, and consumer products. Prices for plastic resins were flat. Chemical producer prices were down 6.3% Y/Y.
Chemical import prices, down 0.3% in October, declined for the ninth straight month. Chemical export prices rose 0.3% following four months of decline. On a Y/Y basis, import prices are down 13.1% and export prices are down 11.7%.
Note On the Color Codes
Banner colors reflect an assessment of the current conditions in the overall economy and the business chemistry of chemistry. For the overall economy we keep a running tab of 20 indicators. The banner color for the macroeconomic section is determined as follows:
Green – 13 or more positives
Yellow – between 8 and 12 positives
Red – 7 or fewer positives
There are fewer indicators available for the chemical industry. Our assessment on banner color largely relies upon how chemical industry production has changed over the most recent three months.
For More Information
ACC members can access additional data, economic analyses, presentations, outlooks, and weekly economic updates through ACCexchange.
In addition to this weekly report, ACC offers numerous other economic data that cover worldwide production, trade, shipments, inventories, price indices, energy, employment, investment, R&D, EH&S, financial performance measures, macroeconomic data, plus much more. To order, visit http://store.americanchemistry.com/.
Every effort has been made in the preparation of this weekly report to provide the best available information and analysis. However, neither the American Chemistry Council, nor any of its employees, agents or other assigns makes any warranty, expressed or implied, or assumes any liability or responsibility for any use, or the results of such use, of any information or data disclosed in this material.
Contact us at ACC_EconomicsDepartment@americanchemistry.com.


