MACROECONOMY & END-USE MARKETS
Running tab of macro indicators: 10 out of 20
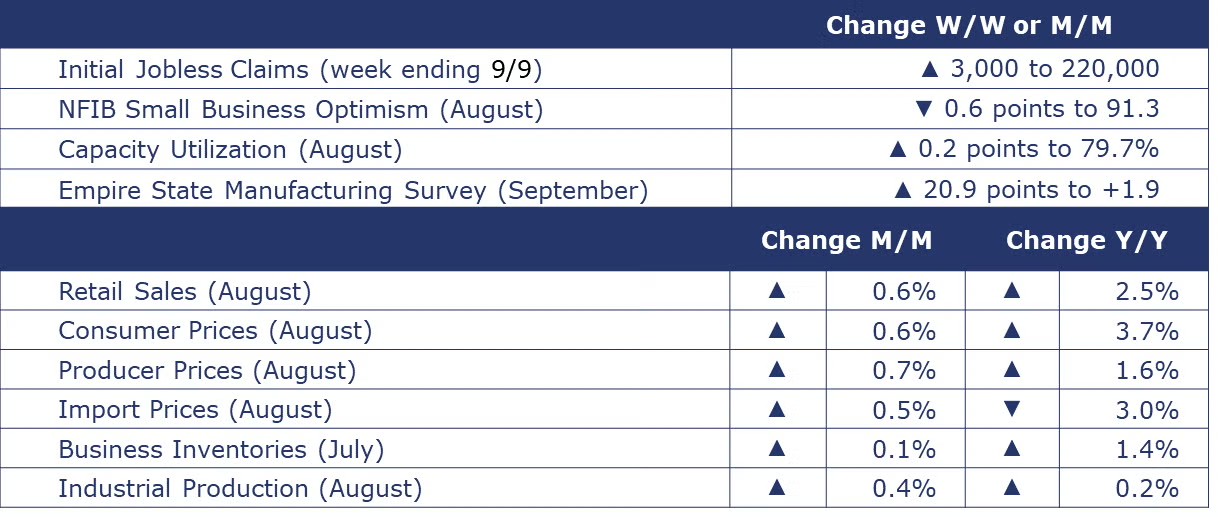
The number of new jobless claims rose by 3,000 to 220,000 during the week ending 9 September. Continuing claims increased by 4,000 to 1.788 million, and the insured unemployment rate for the week ending 2 September was unchanged at 1.1%.
Retail sales (excluding motor vehicles, parts & gas stations) were up slightly (0.2%) in August, at $508.8 billion. Sales at clothing stores, electronics & appliance stores, and food & beverage stores were up M/M, while sales declined in sporting goods, hobby, musical instrument, & bookstores, as well as furniture stores.
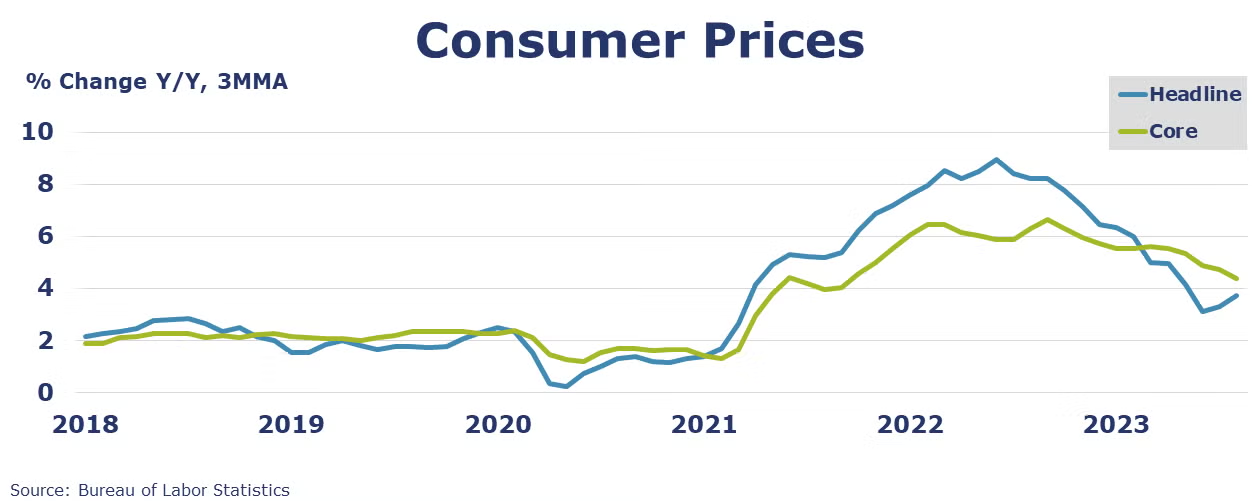
Headline consumer prices rose 0.6% in August and were up 3.7% Y/Y. The rise in the headline consumer price index (CPI) was largely due to an increase in the index for gasoline, while shelter cost also contributed. Core CPI (all items less food and energy) rose 0.3% in August and was up 4.3% Y/Y. Also driven by surging prices for petroleum products, headline producer prices rose 0.7% in August. Excluding the volatile food and energy components, core producer prices edged higher by 0.1%. Headline producer prices were 1.6% higher Y/Y, while core prices were up 3.0% Y/Y.
U.S. import prices were up 0.5% in August following a 0.1% rise in July. The August increase was driven by higher fuel prices (up 6.7%) which offset a 0.1% decline in nonfuel import prices. Despite recent gains, U.S. import prices have fallen 3.0% over the past year. U.S. export prices rose 1.3% in August following a 0.5% gain in July. Higher nonagricultural prices in August more than offset lower agricultural prices. Despite the advance in August, U.S. export prices declined 5.5% over the past year.
Combined business sales were $1,828.4 billion in July, slightly higher (by 0.6%) than the previous month and down 1.2% Y/Y. Business inventories stayed flat from June to July, at $2,538.1 billion, a level up 1.4% Y/Y. The total business inventories-to-sales ratio was up Y/Y to 1.39 in July, compared to 1.35 a year ago. Motor vehicles inventories were 22.3% higher than June 2022.
The NFIB Small Business Optimism Index decreased in August and the index reading – for the 19th consecutive month – was below the historical average. Labor shortages and inflation remain top business concerns on Main Street. Of the small business owners surveyed, 40% reported openings they could not fill, and 23% reported that inflation was their single most important business problem, up from last month.
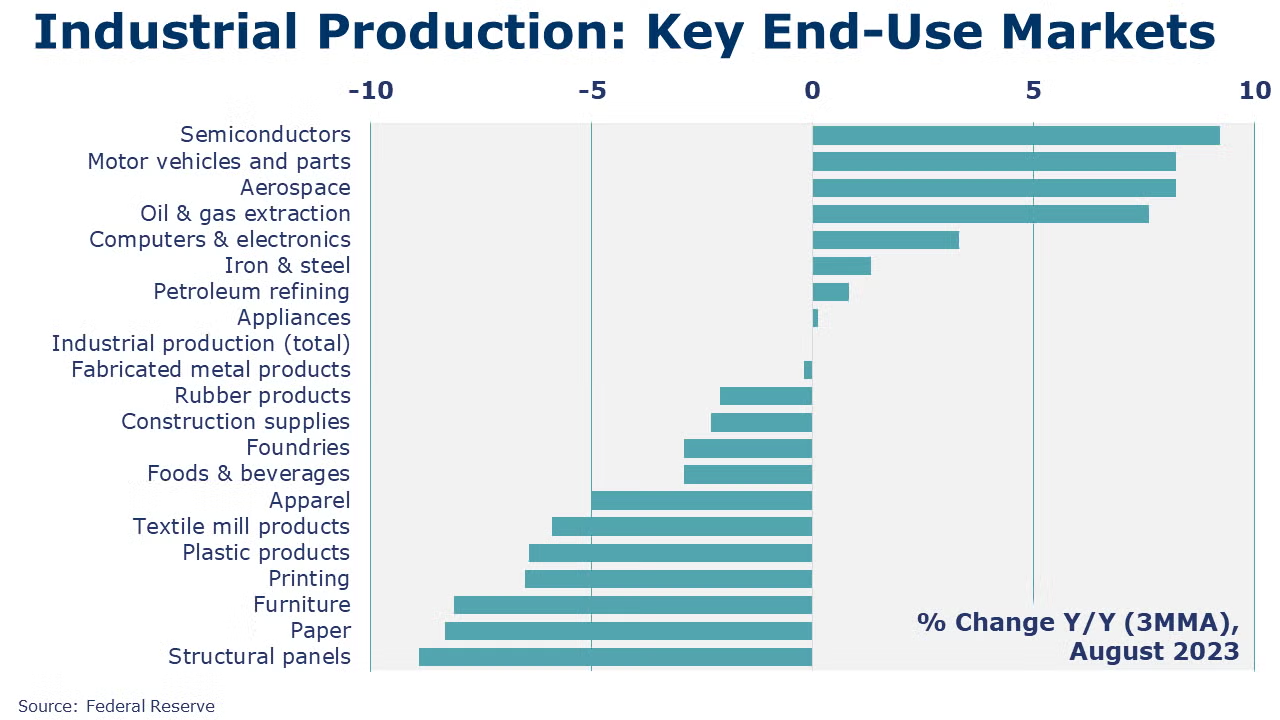
Following a gain in July, industrial production rose by 0.4% in August. Mining and utility output rose strongly, and manufacturing output edged slightly higher (up 0.1%). Within manufacturing, results were mixed. The largest gains were in the output of machinery, aerospace, primary metals, furniture, and printing. The largest declines were in motor vehicles, textiles, and plastics & rubber products. Compared to a year ago, industrial production was up 0.2%. Capacity utilization tightened by 0.2 points to 79.7%. A year ago, capacity utilization was 80.7%.
ENERGY
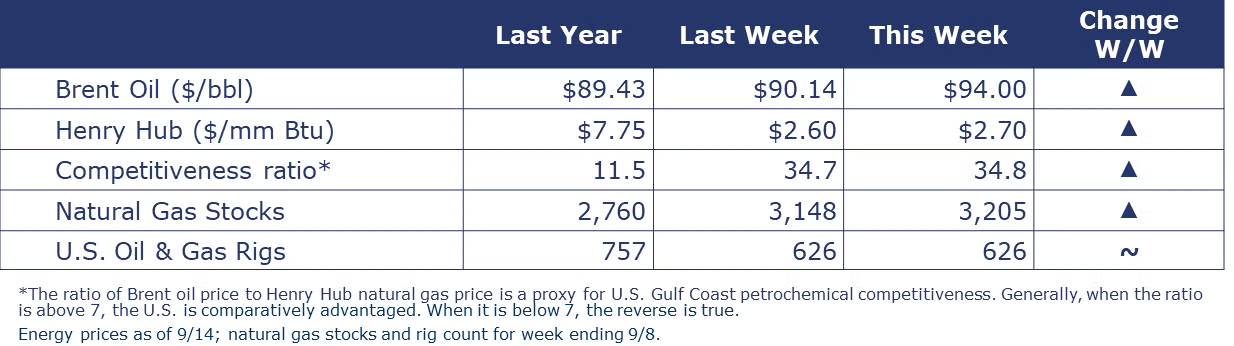
As production cuts kick in, oil prices have continued moving higher and are now higher than a year ago. IEA expects oil demand to exceed supply during the second half of 2023. Extended through the end of the year, production cuts from Saudi Arabia and Russia (about 2 million barrels per day) are likely to keep oil inventories “uncomfortably low” through the start of 2024. U.S. natural gas prices moved a little higher. U.S. gas inventories continue to be above average, though the buffer is shrinking. The combined oil and gas rig count was unchanged at 626 rigs at the end of last week.
CHEMICALS
Indicators for the business of chemistry suggest a red banner.
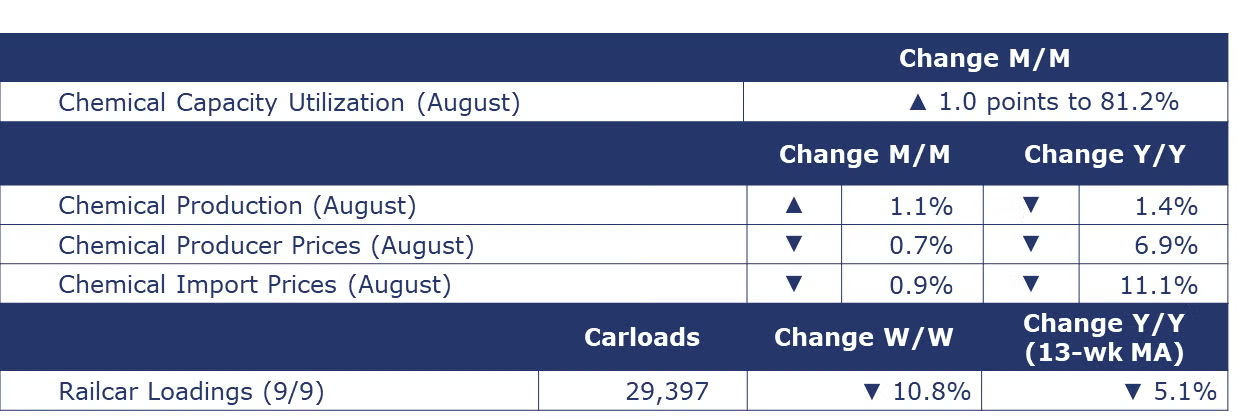
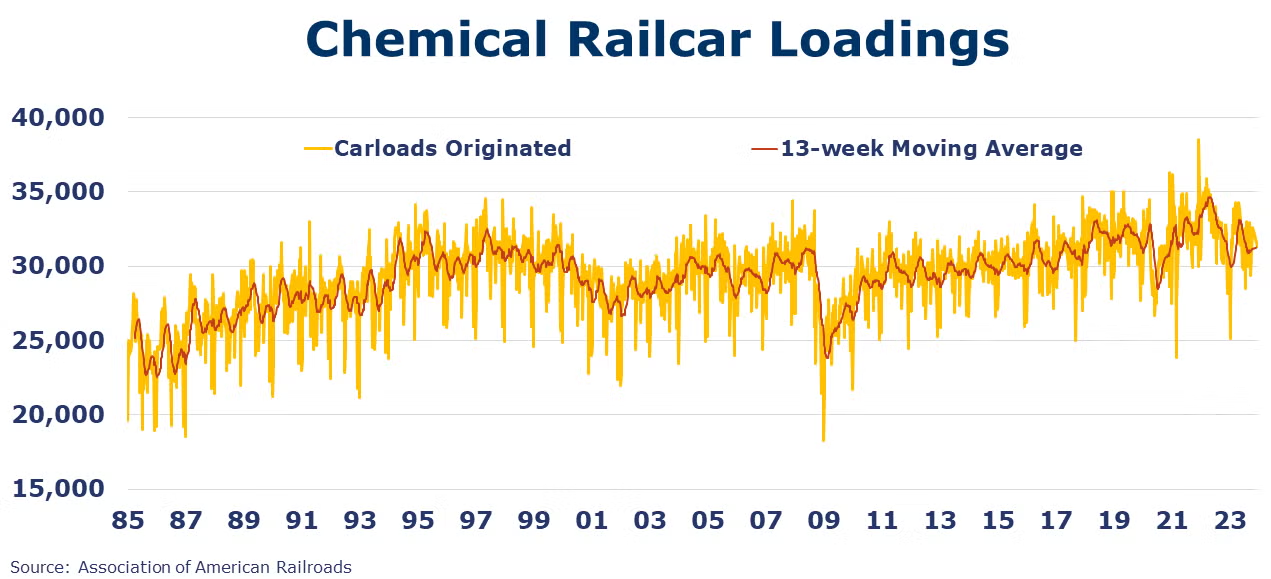
According to data released by the Association of American Railroads, chemical railcar loadings were down 3,545 to 29,297 for the week ending September 9. Loadings were down 5.1% Y/Y (13-week MA), down 3.2% YTD/YTD and have been on the rise for 7 of the last 13 weeks.
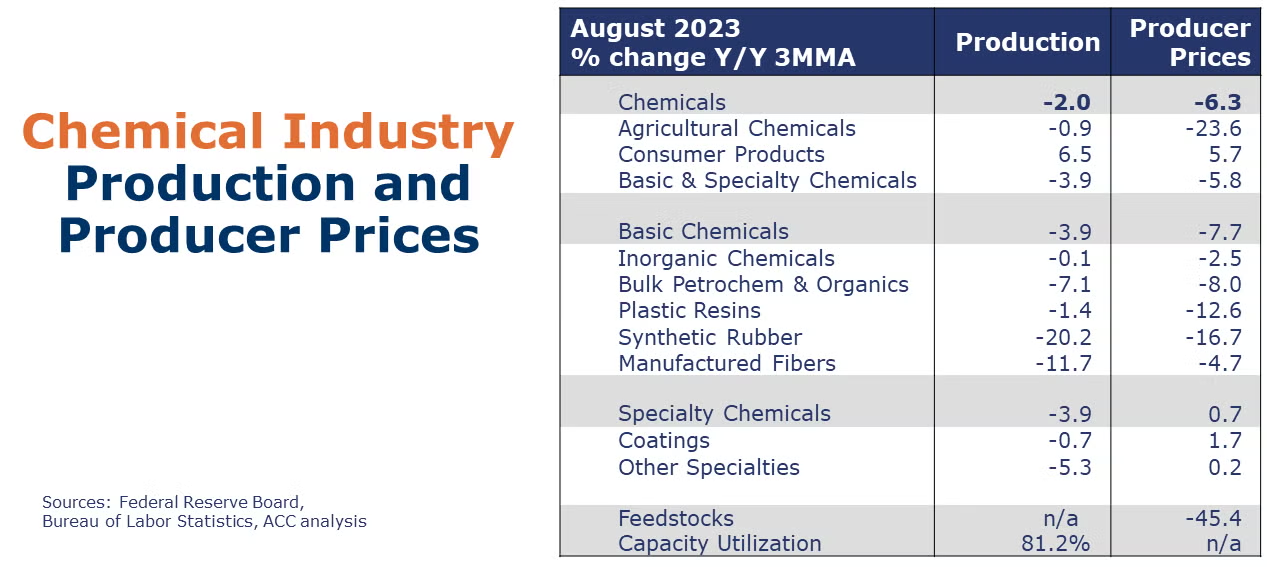
Following a decline in July, chemical production rose 1.1% in August with strong gains in the output of plastic resins, coatings, synthetic rubber, inorganic chemicals, and consumer products. Output of organic chemicals, fertilizers, and crop protection chemicals declined. Chemical production was off by 1.4% Y/Y. Capacity utilization for chemicals rose to 81.2% in August.
Chemical producer prices declined for a fourth consecutive month, down by 0.7% in August. Prices were lower for bulk petrochemicals and organic chemicals, plastic resins, manufactured fibers, and agricultural chemicals. Prices for synthetic rubber and specialty chemicals (excluding coatings) were higher. Prices for coatings, inorganic chemicals, and consumer products were flat. Chemical prices were down 6.9% Y/Y.
Chemicals import prices fell 0.9% in August, the seventh consecutive month of declines. Chemicals export prices rose 0.8% in August following a 2.2% decrease the previous month. On a Y/Y basis, import prices are down 11.1% and export prices are down 9.3%.
Note On the Color Codes
The banner colors represent observations about the current conditions in the overall economy and the business chemistry. For the overall economy we keep a running tab of 20 indicators. The banner color for the macroeconomic section is determined as follows:
Green – 13 or more positives
Yellow – between 8 and 12 positives
Red – 7 or fewer positives
For the chemical industry there are fewer indicators available. As a result, we rely upon judgment whether production in the industry (defined as chemicals excluding pharmaceuticals) has increased or decreased three consecutive months.
For More Information
ACC members can access additional data, economic analyses, presentations, outlooks, and weekly economic updates through ACCexchange.
In addition to this weekly report, ACC offers numerous other economic data that cover worldwide production, trade, shipments, inventories, price indices, energy, employment, investment, R&D, EH&S, financial performance measures, macroeconomic data, plus much more. To order, visit http://store.americanchemistry.com/.
Every effort has been made in the preparation of this weekly report to provide the best available information and analysis. However, neither the American Chemistry Council, nor any of its employees, agents or other assigns makes any warranty, expressed or implied, or assumes any liability or responsibility for any use, or the results of such use, of any information or data disclosed in this material.
Contact us at ACC_EconomicsDepartment@americanchemistry.com.