MACROECONOMY & END-USE MARKETS
Running tab of macro indicators: 10 out of 20 (This would normally suggest a yellow banner but the effects of the winter storm are at play and likely transitory)
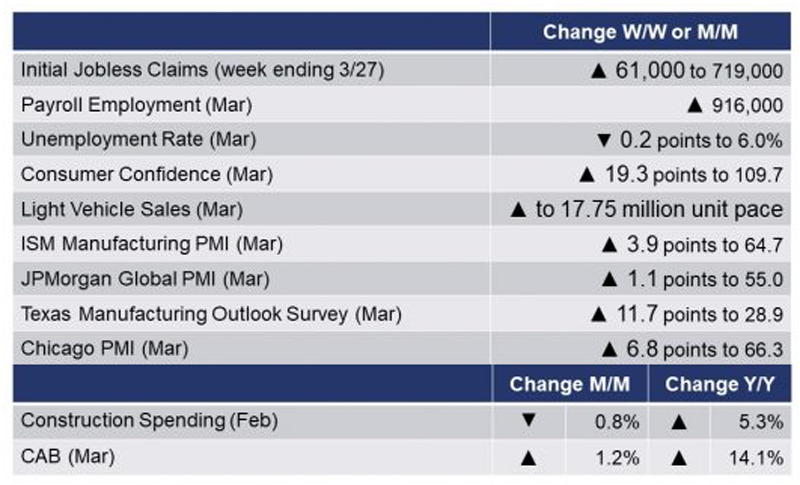
The number of new jobless claims rose by 61,000 to 719,000 during the week ending 27 March. Continuing claims fell by 46,000 to 3.79 million and the unemployment rate for the week ending 20 March remained at 2.7%.
Total non-farm payroll employment rose by a larger than expected 916,000 in March and follows a revised 468,000 gain in February. That said, payrolls are down by 8.4 million, or 5.5%, from the pre-pandemic peak in February 2020. The March gain was led by gains in leisure and hospitality, education, construction, and manufacturing. Average weekly hours expanded and average hourly wages of $25.21 were up 4.4% Y/Y. The household survey indicated that labor force participation improved, and the unemployment rate eased 0.2 percentage points to 6.0%, a level still 2.5 percentage points higher than its pre-pandemic level. The number of long-term unemployed (those jobless for 27 weeks or more), at 4.2 million, changed little over the month but is up by 3.1 million since February 2020.
The Conference Board Consumer Confidence Index® rose 19.3 points to 109.7 (1985=100) in March, its highest reading in a year. Consumers’ assessments of both current conditions and future conditions improved, the former at a slightly higher gain. This indicates that economic growth is likely to strengthen further in the coming month as consumers’ renewed optimism boosted their purchasing intentions for homes, autos, and several big-ticket items. Inflation concerns in the short-term, however, rose.
Construction spending eased by 0.8% in February. Spending declined across all three major sectors, including the first decline in spending on residential projects in eight months. Compared to a year ago, spending was up 5.3%.
Light vehicle sales rose to a 17.75 million unit annual pace in March with gains across both domestic and foreign builds and among automobiles, light-duty trucks, SUVs and other vehicle types. Inventories of new vehicles for sale at the dealership level are off 36% Y/Y. This is particularly the case on popular trucks and sport-utility vehicles. A shortage of semiconductor chips is a primary culprit, having disrupted production at many U.S. factories, hitting car company earnings and leaving dealerships with lower inventory. Sales are expected to grow in the coming months, driven by rising jobs and incomes. The latter will be bolstered by new stimulus monies.
The Dallas Fed reported that Texas factory activity expanded at a markedly faster pace in March, with the headline current assessment of manufacturing conditions in the Texas Manufacturing Outlook Survey rising 11.7 points to +28.9. The production index, a key measure of state manufacturing conditions, surged 28.1 points to 48.0, its highest reading in the survey’s 17-year history. Other measures of manufacturing activity—such as new orders, capacity utilization, and shipments—also pointed to sharply faster growth this month. The Chicago PMI rose 6.8 points to 66.3 in March, the highest level since July 2018. Among the main five indicators, production saw the largest gain, while order backlogs fell. New orders gained and inventories increased, mainly driven by supply chain issues. Employment shifted into expansion territory in March, the first positive reading since June 2019. Supplier deliveries lengthened to a 47-year high in March and prices paid at the factory gate escalated.
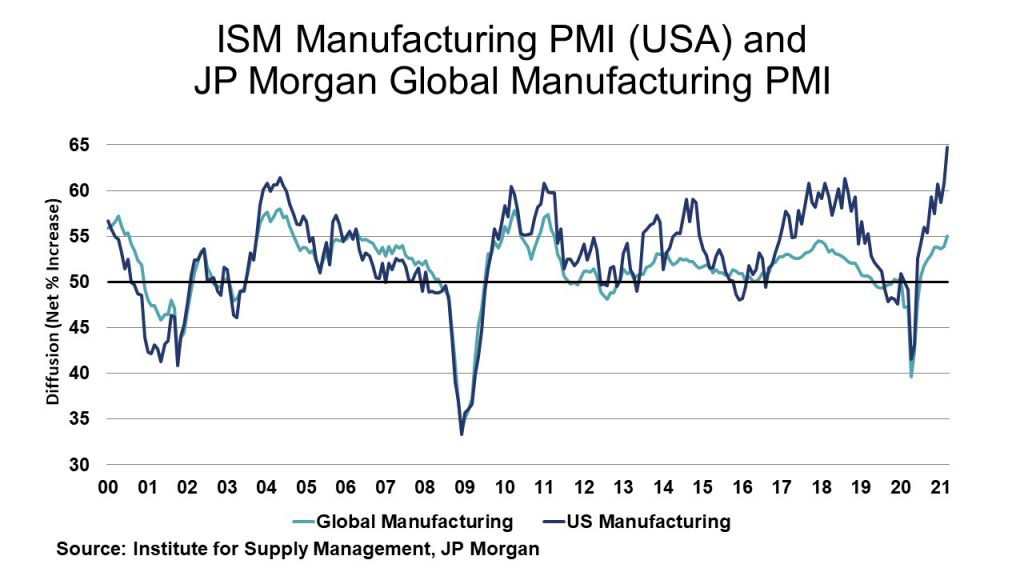
The ISM Manufacturing PMI gained 3.9 points to 64.7% in March. New orders, order backlogs, production and employment are growing, as are inventories, and customer inventories are deemed too low. Supplier deliveries are slowing at a faster pace. Prices are increasing and exports and imports are growing. A very good report with widespread strength as 17 of 18 industries expanded. Despite rising cost pressures and supply chain disruptions, the JPMorgan Global PMI rose 1.1 points to 55.0 in March, its highest reading since February 2011. This level of the PMI was supported by stronger growth of output, new orders, and employment. A slower decrease in stocks of purchases and lengthening of vendor lead times also had a positive impact. The Euro Area, U.S. and Taiwan led global growth rankings and there was solid growth across consumer, intermediate and investment goods sectors.
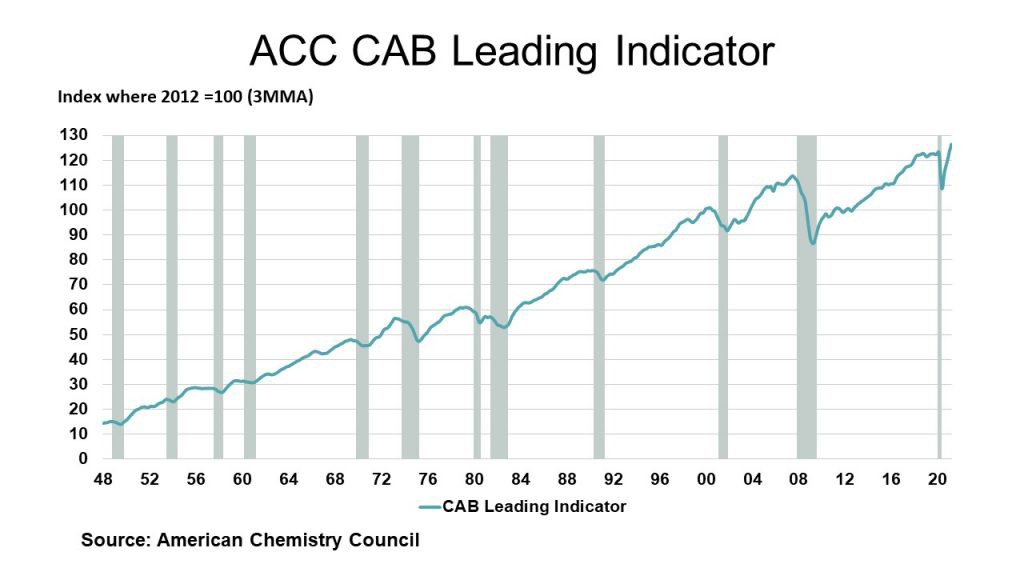
Our CAB leading indicator of the business cycle rose 1.2% in March following a 0.9% gain in February. The diffusion index rebounded to 82% in March, well above the long-term average of 58%. The CAB reading for February was revised upward by 0.18 points and the reading for January was revised downward by 0.57 points. The March data are provisional and subject to revision. The CAB has four main components, each consisting of a variety of indicators: 1) production; 2) equity prices; 3) product prices; and 4) inventories and other indicators. In March, production-related indicators were positive. Trends in construction-related resins and related performance chemistry were solid and suggest further expansion past the weak February home sales and housing starts. Resins and chemistry used in other durable goods were strong. Plastic resins used in packaging and for consumer and institutional applications were positive. Performance chemistry for industry was mixed. U.S. exports were positive, while equity prices showed further gains. Product and input prices were positive, as were inventory and other supply chain indicators. The latest CAB reading is consistent with solid expansion of commerce, trade and industry into the fourth quarter.
ENERGY
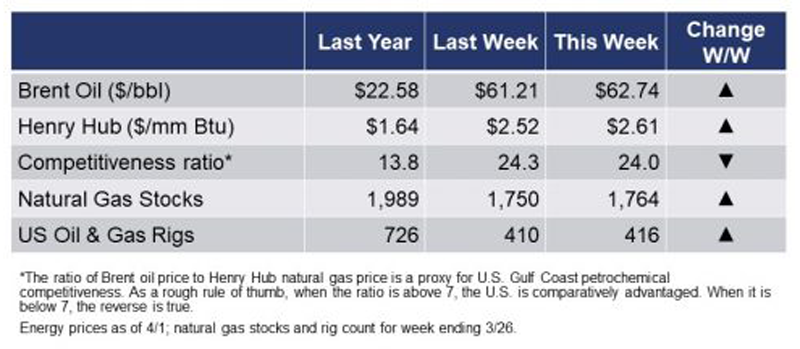
The rig count rose by 12 to 428 rigs during the week ending 1 April. With warmer weather across much of the U.S. last week, natural gas inventories rose by 14 BCF, the first build of the year. Oil prices moved higher during the week on renewed optimism for a recovery in oil demand.
CHEMICALS
For the business of chemistry, excluding the temporary impact of the winter storms, the indicators still suggest a green banner for basic and specialty chemicals.
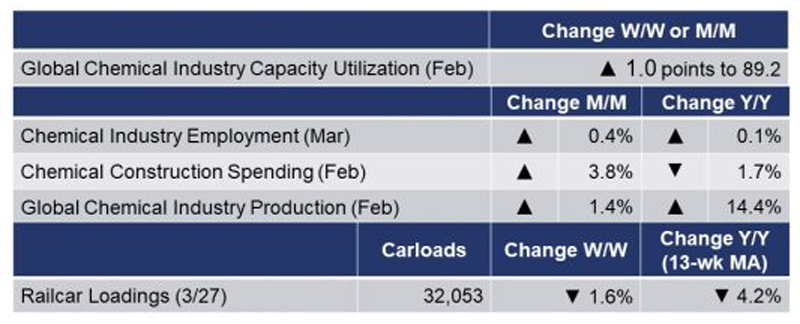
According to data released by the Association of American Railroads, chemical railcar loadings, the best ‘real time’ indicator of chemical industry activity, rose by 513 to 32,053 railcars the week ending 27 March (week 12). Loadings were down 2.0% Y/Y, down 4.7% YTD/YTD and the 13-week moving average, which is used to smooth out volatility, fell 4.2%.
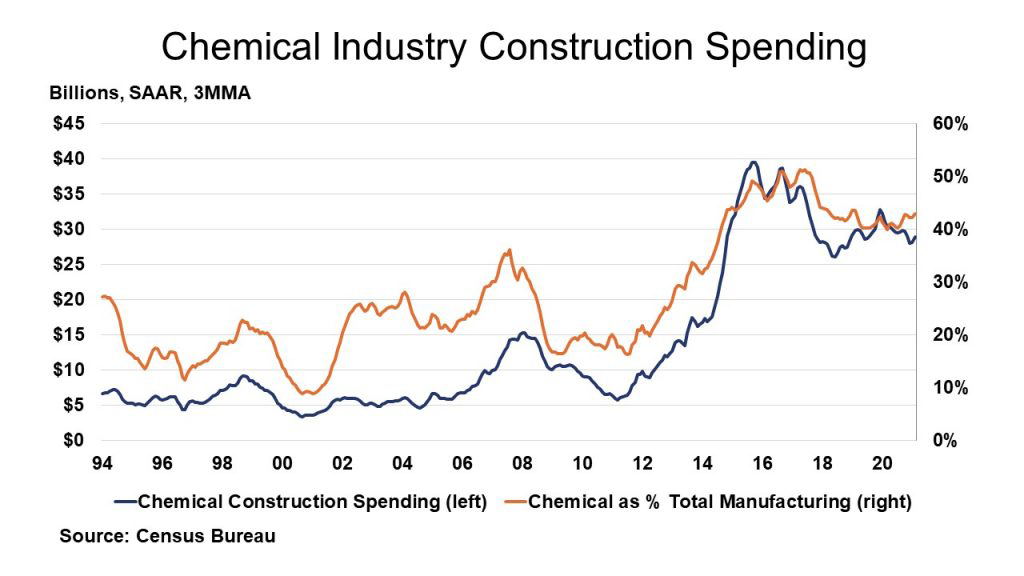
Chemical industry construction spending rose by 3.8% in February to $30.6 billion, following a revised decline in January. Chemical industry construction spending was off by 1.7% Y/Y. As a share of overall spending on manufacturing construction, chemicals represented 44%.
The benchmark S&P 500 index rose by 4.2% in March. Chemical equity prices, as measured by the S&P index for chemical companies, also ended sharply higher, up 7.8% for the month. Equity prices are often a good indicator of future activity and represent one component of the leading economic indicators. Compared to the beginning of the year, chemical equities were ahead by 7.5% while the S&P 500 index was up 5.8% year-to-date.
The ISM PMI report for manufacturing indicated that the chemical industry reported strong growth in March. New orders, order backlogs, production and employment are growing. Inventories contracted and customer inventories are deemed too low. Supplier deliveries slowed. Exports and imports are growing. One respondent noted that “Demand remains strong. Significant supply impacts on raw materials due to the Texas freeze. All major raw-material and suppliers on force majeure.”
Chemical industry (including pharma) employment continued to rebound, up by 3,100 (0.4%) in March, following a 1,400 gain in February. The industry is still off by 1,700 jobs compared to pre-COVID levels. Compared to last year, employment was slightly ahead, by 120 (0.1%). In February, production worker jobs were up by 0.9, but there was a 0.5% decline in supervisory and non-production workers. Average wages were up 2.4% Y/Y to $26.50. The average workweek declined by 0.3 hours. The gain in the number of production workers offset the decline in the workweek suggesting chemical production was little changed in March, which differs from the assessment presented in the ISM survey. The recovery from the winter storms and timing differences likely account for some of the discrepancy, however.
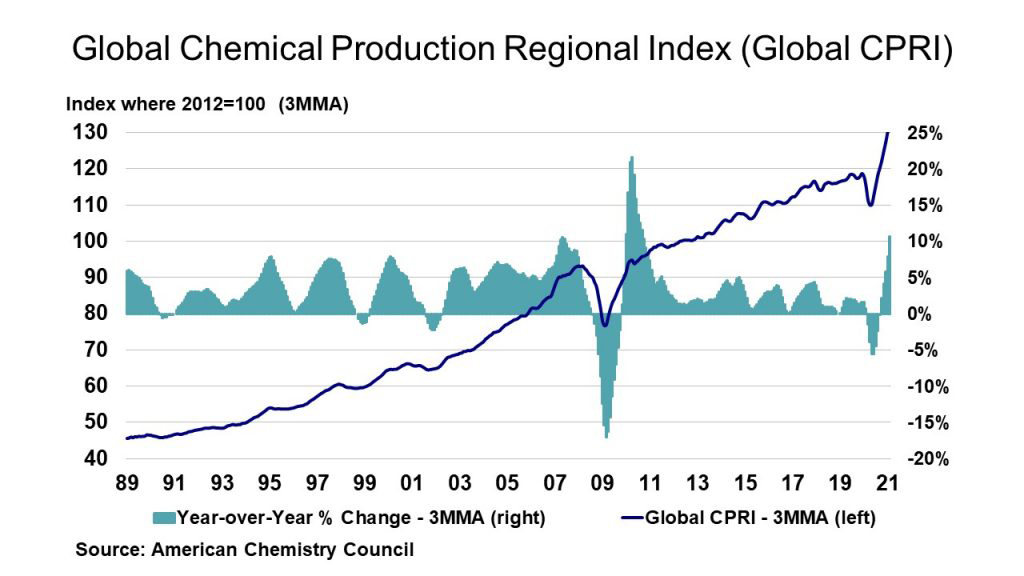
With improving activity across most nations, the ACC’s Global Chemical Production Regional Index (Global CPRI) shows that global chemicals production rose 1.4% in February, a slightly slower pace than January, but continuing the global recovery that started in June following declining activity during the January-May 2020 period. During February, chemical production increased in the Commonwealth of Independent States (CIS) and in the Asia-Pacific region. Output was weak elsewhere. Headline global production was up 14.4% Y/Y on a 3MMA basis. Keep in mind that output a year ago was off due to COVID. Global output stood at 132.0% of its average 2012 levels.
During February, global capacity rose 0.2% and was up 1.9% Y/Y. As a result, with improving production, capacity utilization in the global chemical industry rose 1.0 points to 89.2%. This is well above last February and above the long-term (1987-2019) average of 86.3%. Among chemical industry segments, February results were positive with gains across all segments except for synthetic rubber. Considering year-earlier comparisons, production gains occurred in all segments.
Note On the Color Codes
The banner colors represent observations about the current conditions in the overall economy and the business chemistry. For the overall economy we keep a running tab of 20 indicators. The banner color for the macroeconomic section is determined as follows:
Green – 13 or more positives
Yellow – between 8 and 12 positives
Red – 7 or fewer positives
For the chemical industry there are fewer indicators available. As a result we rely upon judgment whether production in the industry (defined as chemicals excluding pharmaceuticals) has increased or decreased three consecutive months.
For More Information
ACC members can access additional data, economic analyses, presentations, outlooks, and weekly economic updates through MemberExchange.
In addition to this weekly report, ACC offers numerous other economic data that cover worldwide production, trade, shipments, inventories, price indices, energy, employment, investment, R&D, EH&S, financial performance measures, macroeconomic data, plus much more. To order, visit http://store.americanchemistry.com/.
Every effort has been made in the preparation of this weekly report to provide the best available information and analysis. However, neither the American Chemistry Council, nor any of its employees, agents or other assigns makes any warranty, expressed or implied, or assumes any liability or responsibility for any use, or the results of such use, of any information or data disclosed in this material.
Contact us at ACC_EconomicsDepartment@americanchemistry.com
Upcoming Events of Interest
‘The Supply Chain and Logistics Crisis: Challenge, Impact, Solutions’ Webinar
Mike Andaloro – President and COO, BDP International and Glenn Riggs – SVP, Corporate Strategy & Business Development, Odyssey Logistics
7 April (1:00 – 2:00 pm)
Société de Chimie Industrielle
www.societe.org