Running tab of macro indicators: 11 out of 20
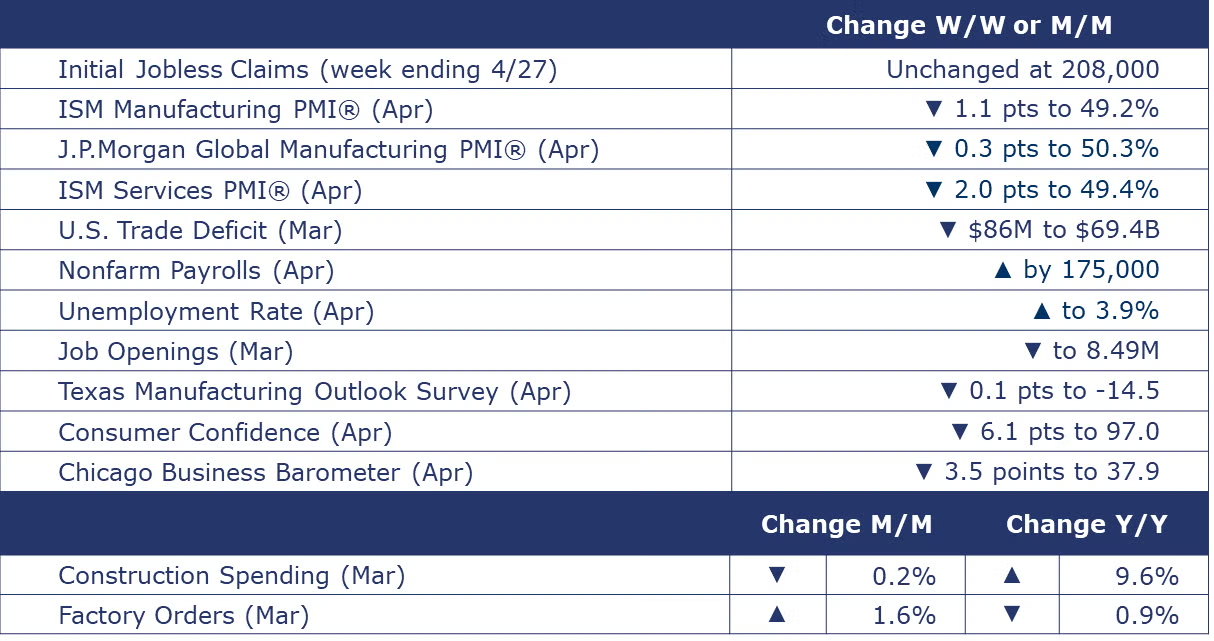
Employers added 175,000 to nonfarm payrolls in April, a print that was below expectations. It was the smallest gain since last October. Manufacturing employment grew by 8,000 and much of the gain was in nondurable goods employment. Average hourly earnings rose 3.9% Y/Y, the slowest pace since June 2021. This is welcome news for services inflation that tends to be more labor-intensive than the goods-producing segments of the economy. The unemployment rate ticked higher to 3.9% as a small gain in the labor force was only partially offset by an even smaller gain in the number of employed people, according to the household survey.
The number of new jobless claims was unchanged at 208,000 during the week ending April 27th. Continuing claims was also unchanged at 1.774 million, and the insured unemployment rate for the week ending April 20th was steady at 1.2%.
The number of job openings eased slightly to 8.5 million, with declines in openings in construction and finance & insurance. Hires were also down slightly, as was the number of job holders that quit voluntarily. The number of quits has declined over the past year, a potential sign that job holders may be less confident about moving on. The number of quits was at its lowest level since early-2021.
The Conference Board’s Consumer Confidence Index® deteriorated for the third consecutive month in April, declining to 97.0 from a downwardly revised 103.1 in March. The index fell to its lowest level since July 2022 reflecting less optimism about the current labor market situation, and growing concerns about future business conditions, job availability, and income.
Light vehicle sales edged higher last month, up from 15.6 million in March to 15.7 million in April. Sales were higher for both passenger cars and light-duty trucks.
The U.S. trade deficit in goods and services narrowed by $86 million in March to $69.4 billion. Both exports and imports of goods and services fell sharply. Exports were down by $5.3 billion, and imports were lower by $5.4 billion. Exports of capital goods (including civilian aircraft), industrial supplies & materials (including petroleum products), and foods, feeds & beverages (including soybeans) were lower. Declines in automotive imports and imports of industrial supplies & materials were offset by a gain in consumer goods imports, including pharmaceuticals and cell phones and other household goods.
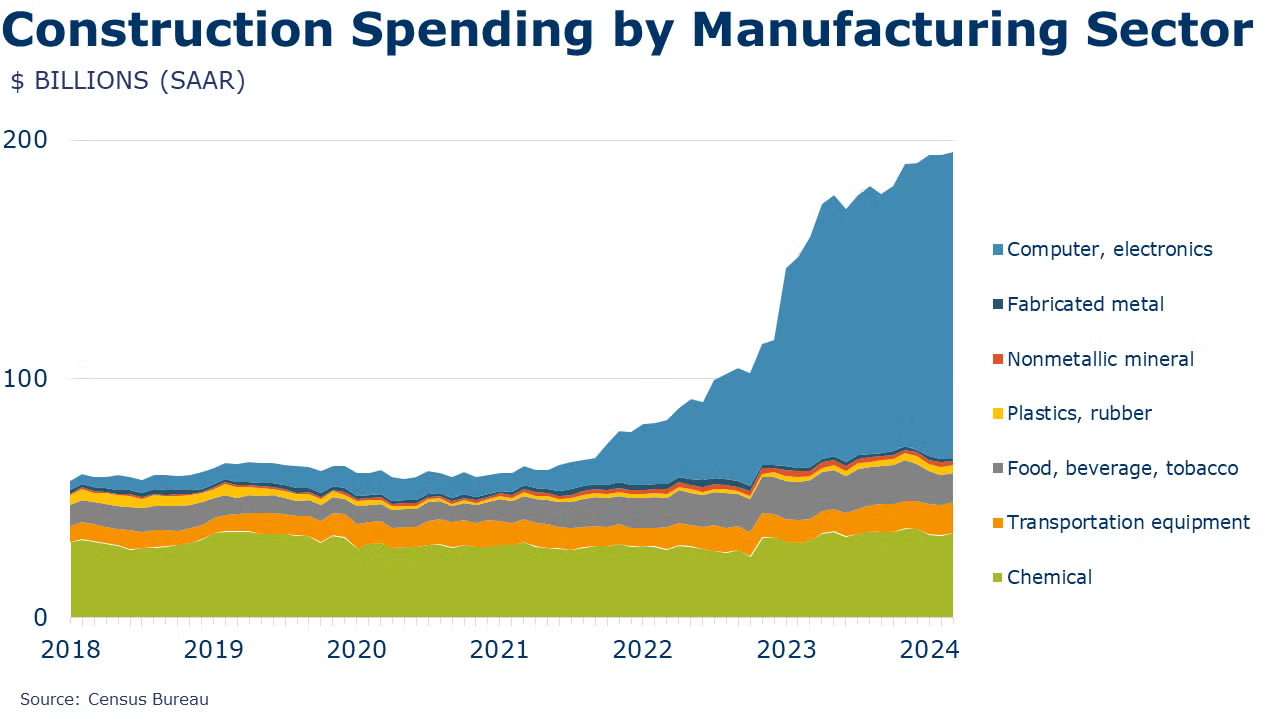
Following essentially flat growth in February, construction spending fell 0.2% in March. Spending on privately funded residential and non-residential projects was only partially offset by a gain in publicly funded projects. Spending on new manufacturing projects essentially stalled for a second consecutive month. Compared to a year ago, spending on manufacturing projects has increased nearly 26% Y/Y, with new manufacturing projects motivated by recent legislation (e.g., IRA, BIL, and CHIPS). Overall construction spending was up 9.6% Y/Y.
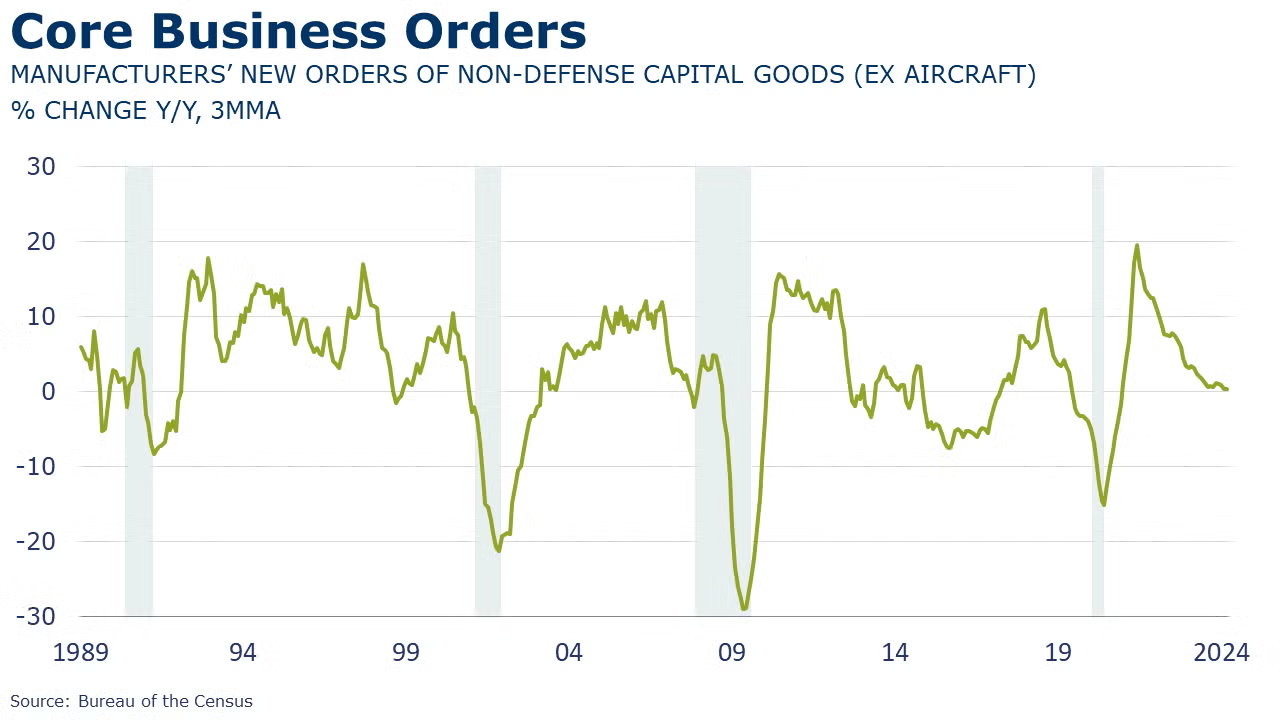
Factory orders rose by 1.6% in March, led by a surge in aircraft orders. Orders were also higher for motor vehicles, information technology products, and consumer goods. Core business orders (nondefense capital goods excluding aircraft) edged higher by 0.1%. Unfilled orders (a measure of the manufacturing pipeline) rose 0.4%. Manufacturing shipments rose 0.3% with gains in nondurable goods offsetting a small decline in durable manufacturing. Inventories were flat.
The ISM Manufacturing PMI® retreated back below the neutral mark of 50 in April. The headline PMI fell 1.1 points to 49.2%, suggesting that U.S. manufacturing contracted. In March, the PMI came in above the 50 threshold for the first time in 17 months. In April, growth in production decelerated and new orders and new export orders contracted. Inventories continued to contract, and employment fell at a slower pace. Prices, however, accelerated sharply. Supplier deliveries were slightly faster in April. Nine manufacturing industries reported growth (including chemicals and plastic & rubber products) while seven reported contraction.
Looking abroad, the JPMorgan Global Manufacturing PMI® eased to 50.3% in April, signaling expansion (albeit slightly slower) for a third consecutive month. New orders and output continued to grow at a slower pace and new export orders expanded (following contraction in March). The gains were in consumer and intermediate goods while the investment goods category continued to deteriorate. Manufacturing output expanded in half of the 32 nations for which April data were available.
ISM’s Services PMI® dropped 2.0 points to 49.4 in April, indicating contraction in the services sector for the first time in 15 months. Business activity/ production continued to grow (at a slower pace). New orders expanded overall but export orders shifted to contraction. Services employment contracted and at a faster pace in April.
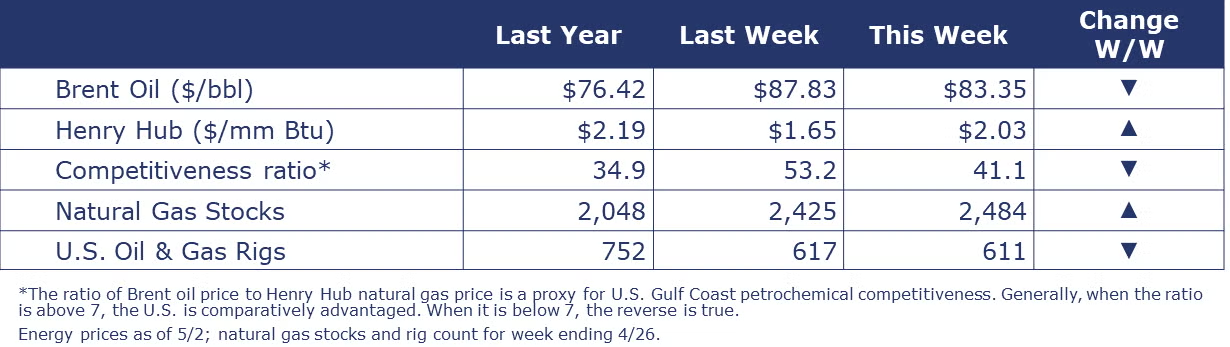
Oil prices were lower this week on weaker manufacturing data and the new reality that the Fed will likely delay rate cuts until the end of the year. U.S. natural gas rose above $2/mmbtu for the first time since the beginning of February. Natural gas inventories rose again last week and are now nearly 35% above the five-year historic average. The combined oil and gas rig count fell by six to 611 during the week ending 4/26.
Indicators for the business of chemistry bring to mind a yellow banner.
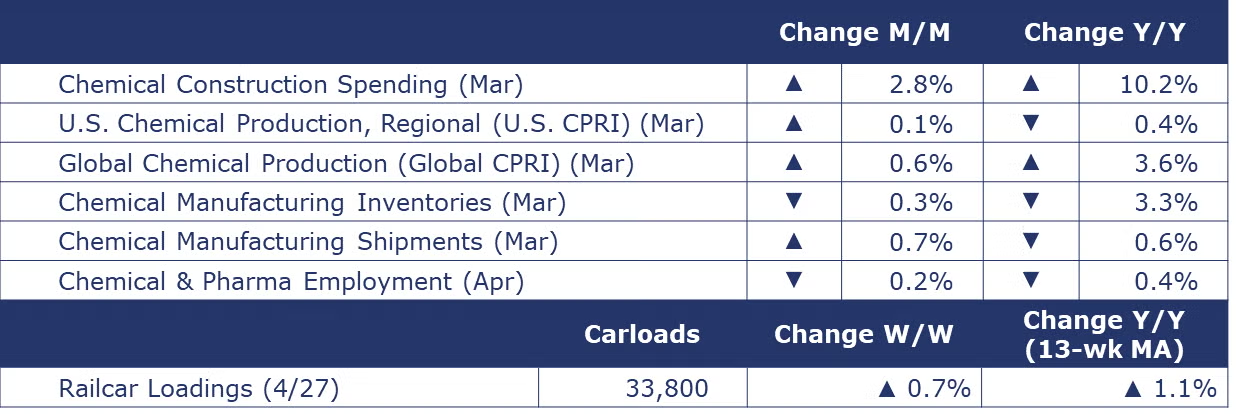
According to data released by the Association of American Railroads, chemical railcar loadings were up to 33,800 for the week ending April 27th. Loadings were up 1.1% Y/Y (13-week MA), up (4.1%) YTD/YTD and have been on the rise for eight of the last 13 weeks.
According to the details of the ISM Manufacturing PMI® report, the chemical industry continued to expand in April. New orders, production, and imports expanded, but new export orders were lower. Inventories contracted and employment levels and order backlogs were reported to be lower. Customers’ inventories continued to be assessed as “too low”. Chemical producers also reported faster deliveries. A chemical products respondent comment, “Conditions are improving as demand is starting to recover. Costs continue to be a major concern as suppliers that rapidly increased prices in the follow-up from COVID-19 are slow to return to pre-pandemic levels.”
Chemical shipments rose by 0.7% in March, following a 0.6% gain in February. Lower shipments of coatings & adhesives were more than offset by higher shipments in agricultural chemicals and other chemical products. Chemical inventories continued to move lower, down another 0.3%. Chemical inventories continued to decline for coatings & adhesives and other chemical products. Agricultural chemical inventories were flat. Compared to a year ago, chemical shipments were off 0.6% while inventories were off 3.3%. The inventories-to-shipments ratio edged lower to 1.21 in March from 1.22 in February. A year ago, the inventories-to-sales ratio was 1.24.
Chemical and pharmaceutical employment eased in April, down by 0.2% to 898,200. A gain in the number of production workers was offset by a larger decline in nonproduction and supervisory employees. The average workweek jumped from 40.9 hours in March to 41.5 hours in April. Combined with the increase in production workers, labor input into the chemical industry rose in April, suggesting expansion. This is consistent with the details of the ISM Manufacturing PMI® report. Annual growth in the average hourly earnings of production workers slowed from 4.2% in March to 3.9% in April.
Chemical industry construction spending expanded by 2.8% in March to a $35.5 billion annual pace. Compared to last March, spending was up 10.2%.
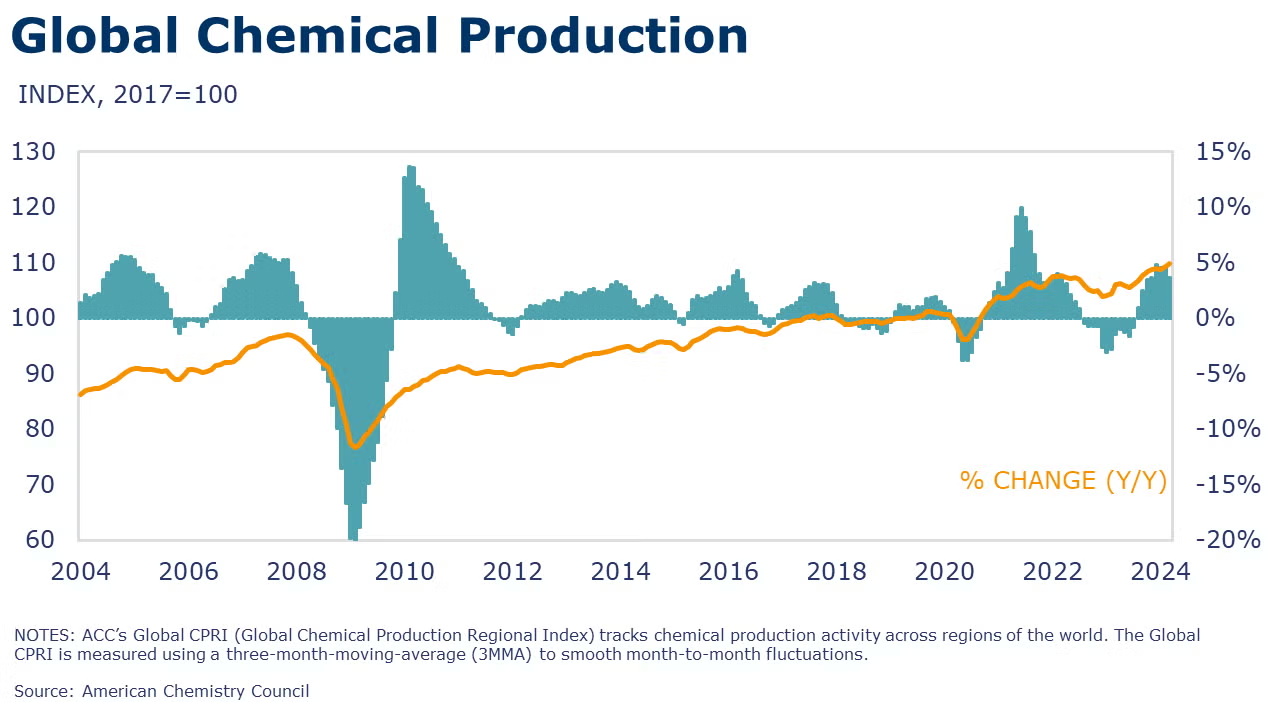
Following a 0.5% gain in February, ACC’s Global Chemical Production Regional Index (Global CPRI) rose by 0.6% in March. Growth was observed in all regions, with significant contributions from the U.S., China, and Germany. All segments grew with agricultural chemicals scoring the highest gain. Global chemicals production growth was up 3.6% Y/Y.
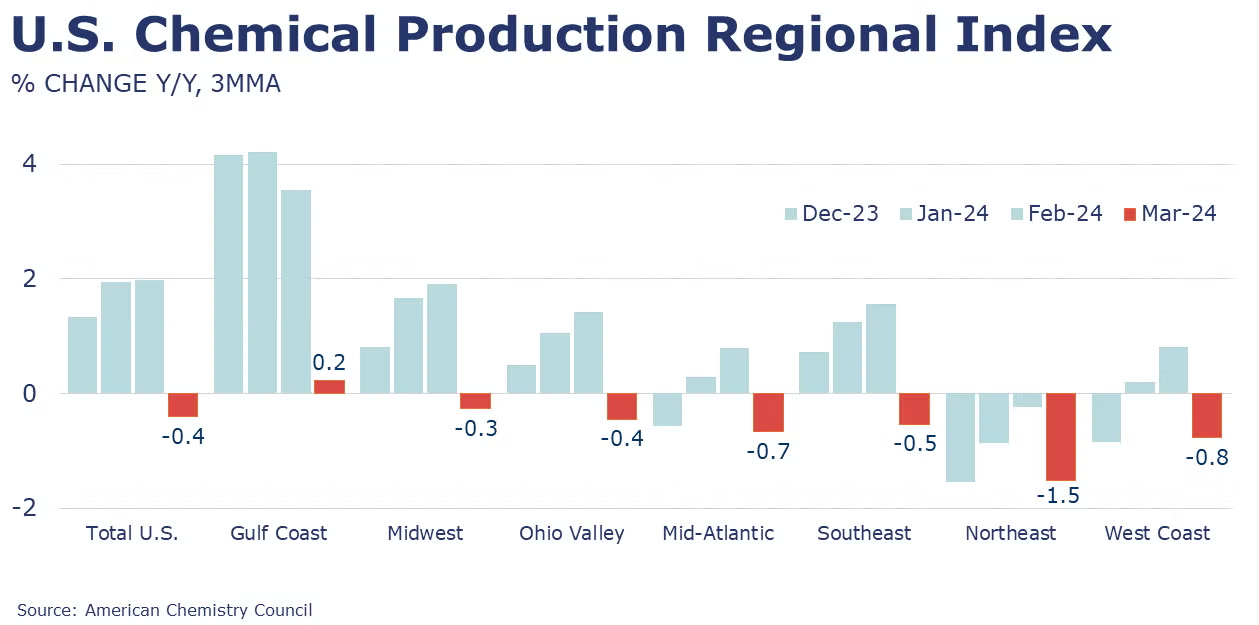
ACC’s U.S. Chemical Production Regional Index (U.S. CPRI) rose 0.1% in March, following a revised 2.0% gain in February. Measured on a 3MMA basis, chemical output in the U.S. was higher for a second month in a row with continued gains across all regions. There were signs of recovery in the output volumes of basic industrial chemicals and consumer products that were offset by ongoing weakness in agricultural chemicals and specialty chemicals. Output of synthetic materials was essentially flat. Compared to last March, U.S. chemical production was off by 0.4%.
Note On the Color Codes
Banner colors reflect an assessment of the current conditions in the overall economy and the business chemistry of chemistry. For the overall economy we keep a running tab of 20 indicators. The banner color for the macroeconomic section is determined as follows:
Green – 13 or more positives
Yellow – between 8 and 12 positives
Red – 7 or fewer positives
There are fewer indicators available for the chemical industry. Our assessment on banner color largely relies upon how chemical industry production has changed over the most recent three months.
For More Information
ACC members can access additional data, economic analyses, presentations, outlooks, and weekly economic updates through ACCexchange.
In addition to this weekly report, ACC offers numerous other economic data that cover worldwide production, trade, shipments, inventories, price indices, energy, employment, investment, R&D, EH&S, financial performance measures, macroeconomic data, plus much more. To order, visit http://store.americanchemistry.com/.
Every effort has been made in the preparation of this weekly report to provide the best available information and analysis. However, neither the American Chemistry Council, nor any of its employees, agents or other assigns makes any warranty, expressed or implied, or assumes any liability or responsibility for any use, or the results of such use, of any information or data disclosed in this material.
Contact us at ACC_EconomicsDepartment@americanchemistry.com.

