MACROECONOMY & END-USE MARKETS
ACC published its Mid-Year Situation and Outlook this week. Following a strong Q1, uncertainty has emerged as an economic headwind to businesses and consumers. Near term weakness in manufacturing activity is expected amid supply chain disruptions, both in the U.S. and abroad.
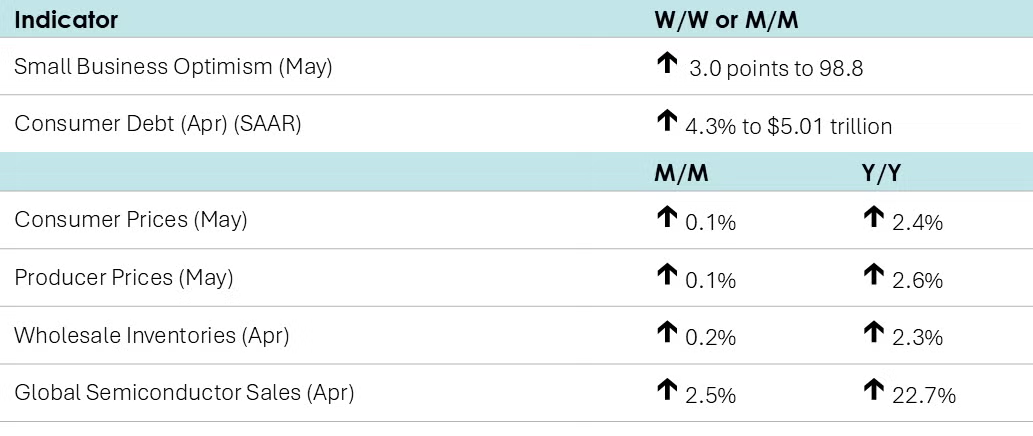
Consumer prices edged higher by 0.1% in May, with higher prices for food, shelter, and appliances offsetting lower prices for energy, airline fares, vehicles, and apparel. Excluding food and energy, core consumer prices also rose by 0.1%. Compared to a year ago, headline consumer prices were up 2.4% Y/Y (up from April’s four-year low 2.3% Y/Y) while core consumer prices were up 2.8% Y/Y, steady for a third month.
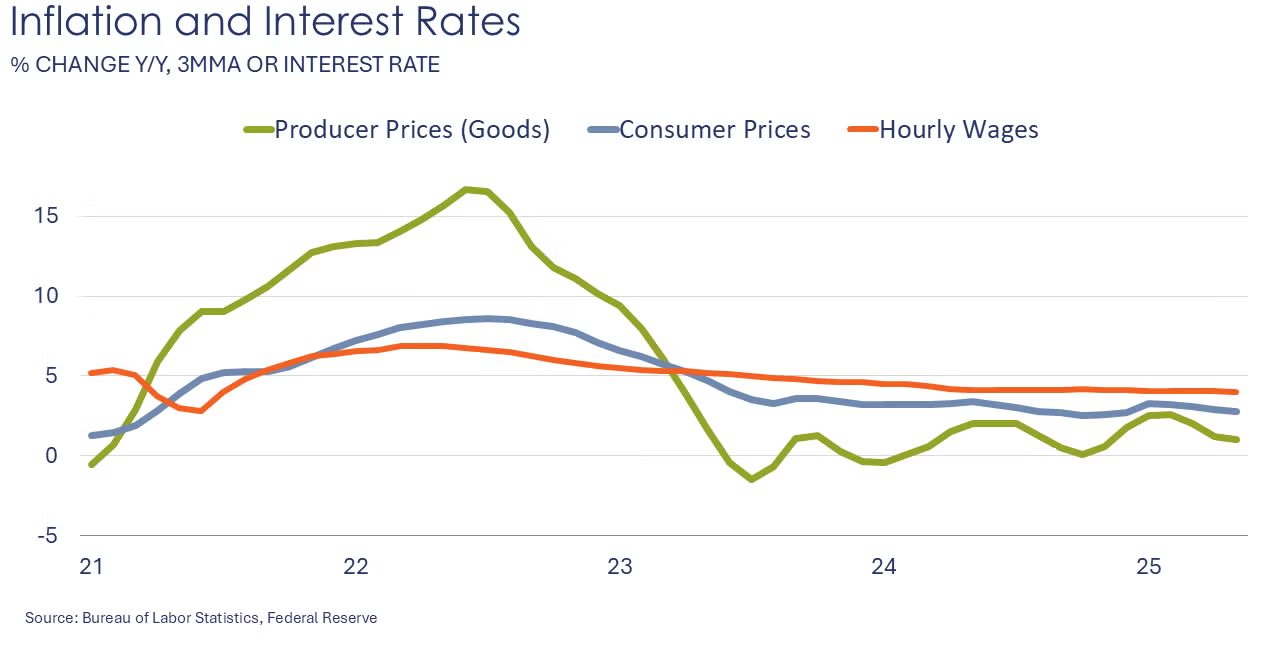
Producer prices also edged higher by 0.1% in May, with gains in prices for both final demand goods and services. Compared to a year ago, headline producer prices were up 2.6% Y/Y, an increase from April’s 2.5% Y/Y gain. Growth in prices for final demand goods picked up slightly (to 1.3% Y/Y) following three months of easing while the pace of growth in prices for final demand services eased (to 3.2% Y/Y) for a second month.
The number of initial jobless claims was flat (at 248,000) during the week ending June 7th. The number of continuing claims continued to expand, however, up by 54,000 to 1.956 million, the highest level since August 2023.
Consumer debt balances expanded at a 4.3% seasonally adjusted annual rate (SAAR). Balances expanded in both revolving (i.e., credit card) debt and balances on nonrevolving (i.e., car loans, student loans) debt were also higher.
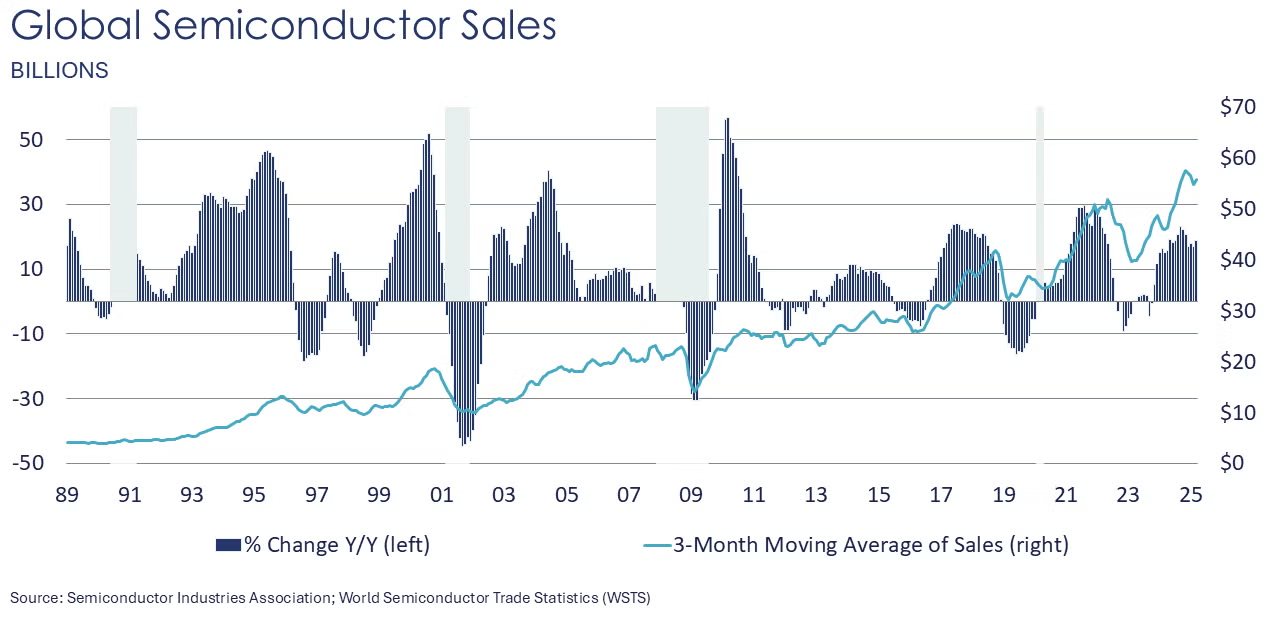
Global semiconductor sales rose 2.5% in April with the largest gains in China and other Asia/Pacific. Sales in the Americas was down 1.1%. Compared to a year ago, global semiconductor sales were up 22.7% Y/Y.
Wholesale inventories rose 0.2% in April, following a similar increase in March. The largest gains in inventories were in computer and professional equipment, hardware, pharmaceuticals, apparel, and groceries. The largest declines were in petroleum products, lumber, chemicals, and machinery. Sales at the wholesale level edged higher by 0.1% (following a 0.8% gain in March). Compared to a year ago, wholesale sales were up 6.0% Y/Y while inventories were ahead by 2.3% Y/Y. The inventories-to-sales ratio remained steady compared to March at 1.30. A year ago, the ratio was 1.34.
The NFIB Small Business Optimism Index rose in May for the first time in six months, up by 3.0 points to 98.8. Improvement in expected business conditions and sales expectations contributed the most to the rise in the index. The uncertainty component rose two points from April to 94. Eighteen percent of small business owners reported taxes as their single most important problem, up two points from April and ranking as the top problem.
CHEMICALS
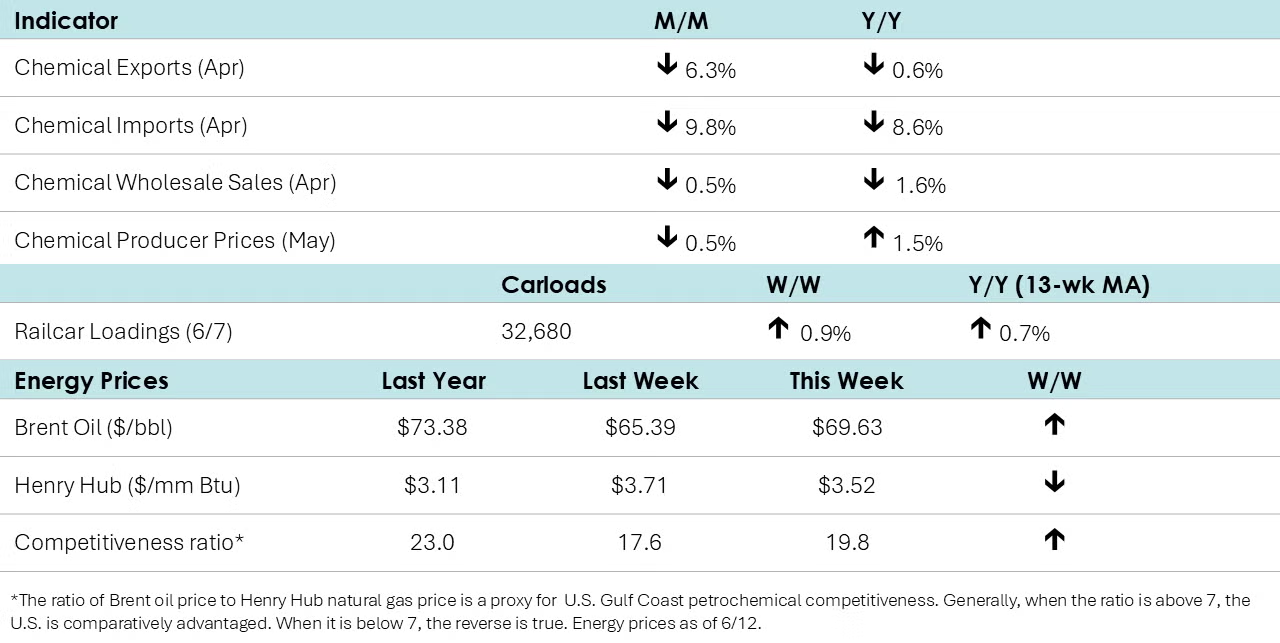
According to data released by the Association of American Railroads, chemical railcar loadings were up to 32,680 for the week ending June 7th. Loadings were up 0.7% Y/Y (13-week MA), up 2.0% YTD/YTD and have been on the rise for seven of the last 13 weeks.
Sales of chemicals at the wholesale level fell by 0.5% in April (following a 0.3% gain in March). Wholesale chemical inventories fell 1.3% (after a 1.9% gain in March). Compared to a year ago, sales were lower by 1.6% Y/Y while inventories were up 0.7% Y/Y. The inventories-to-sales ratio for chemicals fell from 1.15 in March to 1.14 in April. A year ago, the ratio was 1.11.
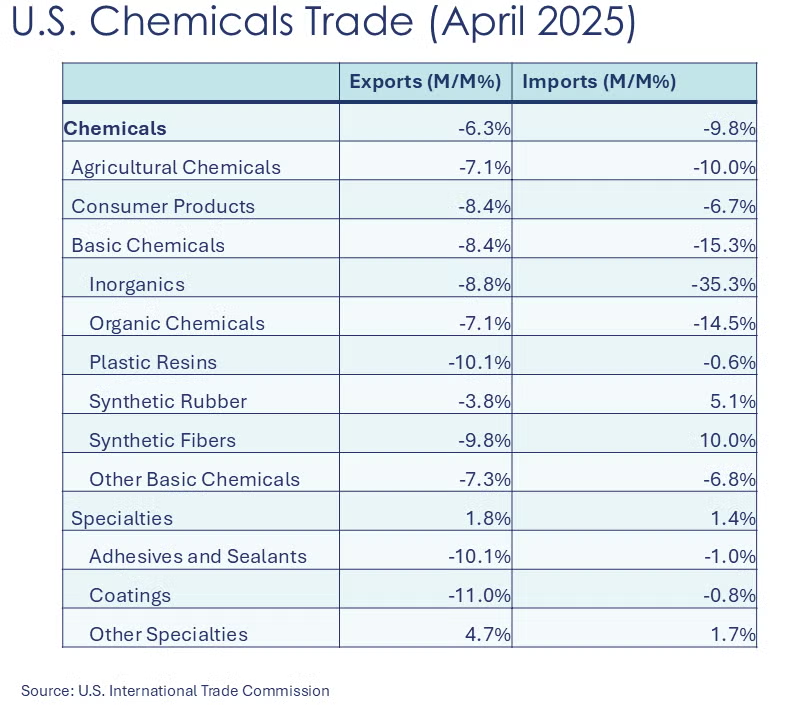
After an impressive double-digit growth in March, U.S. chemical exports declined by 6.3% in April as companies wrapped up front-loading ahead of the tariffs taking effect. All sub-segments showed a loss, except for Other Specialties, which grew by 4.7%. Chemical imports declined by 9.8% in April. All segments, except for synthetic rubber, synthetic fibers, and other specialties, recorded a loss. Compared to a year ago, chemical exports decreased by 0.6% year-over-year (Y/Y), while imports declined by 8.6% Y/Y. As imports fell faster than exports, the chemical trade surplus rose from $2.2 billion in March to $2.5 billion in April.
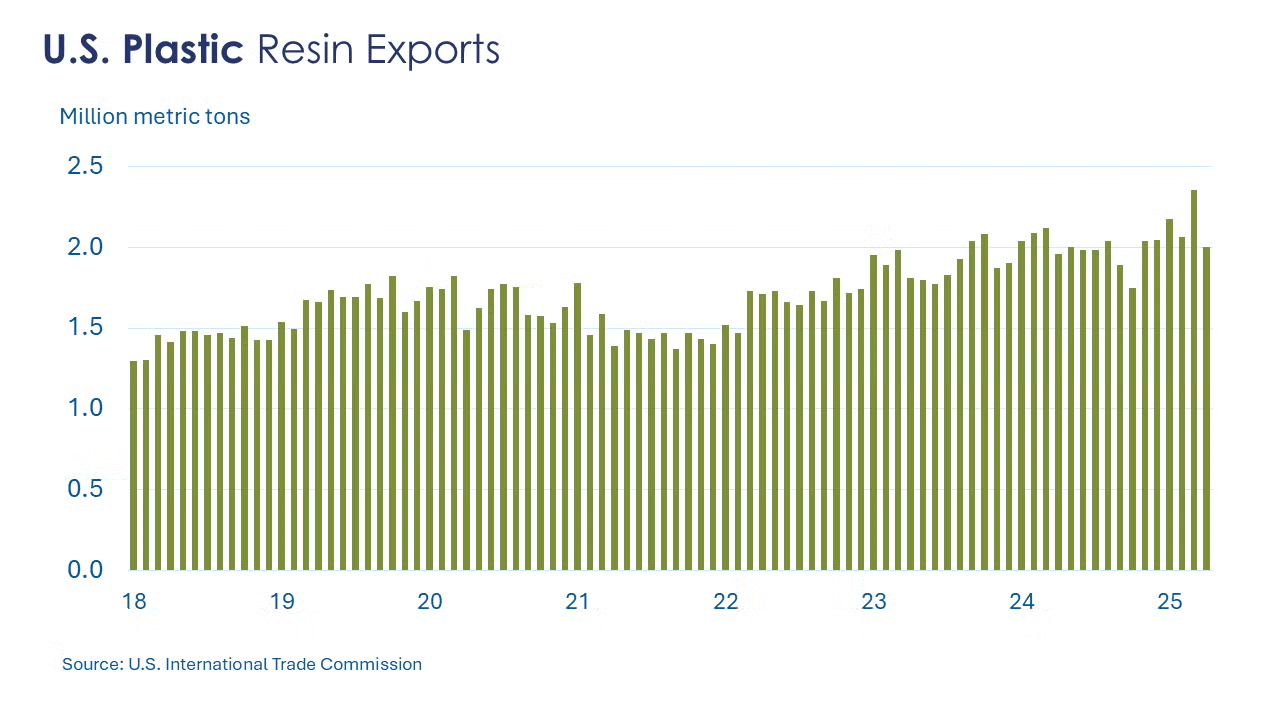
Following a surge in March to a record high, U.S. plastic resin exports dropped 14.9% in April to 2.0 million metric tons. Compared to a year ago, resin exports were up 0.6%.
Following five months of gains, chemical producer prices fell 0.5% in May. There were gains in the prices of agricultural chemicals, inorganic chemicals, and coatings. These gains were offset by lower prices for organic chemicals, plastic resins, synthetic rubber, manufactured fibers, and other specialty chemicals. Prices for consumer chemicals were flat. Compared to a year ago, chemical producer prices were up 1.5% Y/Y.
Energy Wrap-Up
- Oil prices rose on increasing tension in the Middle East as Iran said it opened a new enrichment site in secret. News of a tentative trade agreement with China also raised demand expectations which put upward pressure on Brent.
- Natural gas prices moved a little lower from where they were last week.
- Another solid build (109 BCF) in U.S. working gas inventories, the seventh straight triple-digit gain.
- The combined oil & gas rig count fell by four to 556.
For More Information
ACC members can access additional data, economic analyses, presentations, outlooks, and weekly economic updates through ACCexchange.
In addition to this weekly report, ACC offers numerous other economic data that cover worldwide production, trade, shipments, inventories, price indices, energy, employment, investment, R&D, EH&S, financial performance measures, macroeconomic data, plus much more. To order, visit http://store.americanchemistry.com/.
Every effort has been made in the preparation of this weekly report to provide the best available information and analysis. However, neither the American Chemistry Council, nor any of its employees, agents or other assigns makes any warranty, expressed or implied, or assumes any liability or responsibility for any use, or the results of such use, of any information or data disclosed in this material.
Contact us via email.

