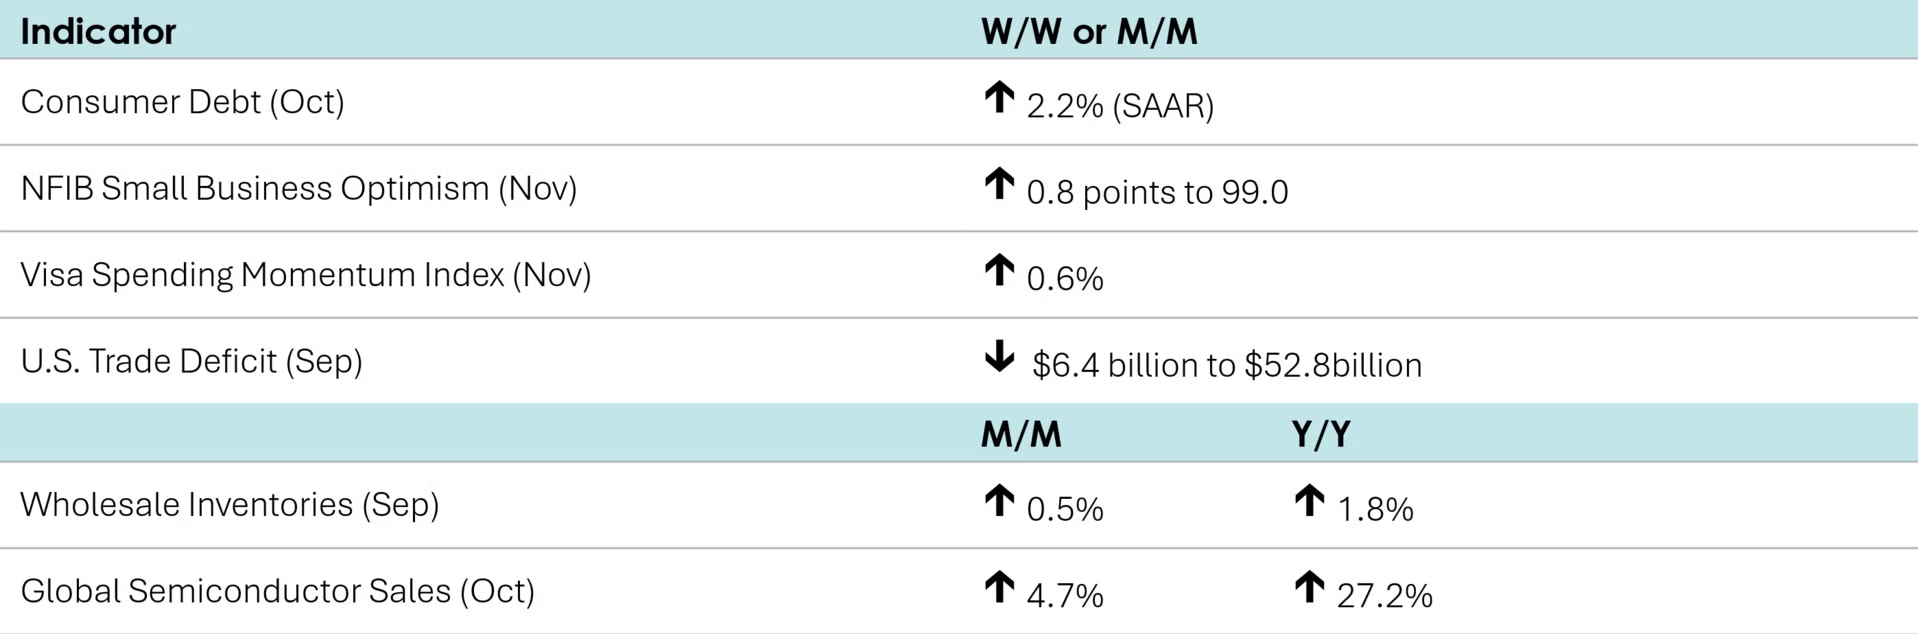
Small business optimism rose in November as the headline index gained 0.8 points to 99.0. Six out of the 10 index components increased, particularly real sales growth expectations. Increasing uncertainty over capital expenditure plans over the next three to six months drove the overall Uncertainty Index higher. Lack of qualified labor continued to be a problem for small business owners.
The headline Visa Spending Momentum Index (SMI) rose 0.6% to 99.2 in November, up for the fourth month in a row. While still below 100, the November reading is the highest since July (values above 100 signal strengthening momentum in consumer spending, while values below 100 suggest weakening). SMI is an economic indicator measuring consumer spending based on purchasing data from Visa-branded credit and debit cards.
Citing a slower labor market, the Federal Reserve lowered interest rates by a quarter point, a third consecutive cut. The overnight borrowing rate is now in the 3.50%-3.75% range, 1.75 percentage points lower than it was in September 2024 when the Fed began to cut rates.
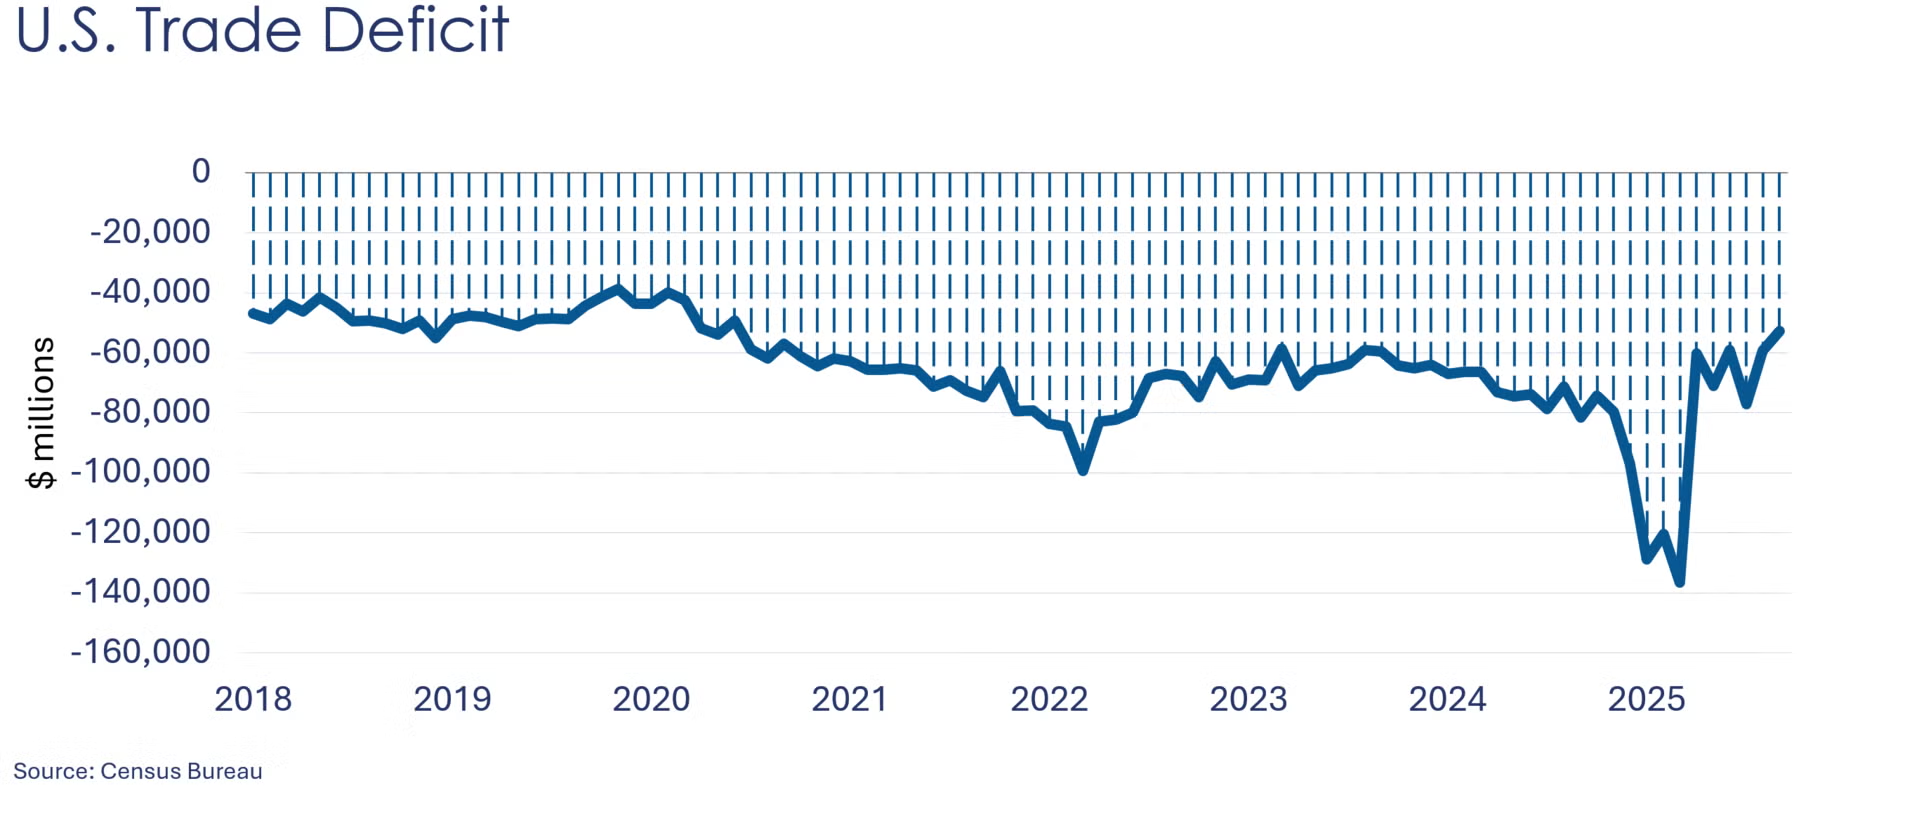
The U.S. trade deficit fell by $6.4 billion in September to $52.8 which was a five-year low. The decline in the trade deficit reflected growth in exports that exceeded a smaller gain in imports. Higher exports of industrial supplies and materials (which included significant external movements of nonmonetary gold) and consumer goods offset lower exports of capital goods. On the import side, there was a similar pattern – higher imports of consumer goods and industrial supplies and materials that were offset by lower imports of capital goods.
Wholesale inventories rose 0.5% in September following a 0.1% decline in August. The largest gains were in computer, professional, and electrical equipment, as well as drugs and metals. Wholesale sales declined 0.2%, driven down by computer, electrical, and professional equipment, in addition to machinery, petroleum, and farm products. Compared to a year ago, sales were up 4.8% Y/Y while inventories were up 1.8% Y/Y. The inventories-to-sales ratio rose to 1.33 from 1.28 in August.
Job openings in October were unchanged at 7.7 million. The rate of people voluntarily quitting their job (a rough measure of workers’ confidence in the labor market) declined slightly while layoffs inched up.
Borrowing rose in October as consumer debt climbed at a 2.2% annual rate, down from a revised gain of 2.6% in September. Credit card balances jumped 4.9% in October after gaining 4.0% the prior month, while balances on nonrevolving debt, such as student loans and car loans, grew 1.2% on top of a 2.1% rise in September.
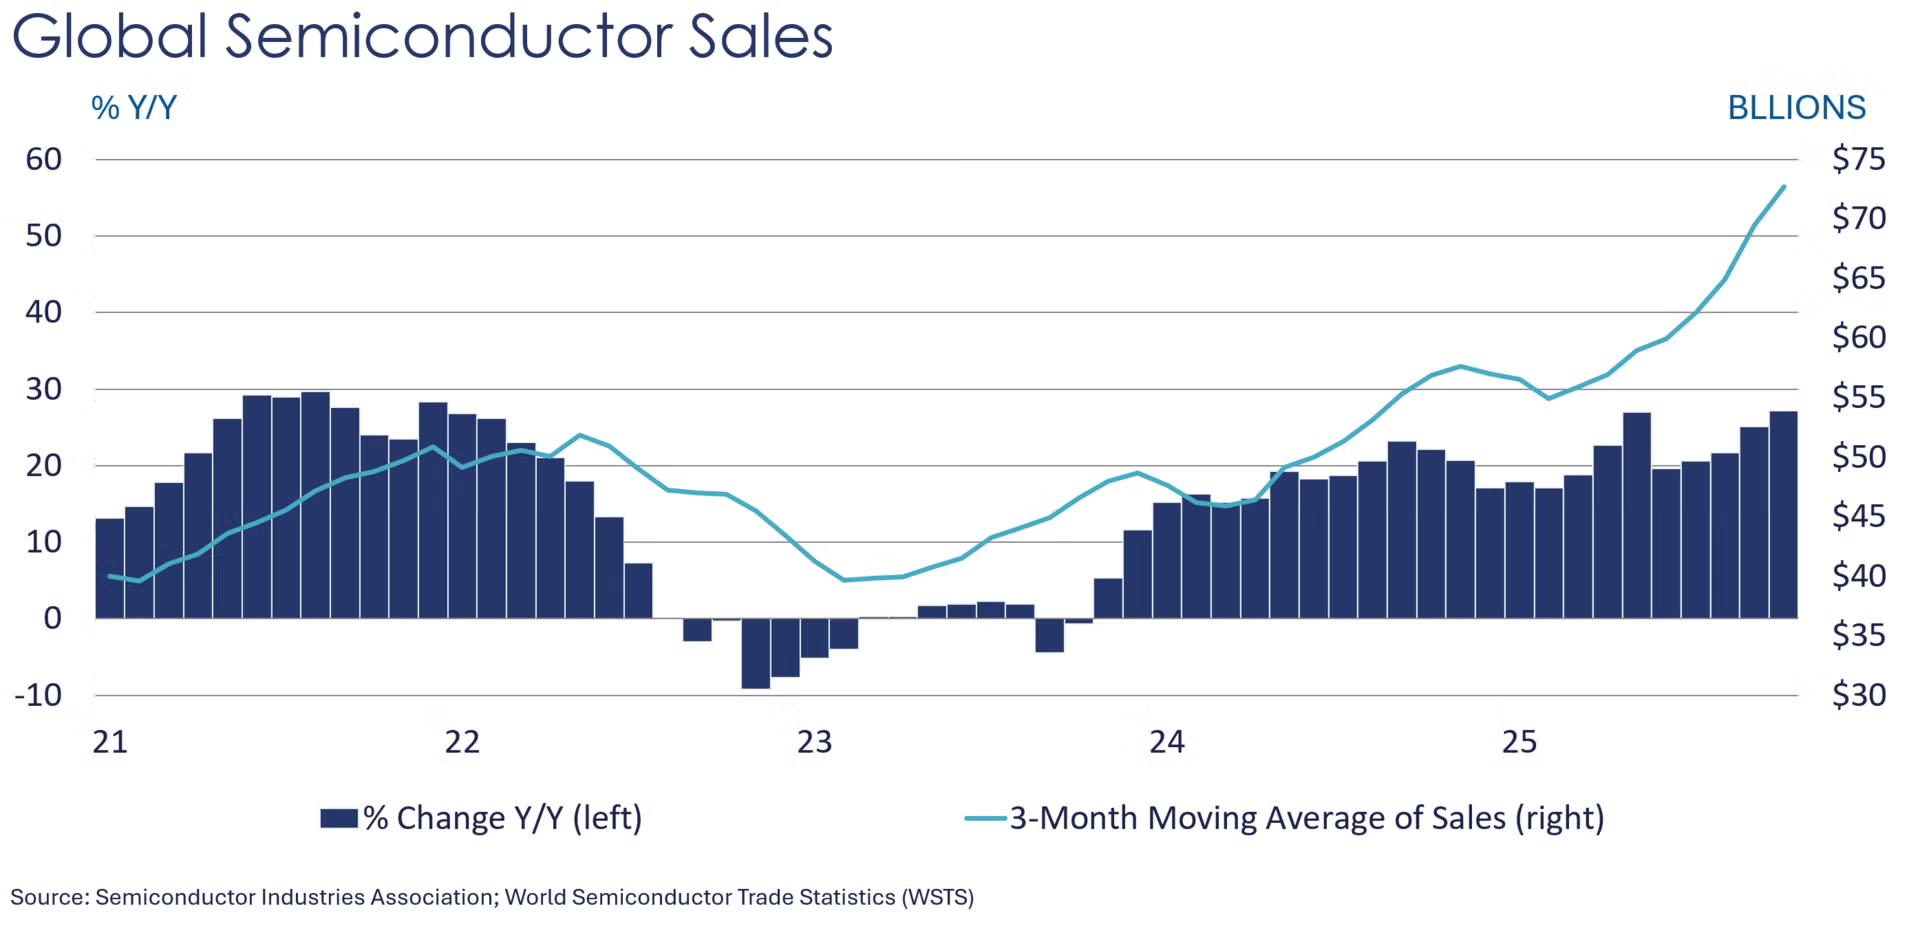
Global semiconductor sales rose 4.7% in October to $72.7 billion. Sales rose in all regions with the fastest growth in other Asia/Pacific (+7.2%) and China (+4.4%). Compared to a year ago, semiconductor sales were up 27.2% Y/Y.
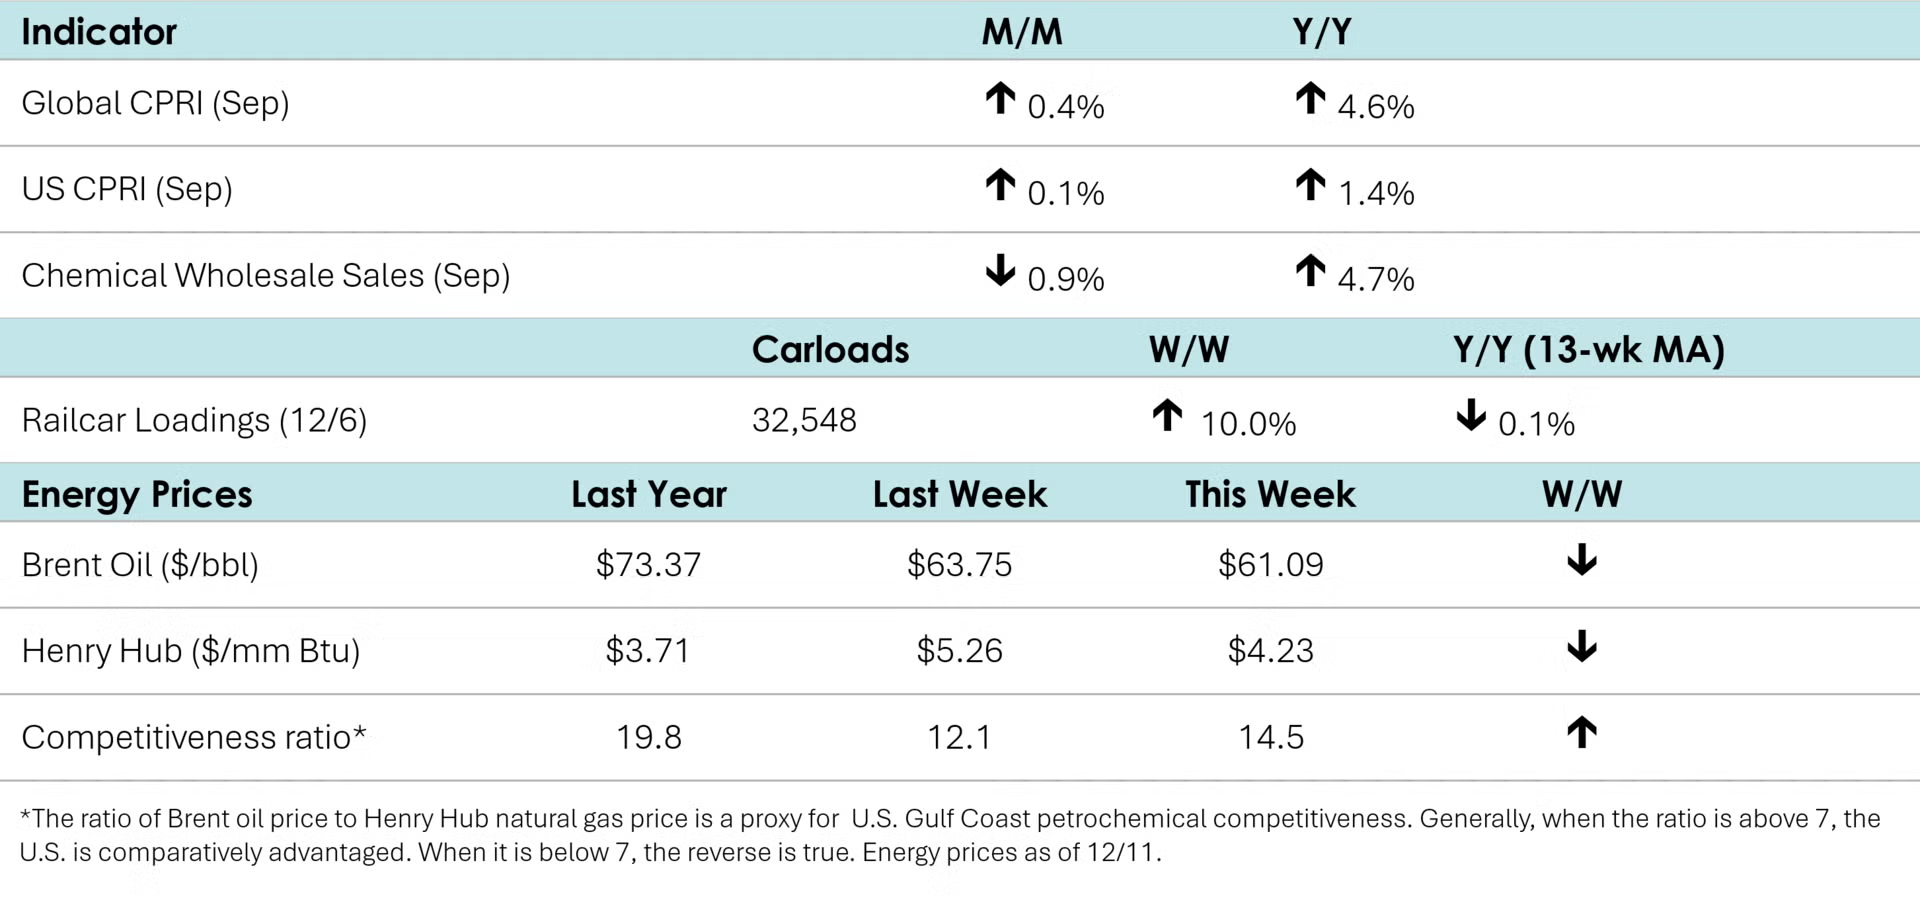
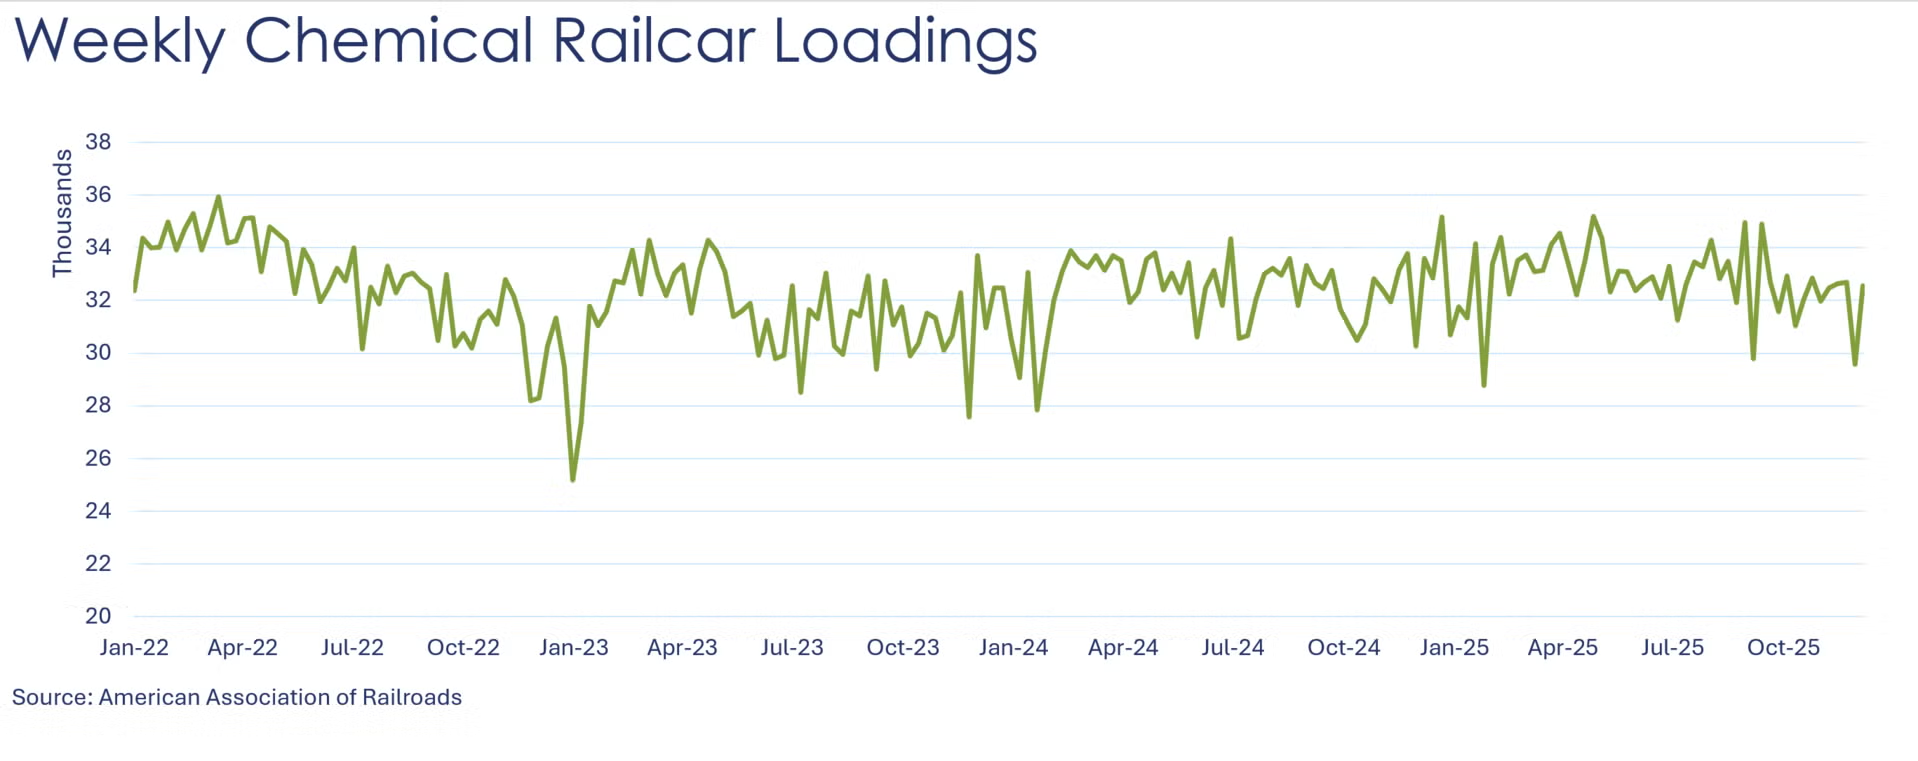
According to data released by the Association of American Railroads, chemical railcar loadings were up to 32,548 for the week ending December 6th. Loadings were slightly lower (-0.1%) Y/Y (13-week MA), up/down 1.2% YTD/YTD and have been on the rise for eight of the last 13 weeks.
Wholesale sales of chemicals fell by 0.9% in September following a 1.3% gain the prior month. Wholesale chemical inventories rose 0.2% after a 1.5% decline in August. Compared to last year, sales were up 4.7% Y/Y while inventories were 2.5% lower Y/Y. The inventories-to-sales ratio rose to 1.09 from 1.07 in August. A year ago, the ratio was 1.17.
Due to the government shutdown, U.S. production data is now released one month later than other countries. To maintain consistency, we will align the Global CPRI with U.S. release dates while continuing to report the most recent trends for other regions until U.S. reporting catches up.
Chemical production in China fell by 0.1% in October as the impact of Super Typhoon Ragasa, which struck southern China in late September, lingered into early October. Despite these disruptions, exports of chemicals and electric vehicles remained strong, indicating ongoing support for production. Year-on-year, output rose 9.7%.
European output dropped 0.5% in October as high energy costs and trade uncertainty continued to drive restructuring. German and French production improved slightly during October, while other major economies weakened. Year-on-year, output declined 2.6%.
Production in South America fell 0.5% in October amid U.S.–Brazil trade tensions and Argentina’s economic challenges. Year-on-year, output declined 1.9%.
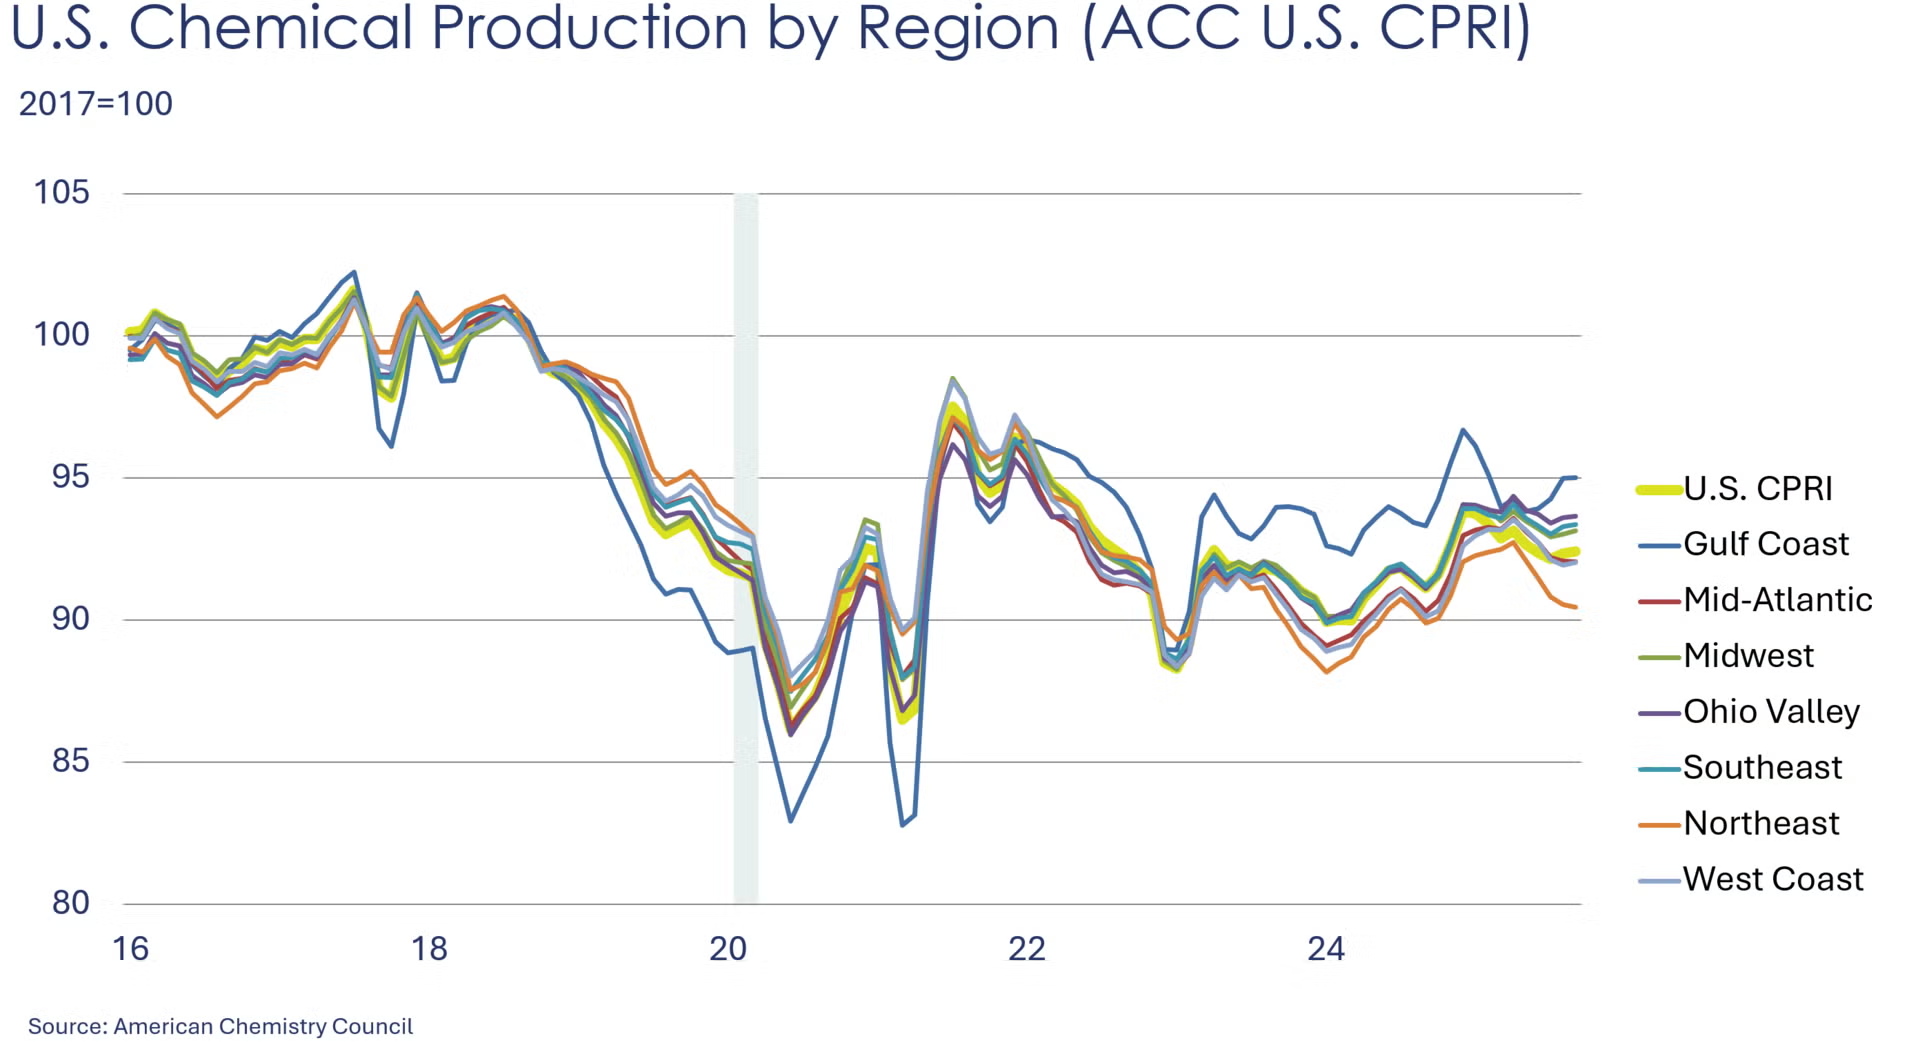
The U.S. CPRI increased marginally by 0.1% in September. This index measures chemical production trends based on a three-month moving average to smooth out month-to-month volatility. Production increased in most regions, except Mid-Atlantic and Northeast region, where production declined. Overall, the U.S. CPRI was 1.4% higher than it was a year ago.
Energy Wrap-Up
• Oil prices fell during the week despite heightened tensions between the U.S. and Venezuela.
• U.S. natural gas prices eased from last week’s season highs on a forecast for warmer weather for the holiday season.
• Last week saw the first sizeable (177 BCF) draw in natural gas inventories as sharply colder temperatures made their way through the U.S.
• The combined oil & gas rig count rose by five to 542.
For More Information
ACC members can access additional data, economic analyses, presentations, outlooks, and weekly economic updates through ACCexchange: https://accexchange.sharepoint.com/Economics/SitePages/Home.aspx
In addition to this weekly report, ACC offers numerous other economic data that cover worldwide production, trade, shipments, inventories, price indices, energy, employment, investment, R&D, EH&S, financial performance measures, macroeconomic data, plus much more. To order, visit http://store.americanchemistry.com/.
Every effort has been made in the preparation of this weekly report to provide the best available information and analysis. However, neither the American Chemistry Council, nor any of its employees, agents or other assigns makes any warranty, expressed or implied, or assumes any liability or responsibility for any use, or the results of such use, of any information or data disclosed in this material.
Contact us at ACC_EconomicsDepartment@americanchemistry.com.


