Nonfarm payrolls expanded by 130,000 in January, up from a slightly revised increase of 48,000 in December and the largest monthly gain since December 2024. Routine benchmark annual revisions to the 2025 data showed the labor market slowed more than previously reported last year. The January jobs rebound came from increases in health care, professional & business services, construction, and manufacturing, with the latter gaining 5,000. On the flip side, government, financial activities, information, and transportation & warehousing witnessed losses. Average hourly earnings were essentially steady at 3.7% Y/Y. According to the separate household survey, the unemployment rate ticked lower to 4.3% in January from 4.4% the previous month. The unemployment rate peaked at 4.5% in November 2025, which was the highest since September 2021. The labor force grew in January while the number of unemployed declined. An alternative measure of unemployment, the U-6 (which includes a broader set of people that are working part-time or marginally attached to the labor force), dropped to 8.0% after having peaked at 8.7% in November 2025, the highest since August 2021.
Consumer prices rose 0.2% in January, led by a strong contribution from shelter (including the somewhat controversial owner’s equivalent rent). Food prices were up 0.2%, but energy prices fell 1.5% during the month. Core prices advanced 0.2% with gains in prices for several consumer services offsetting lower prices for motor vehicles and home furnishings. Compared to a year ago, headline CPI was up 2.4% Y/Y (down from December’s 2.7% Y/Y growth) while core prices were up 2.5% Y/Y, the lowest annual pace in five years.
Import prices (which exclude tariffs) rose 0.1% in December while export prices increased 0.3%. Compared to last year, import prices were unchanged while export prices grew 3.1%.
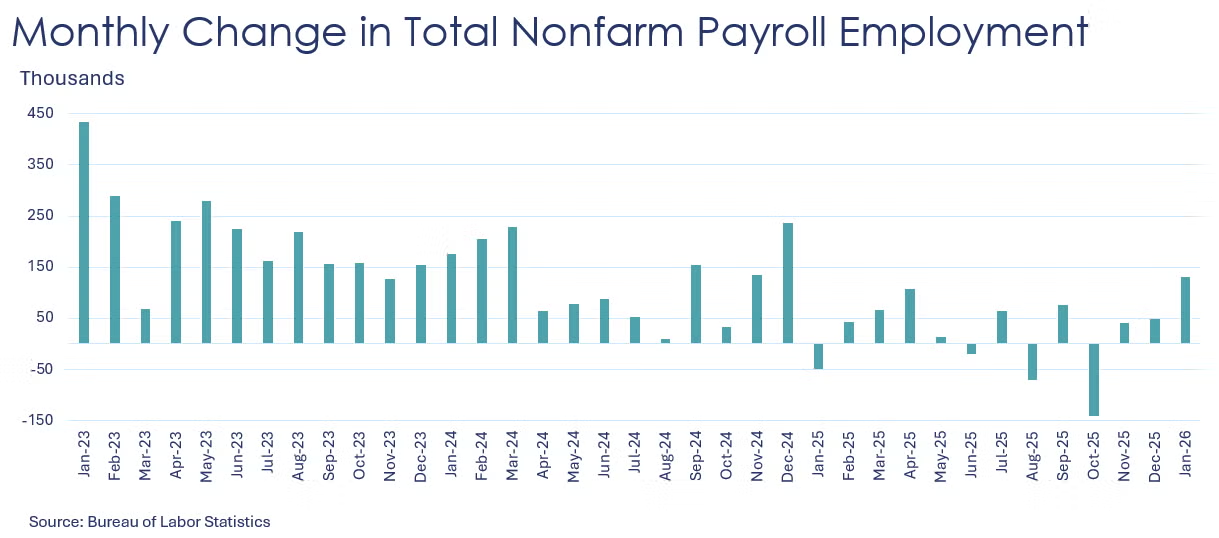
Existing home sales plunged 8.4% in January to a 3.91 million seasonally adjusted annual rate (SAAR), the lowest level since December 2023 and the largest month-over-month decline since February 2022. Inventories dropped 0.8%. Compared to a year earlier, sales dropped 4.4% Y/Y while inventories grew 3.4% Y/Y. At the current sales pace, inventories represent 3.7 months’ supply, up from 3.5 months’ supply a year ago. The median sales price rose 0.9% Y/Y to $396,800.
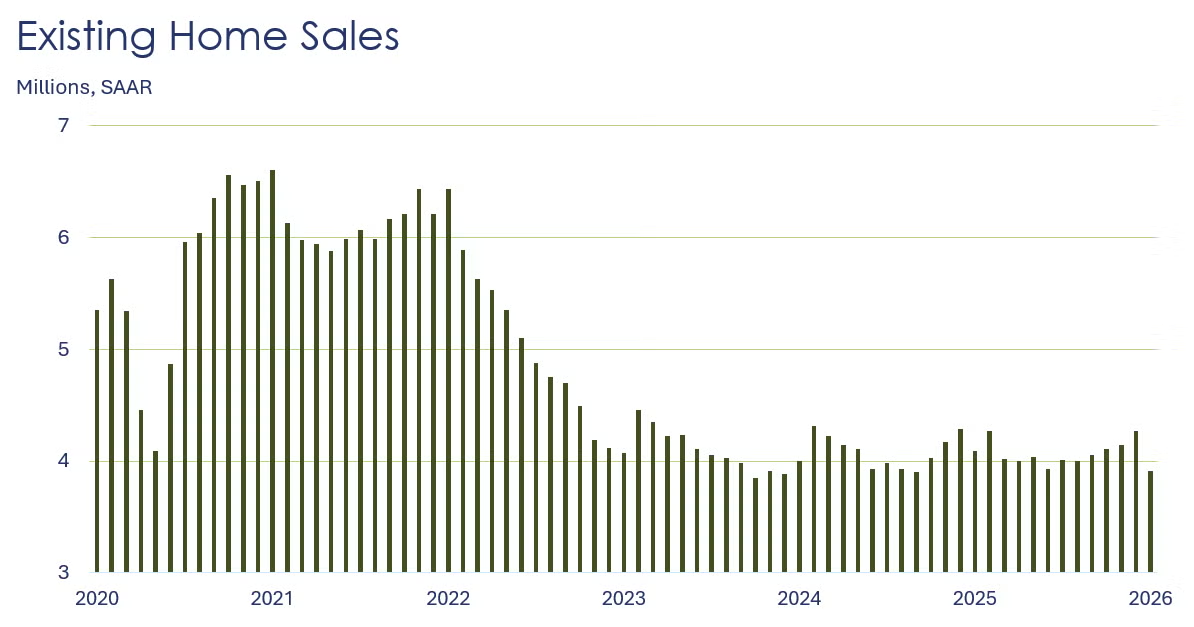
Retail sales were flat in December after rising 0.6% the prior month. Sales of furniture & home furnishings, clothing, electronics & appliances, and motor vehicles & parts declined, while sales at building materials & garden equipment and sporting goods stores and gas stations rose. Sales at online platforms remained virtually unchanged. Compared to a year ago, retail sales were up 2.4% Y/Y.
Global semiconductor sales finished the year on an upswing, up by 2.7%. Sales were higher in the Americas, China, and Other Asia-Pacific while sales declined in Japan and Europe. Compared to a year ago, global semiconductor sales were up 37.1% Y/Y.
Borrowing rose in December as consumer debt climbed at a 5.7% annual rate, up from a revised gain of 1.1% in November and the largest increase since March 2025. Credit card balances jumped 12.6% after losing 1.5% the prior month, while balances on nonrevolving debt, such as student loans and car loans, grew 3.2% on top of a 2.0% rise in November.
Small business optimism declined slightly in January as the headline index lost 0.2 points to 99.3. Three out of the 10 index components increased, particularly expected real sales volume. Seven components declined. Increasing uncertainty over whether it is a good time to expand owners’ businesses drove the overall Uncertainty Index higher.
Combined business inventories rose 0.1% in November, as small gains in wholesale and manufacturing inventories were partly offset by a slight decline in retailer stocks. Combined business sales rose 0.6%, with wholesale and retail sales increasing while manufacturing sales fell slightly. The inventories-to-sales ratio dipped from 1.38 in October to 1.37. A year earlier, the ratio was 1.40.
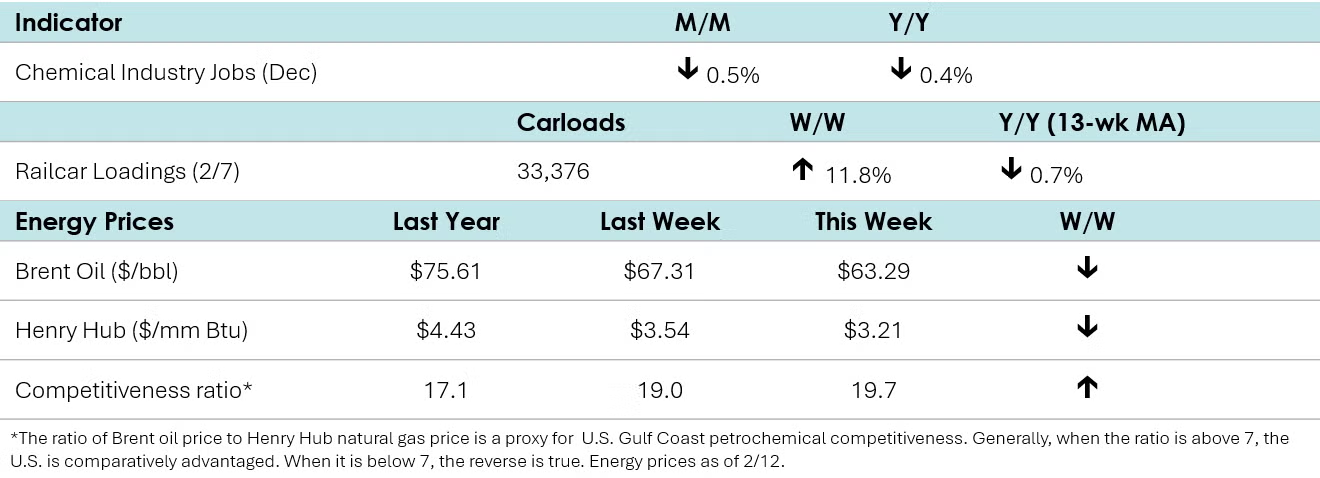
According to data released by the Association of American Railroads, chemical railcar loadings rebounded after Winter Storm Fern, up to 33,376 for the week ending February 7th. Loadings were down 0.7% Y/Y (13-week MA) but up 1.3% YTD.
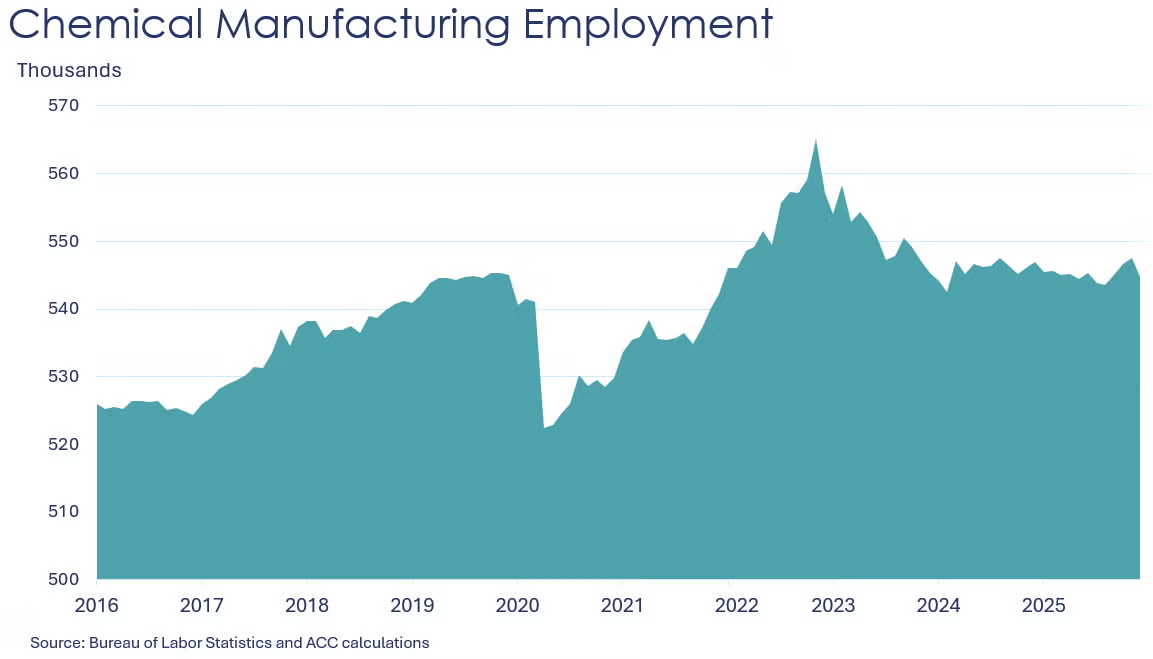
Chemical industry employment dropped in December, down 0.5% to 544,800 and it was off 0.4% Y/Y. Employment in plastic resin manufacturing also eased, down 0.3% to 59,800, a level 0.8% higher than last December. (Note that data at the detailed industry level are lagged one month behind the headline jobs report.)
In January, combined chemical and pharmaceutical jobs declined by 1,800 to 899,000, virtually unchanged from a year earlier. An increase in supervisory & non-production workers offset a decline in production workers. Average hourly earnings for production workers rose 1.7% from a year ago to $32.14. The average workweek for production workers rose to 42.0 hours from 41.6 in December. With a decline in the number of production workers and a slight increase in the average workweek, the implied labor input into the chemical industry rose in January, consistent with the ISM PMI® report from last week showing the chemical industry expanding that month.
Energy Wrap-Up
• Oil prices eased during the week on lowered tensions between U.S. and Iran and a downward revision to IEA’s global oil demand forecast.
• U.S. natural gas prices were lower than a week ago as strong heating demand eased with warmer temperatures.
• Last week saw another large withdrawal from natural gas inventories (249BCF) and while inventory levels are below both the five-year average and last year’s levels, inventories remain within the five-year historical range.
• The combined oil & gas rig count fell by five to 531.
For More Information
ACC members can access additional data, economic analyses, presentations, outlooks, and weekly economic updates through ACCexchange: https://accexchange.sharepoint.com/Economics/SitePages/Home.aspx
In addition to this weekly report, ACC offers numerous other economic data that cover worldwide production, trade, shipments, inventories, price indices, energy, employment, investment, R&D, EH&S, financial performance measures, macroeconomic data, plus much more. To order, visit http://store.americanchemistry.com/.
Every effort has been made in the preparation of this weekly report to provide the best available information and analysis. However, neither the American Chemistry Council, nor any of its employees, agents or other assigns makes any warranty, expressed or implied, or assumes any liability or responsibility for any use, or the results of such use, of any information or data disclosed in this material.
Contact us at ACC_EconomicsDepartment@americanchemistry.com.


