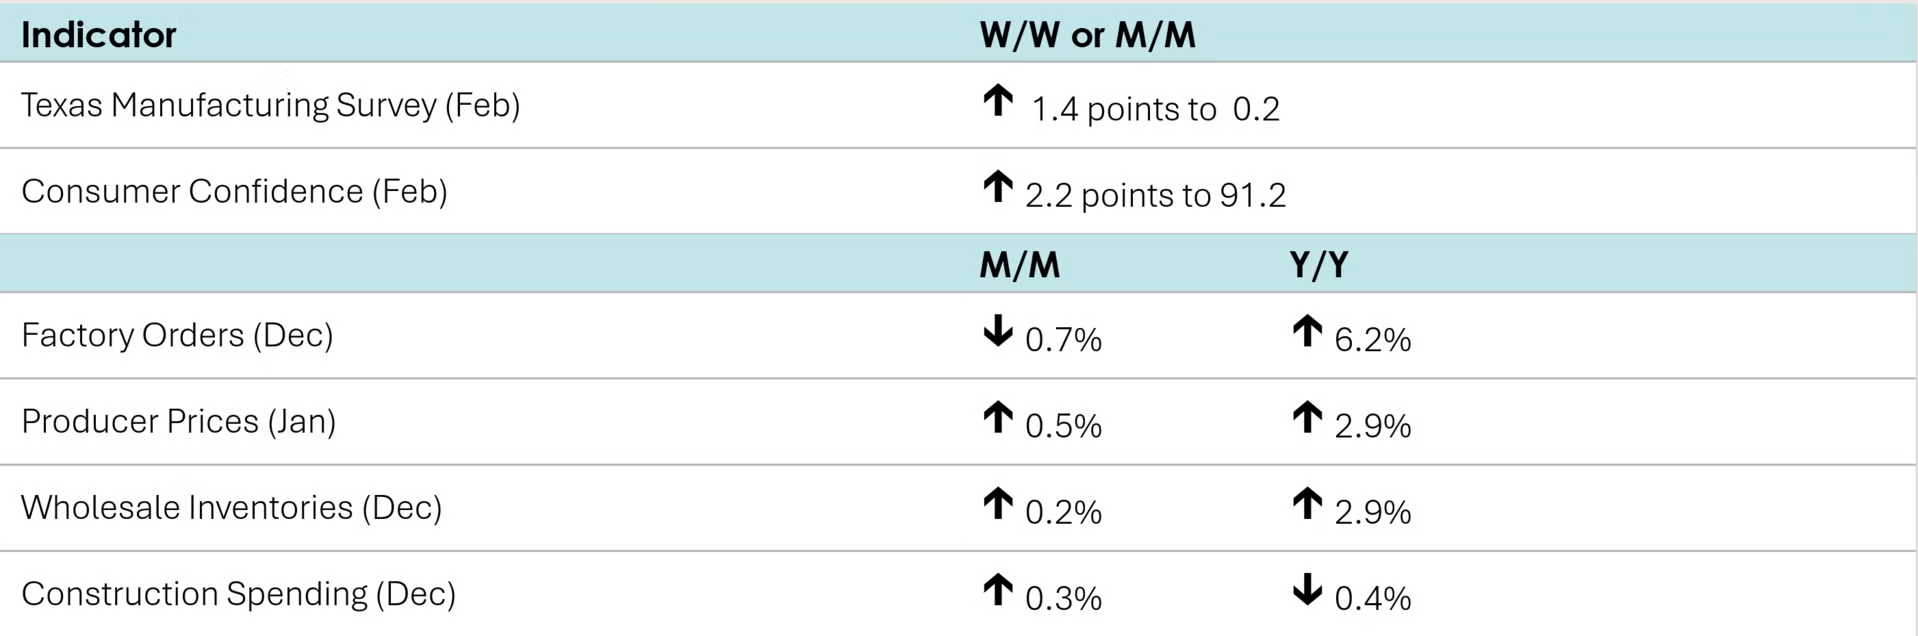
Producer prices rose 0.5% in January after gaining a revised 0.4% in December. The January increase was led by higher prices for final demand services, which advanced 0.8% and were propelled by increases in margin for trade services and transportation and warehousing services. On the flip side, final demand goods prices lost 0.3%, driven down mostly by a drop in gasoline, some food items, and electric power. Compared to a year ago, headline producer prices were up 2.9% Y/Y while core producer prices (excluding food and energy) were up 3.4% Y/Y. Both measures were slightly lower than December’s readings.
Construction spending rose 0.3% in December after gaining 0.4 in November. A 0.5% gain in private spending more than offset an equal percentage decline in the public sector. Private residential construction was higher while nonresidential was lower. Compared to a year ago, construction spending was off 0.4% Y/Y. For all of 2025, construction spending was down 1.4%.
Factory orders fell 0.7% in December, with a pullback in civilian aircraft leading the decline. Orders were higher for computers, motor vehicles, machinery, metals & metal products, and electrical equipment. Nondurable goods orders were flat. Core business orders (nondefense capital goods excluding aircraft) rose 0.8%. Unfilled orders, a measure of the manufacturing pipeline continued to expand. Manufacturing shipments finished the year higher, up by 0.5% while inventories edged higher by 0.1%. The inventories-to-shipments ratio eased from 1.57 in November to 1.56 in December.
Manufacturing activity in Texas swung to a modest expansion in February, according to the Dallas Fed’s Manufacturing Outlook Survey. The general conditions index rose by 1.4 points to +0.2 with growth in production, new orders, shipments, inventories, and employment. Capital spending, however, contracted slightly (following an expansion in January). Looking ahead six months, Texas manufacturers were slightly less optimistic about future general business activity levels.
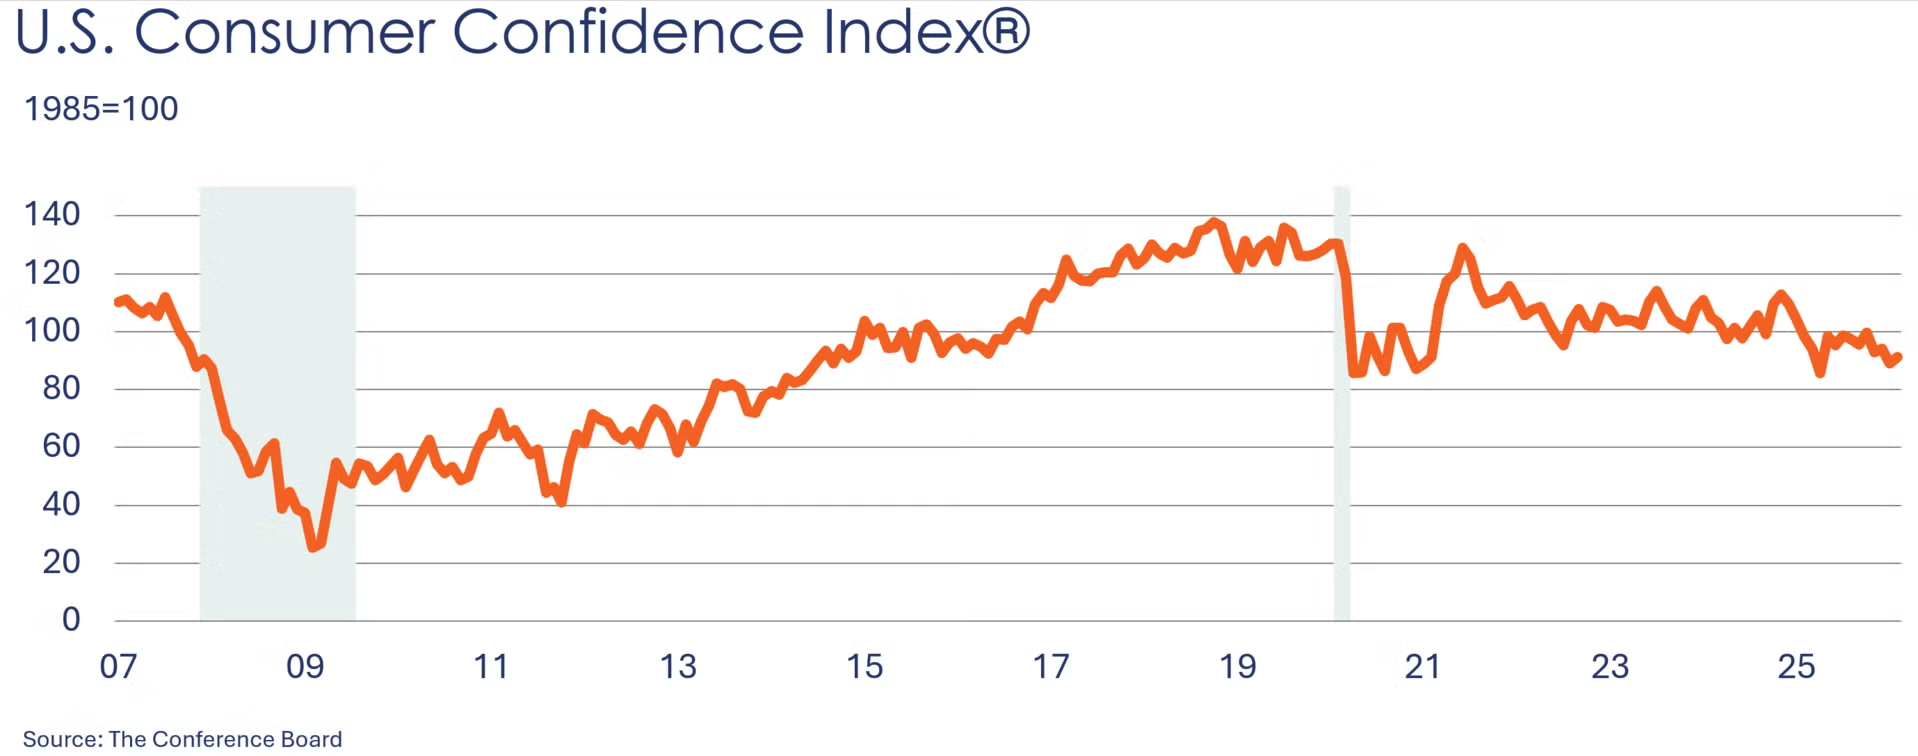
Consumer confidence moved higher in February, up 2.2 points to 91.2. There was an improvement in employment conditions and consumers were less pessimistic about business and labor conditions six months ahead. Consumers’ plans to buy big-ticket items over the next six months rose in February. The reading was consistent with the University of Michigan’s preliminary consumer sentiment index for February.
Wholesale inventories continued to expand by 0.2% in December with broad gains across a number of industries. Sales at the wholesale level rose 1.0% on the back of a 1.4% gain in November. The inventories to sales ratio edged lower from 1.28 in November to 1.27 in December. Compared to a year ago, sales were up 5.2% Y/Y while inventories were ahead by 2.9% Y/Y.
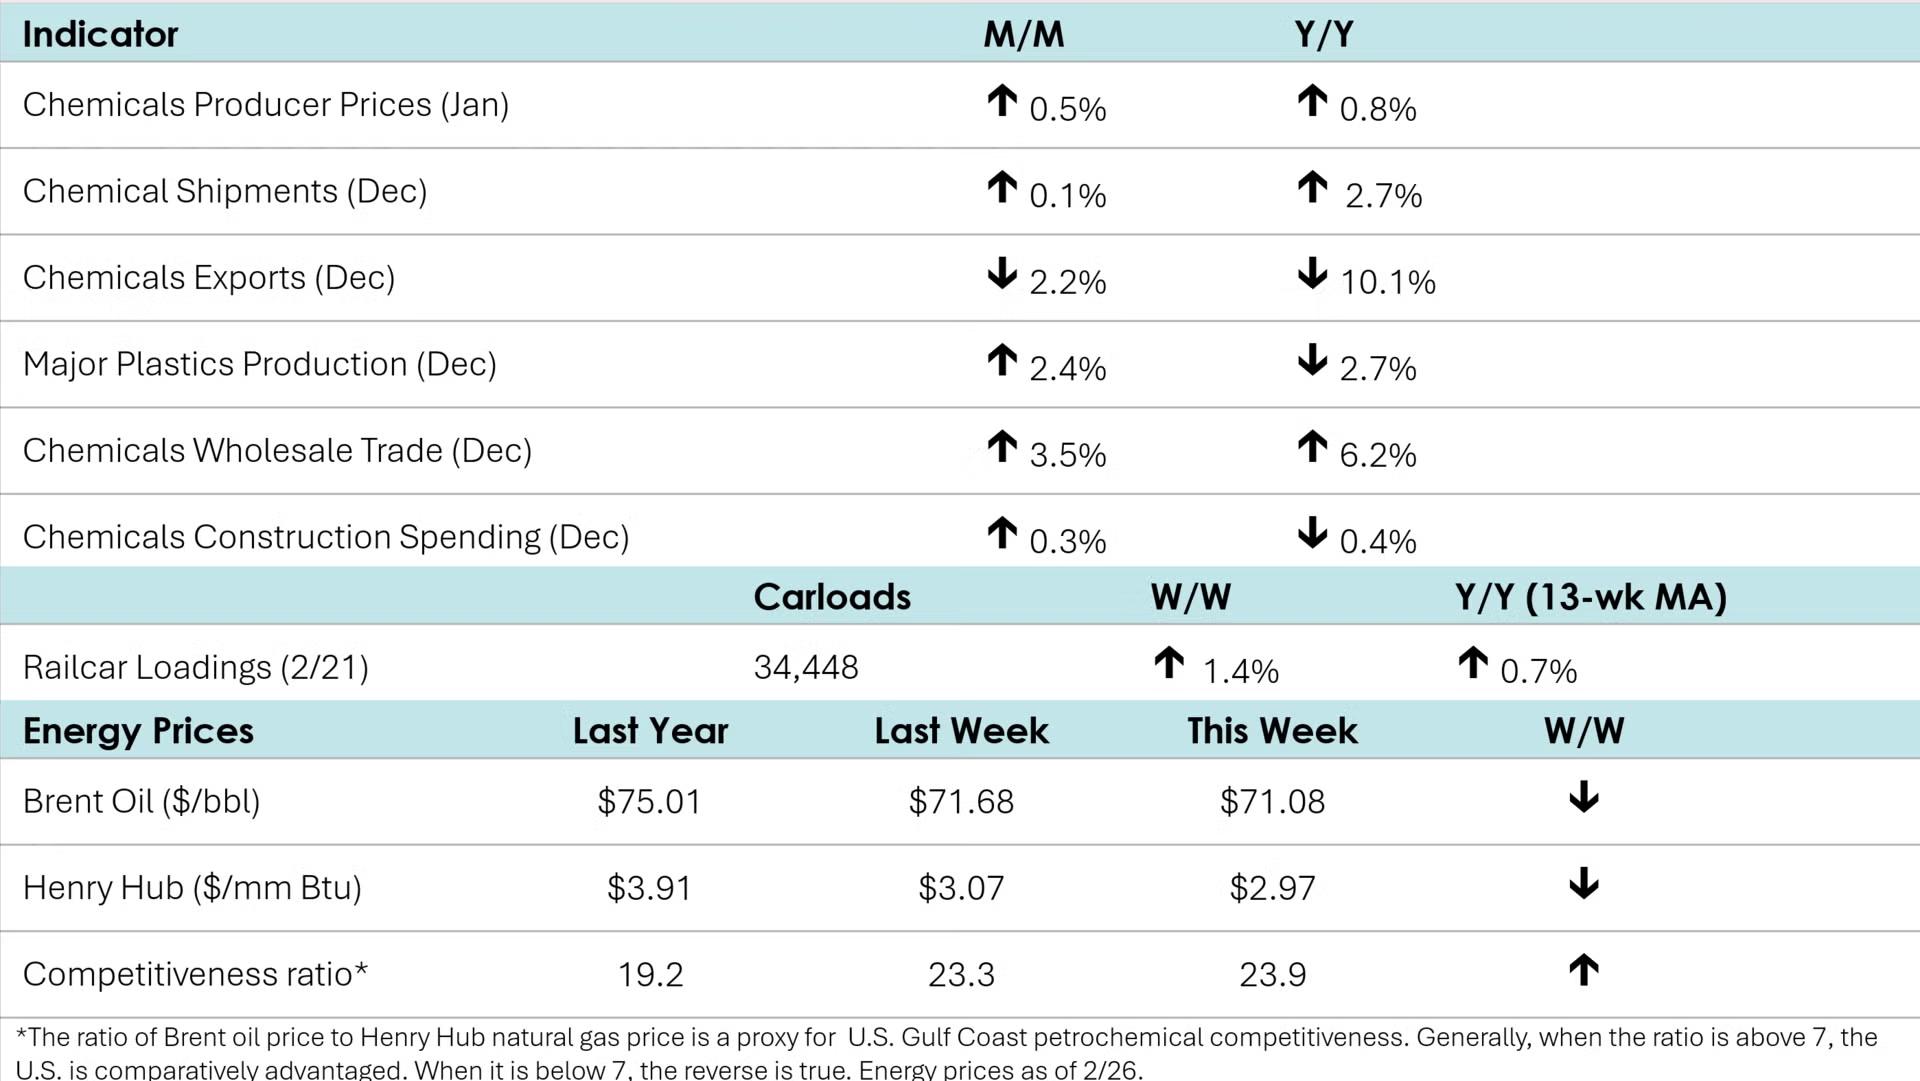
According to data released by the Association of American Railroads, chemical railcar loadings rose to 34,448 for the week ending February 21st. Loadings were down 0.7% Y/Y (13-week MA), but higher by 2.0% YTD.
Chemical producer prices rose 0.5% in January after losing 0.4% in December. December’s is the first monthly increase since August. Prices advanced for inorganic chemicals, synthetic rubber, other specialties, consumer products, specialty chemicals, basic & specialty chemicals, agricultural chemicals, basic chemicals, coatings, and plastic resins. On the other hand, prices dropped for only manufactured fibers and bulk petrochemicals & organics. Chemical prices remained ahead compared to a year ago, up by 0.8% Y/Y, decelerating from a 1.2% Y/Y rise in December.
Chemical construction spending totaled $45.2 billion in December, losing 0.3% over the month after shrinking 0.5% in November. Compared to a year ago, chemical construction spending was up 12.4% Y/Y. Chemical manufacturing construction represented 22.5% of all manufacturing construction spending in December.
Major plastic resin production rose for a second straight month in December, up 2.4% to 8.6 billion pounds. Sales of major resins rose 5.5% to 8.7 billion pounds. Compared to December 2024, both production and sales were lower by 2.7% Y/Y and 4.3% Y/Y, respectively. For the year as a whole, production was off 0.6% in 2025 compared to 2024, but sales were higher by 1.1%.
Chemical shipments edged higher by 0.1% in December, with gains in coatings & adhesives and other chemicals that were offset by lower sales of agricultural chemicals. Chemical inventories also moved higher, up by 0.3% and followed a similar pattern. The inventories-to-shipments ratio remained stable at 1.23. Compared to a year ago, chemical shipments were up 2.7% Y/Y while inventories were up 0.4% Y/Y.
Chemicals sales at the wholesale level jumped 3.5% in December while inventories were up by 0.8%. Sales were up 6.2% Y/Y while inventories were off by 1.4% Y/Y. The inventories-to-sales ratio fell from 1.07 in November to 1.04 in December. That was the lowest ratio since May 2014 and suggests inventories are comparatively lean at the wholesale level.
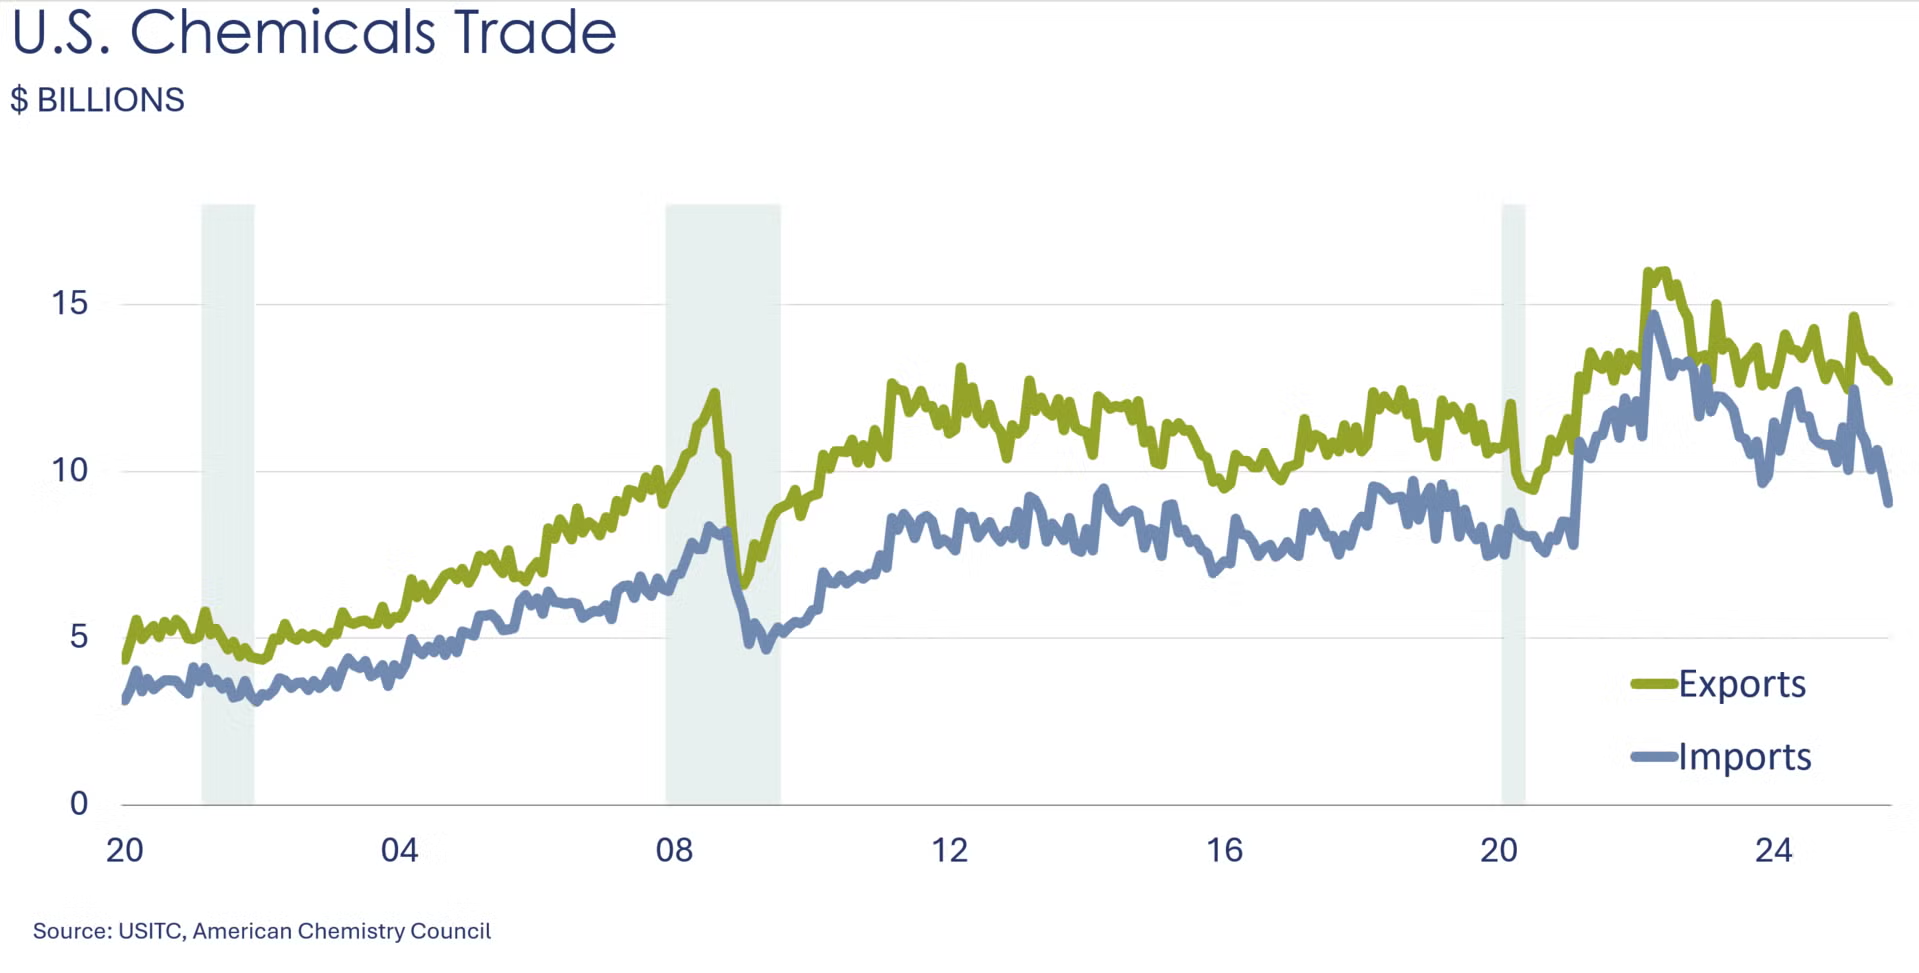
U.S. chemical exports continued to trend downward at the end of the year, slipping 2.2% in December. While agricultural chemicals and consumer chemicals rose 4.4% and 4.1%, respectively, both basic chemicals and specialty chemicals declined 3.3% and 3.2%. On a year‑over‑year basis, total U.S. chemical exports fell 10.1%, and the annual export value for 2025 showed a 3.4% decline.
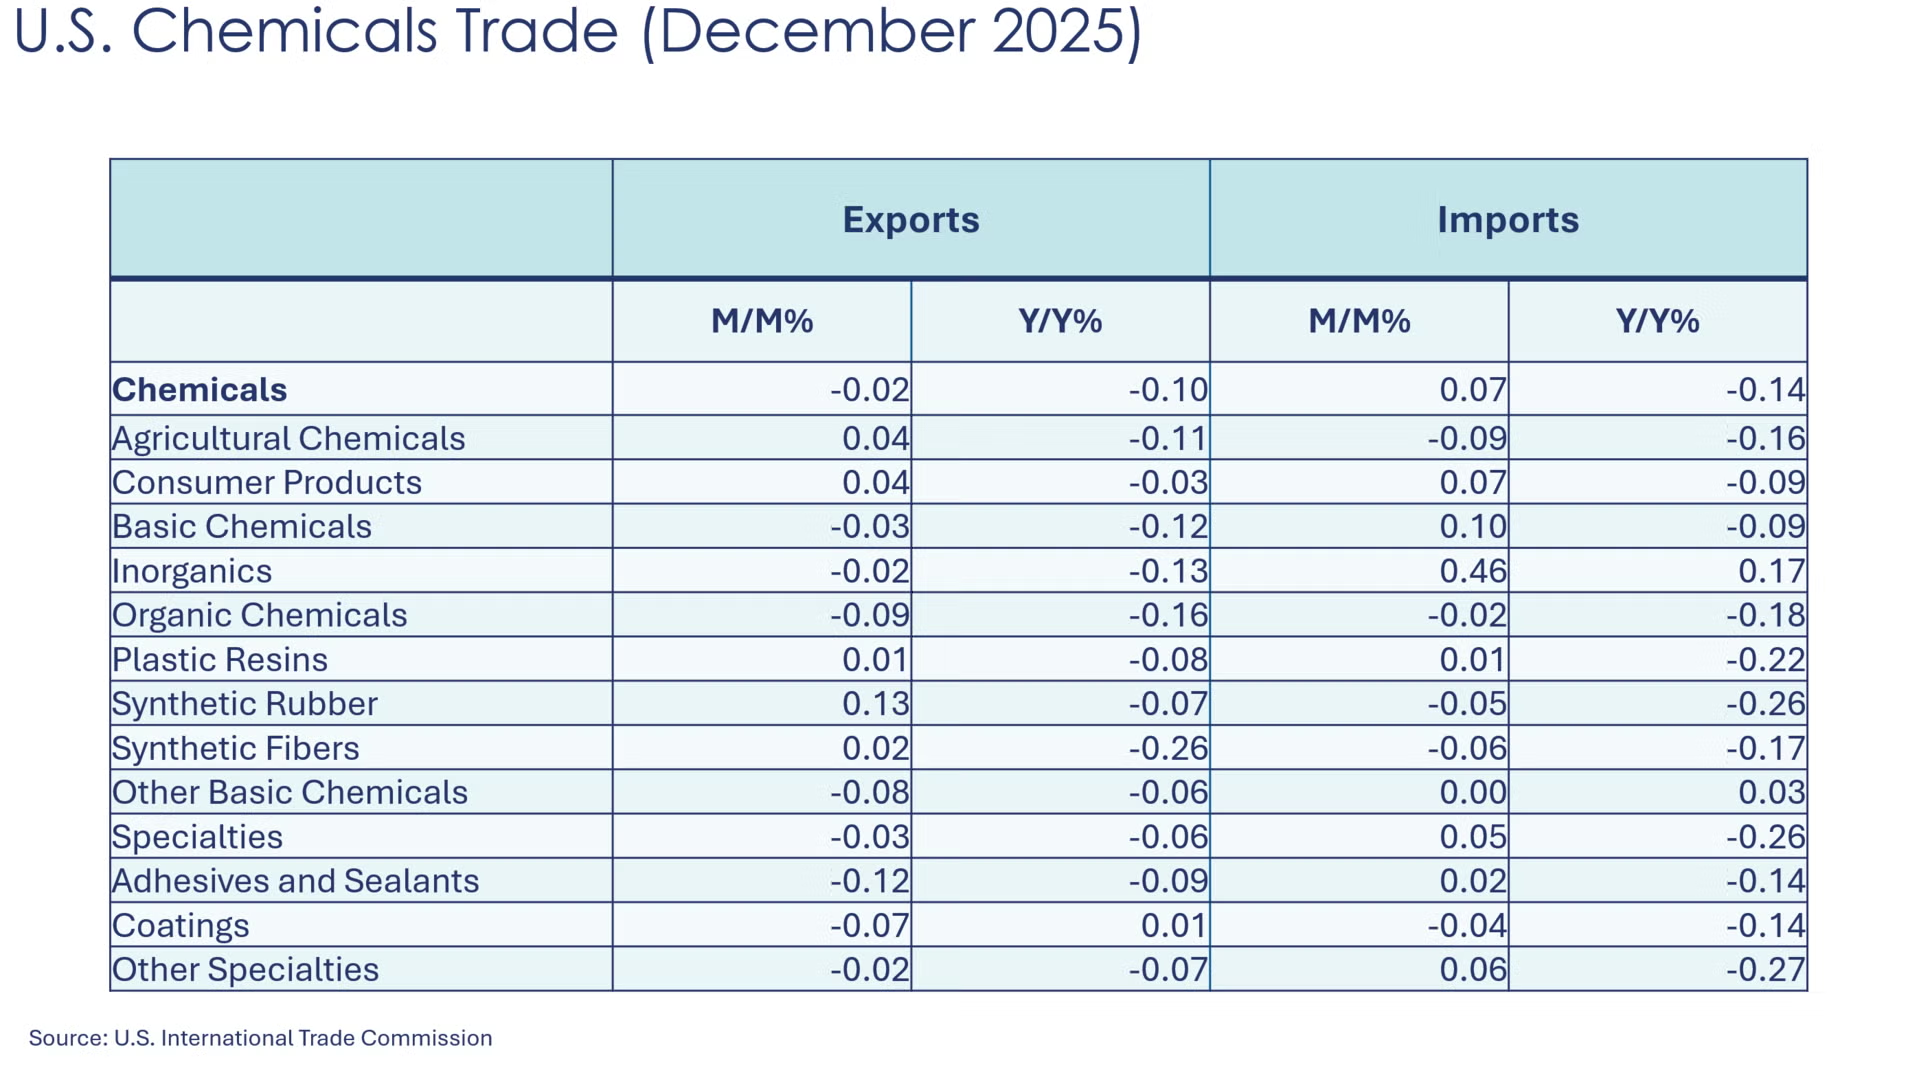
On the import side, following a sharp drop in November, U.S. chemical imports rebounded 6.5% in December, led by gains in consumer chemicals, basic chemicals, and specialties. It is also worth noting that after a sharp decline in November, inorganic chemical imports surged by 46.0% in December. Compared with the same month last year, total U.S. chemical imports decreased 13.9% with the annualized value dropping by 9.8%. With imports outpacing exports in December, the monthly trade balance narrowed from $3.8 billion dollars to $3.0 billion.
Despite the weaker December performance, resilient export activity over the past 12 months supported the broader trade position. As a result, the annual trade balance widened substantially, rising from $26 billion in 2024 to $34 billion in 2025.
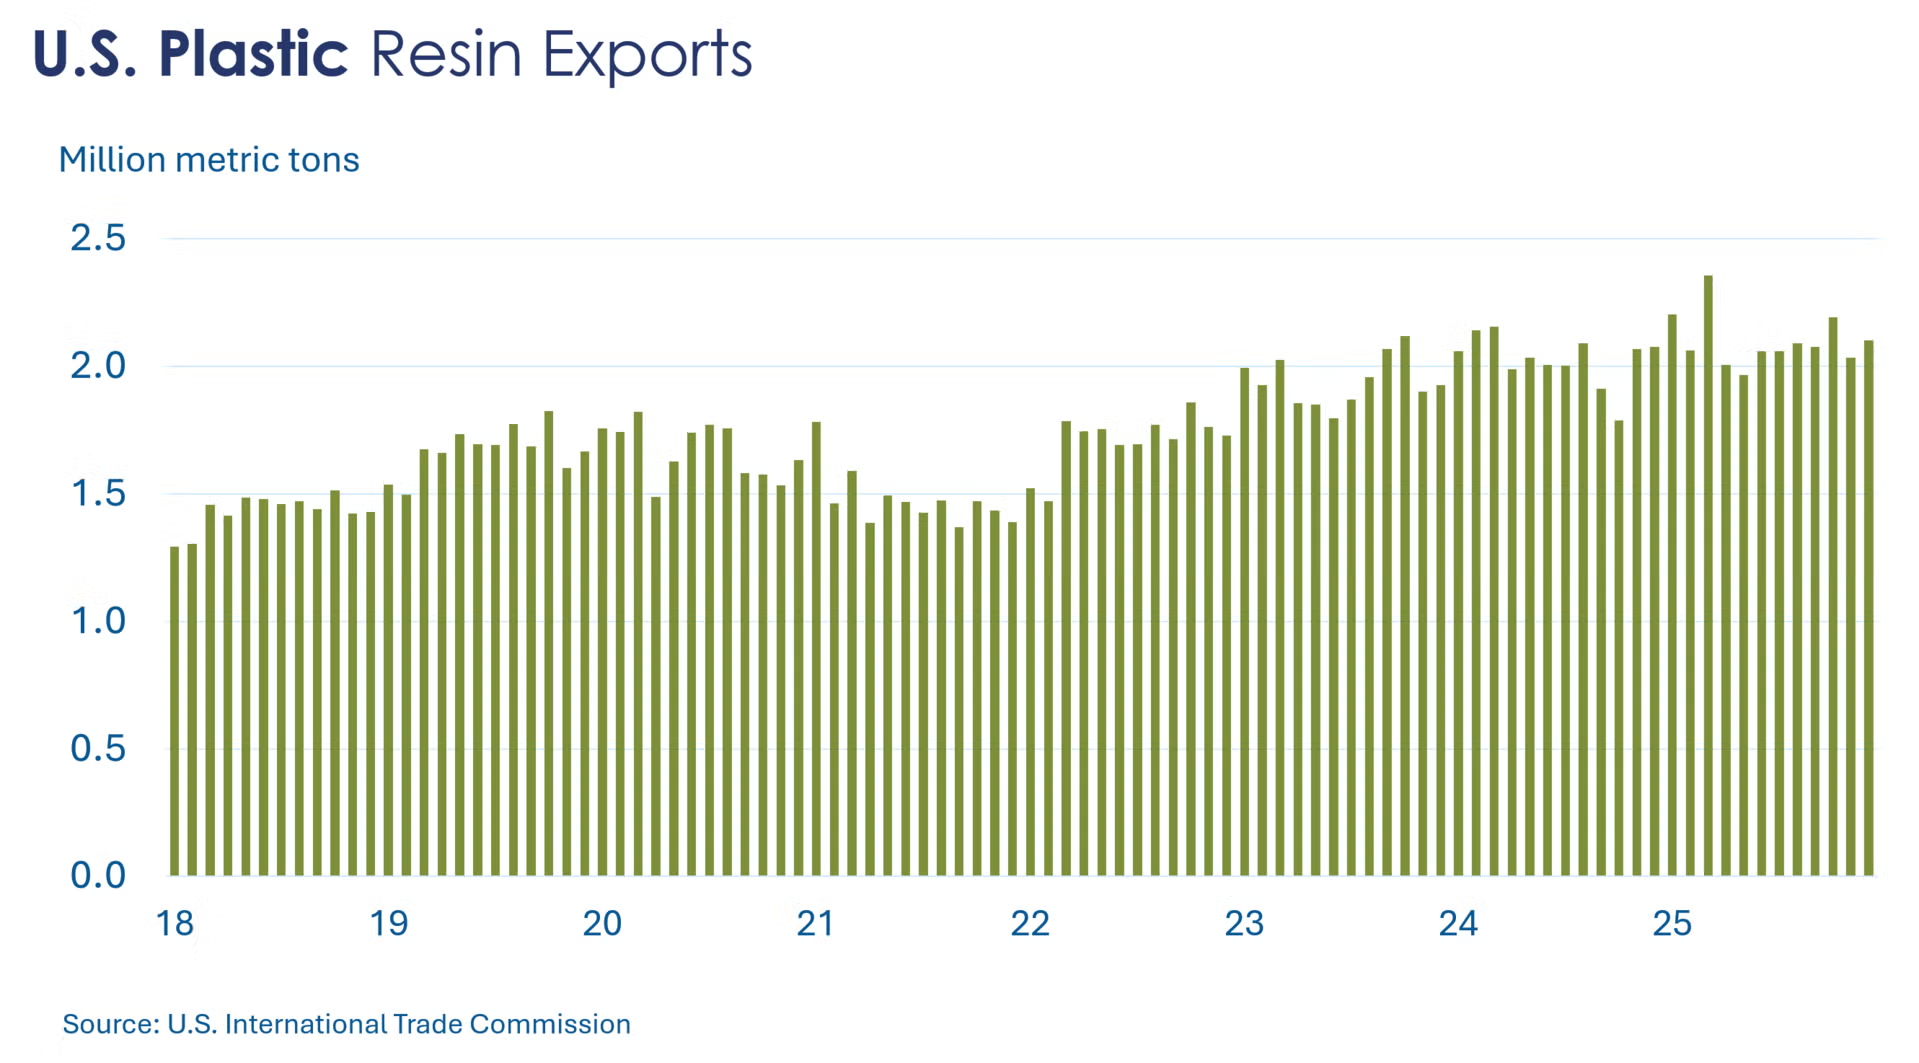
On a volume basis, U.S. plastic resin exports remained robust. Exports ended the year with an increase of 3.4% month -over month and 1.3% year-over-year. On an annual basis, resin exports were 3.7% higher compared to the level in 2024.
Energy Wrap-Up
• Oil prices hovered near seven-month highs as tensions rise before US-Iran discussions.
• U.S. natural gas prices ducked back below $3/mmbtu as heating season starts to wind down.
• The combined oil & gas rig count remained stable at 542.
For More Information
ACC members can access additional data, economic analyses, presentations, outlooks, and weekly economic updates through ACCexchange: https://accexchange.sharepoint.com/Economics/SitePages/Home.aspx
In addition to this weekly report, ACC offers numerous other economic data that cover worldwide production, trade, shipments, inventories, price indices, energy, employment, investment, R&D, EH&S, financial performance measures, macroeconomic data, plus much more. To order, visit http://store.americanchemistry.com/.
Every effort has been made in the preparation of this weekly report to provide the best available information and analysis. However, neither the American Chemistry Council, nor any of its employees, agents or other assigns makes any warranty, expressed or implied, or assumes any liability or responsibility for any use, or the results of such use, of any information or data disclosed in this material.
Contact us at ACC_EconomicsDepartment@americanchemistry.com.


