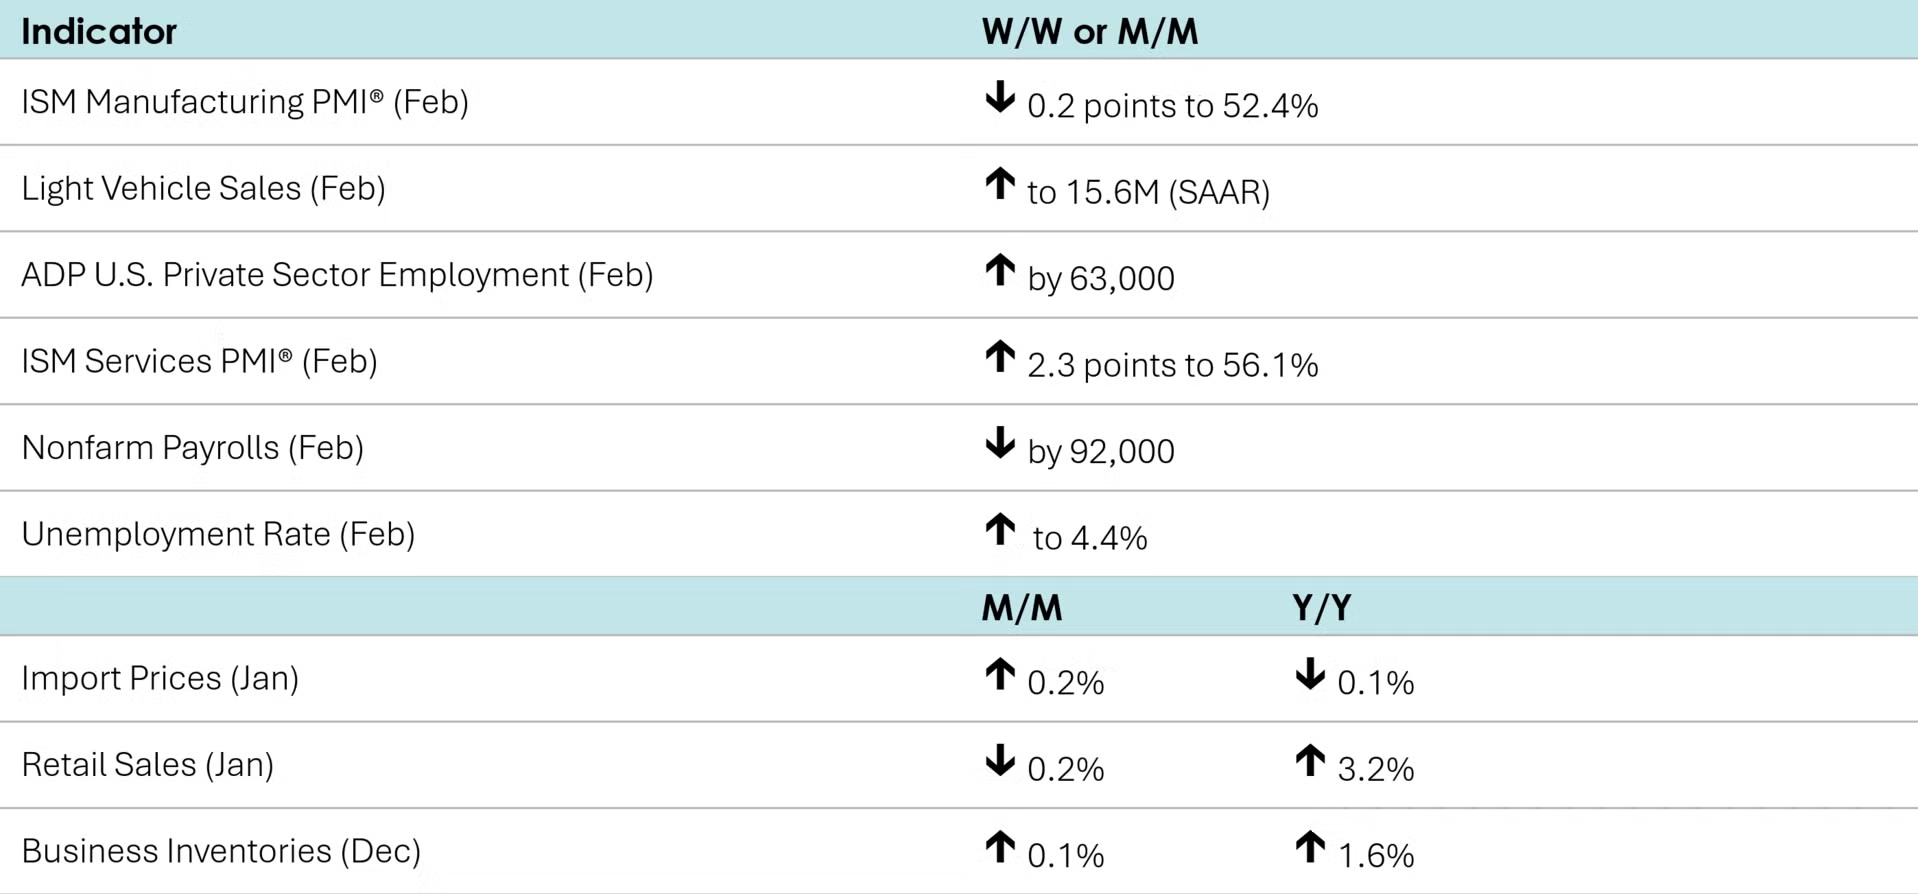
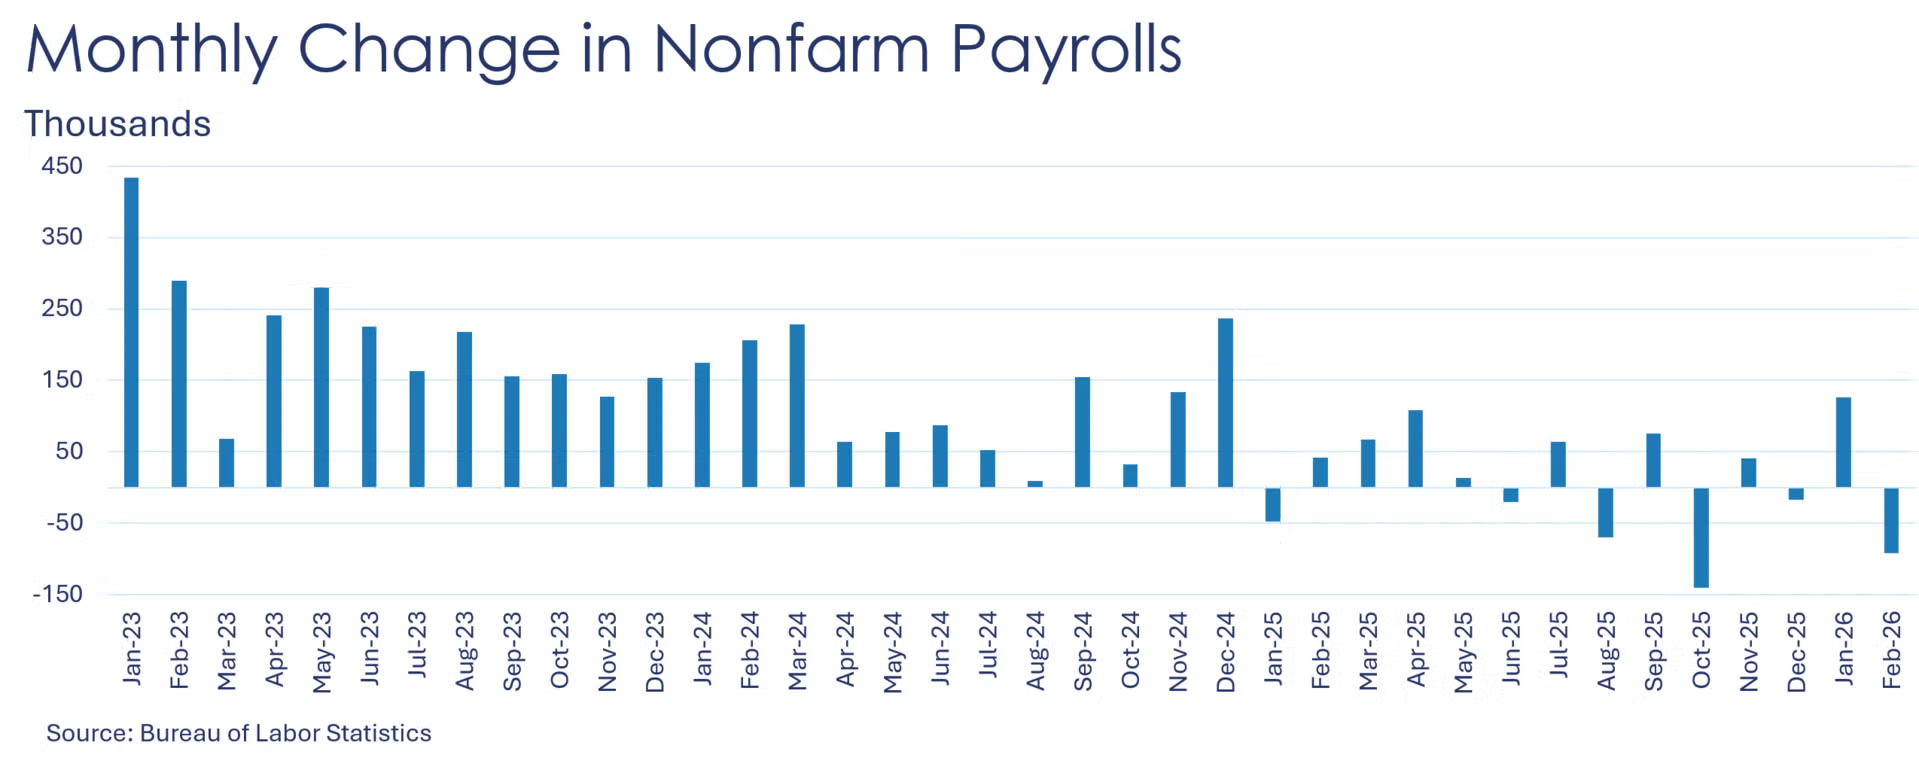
Nonfarm payrolls lost 92,000 in February after gaining 126,000 in January. Payrolls had been expected to increase. The February decline was influenced by a strike in the healthcare sector and unusually harsh weather. February’s is the second largest decline in payrolls since the beginning of 2025 (October payrolls shrank the most during that period, down 140,000). Besides healthcare, the largest job losses were seen in leisure and hospitality, manufacturing (down 12,000), transportation & warehousing, information, and construction. On the flip side, financial activities, other services, wholesale trade, retail trade, and utilities witnessed increases. Average hourly earnings were essentially steady at 3.8% Y/Y.
According to the separate household survey, the unemployment rate ticked higher to 4.4% in February from 4.3% the previous month. The labor force was essentially unchanged while the number of unemployed increased slightly. An alternative measure of unemployment, the U-6 (which includes a broader set of people that are working part-time or marginally attached to the labor force), dropped to 7.9% from 8.1% in January, the third consecutive monthly decline.
Contrasting the nonfarm payroll decline, private sector employment rose by 63,000 in February, the largest gain since July of last year, according to ADP’s employment report. Job increases were strongest in education & health services, construction, and information, while job losses were seen in professional & business services, manufacturing (down 5,000), and trade, transportation, & utilities. Large employers and small businesses added jobs while mid-sized businesses cut headcount.
U.S. businesses announced plans for just over 48,000 layoffs in February, down 72% from a year earlier and 55% from January, according to Challenger, Gray & Christmas, an executive staffing firm. The industries with the highest announced layoffs include technology, education, industrial manufacturing, transportation, healthcare, and media.
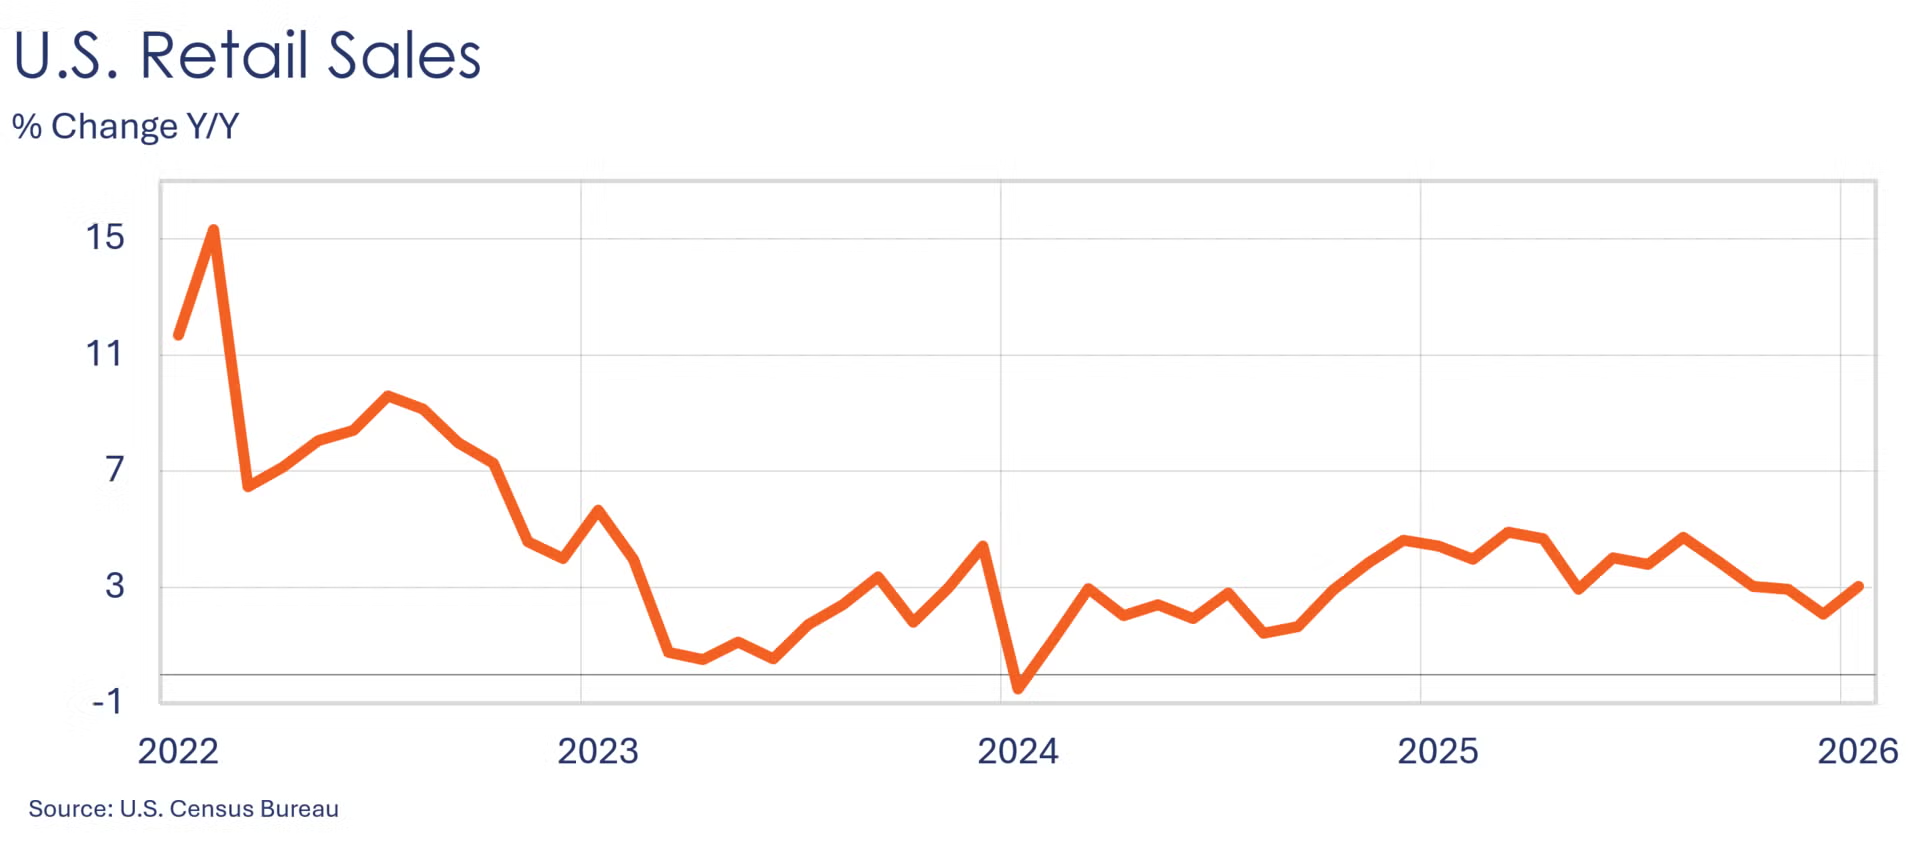
Retail sales were down 0.2% in January after being flat the prior month. Sales of health and personal care products, gasoline, clothing, sporting goods, motor vehicles & parts, electronics & appliances, and restaurants declined. On the other hand, sales at miscellaneous store retailers, online platforms, as well as at stores selling furniture, building materials & garden equipment, and general merchandise edged up. Compared to a year ago, retail sales rose 3.2% Y/Y, up from a 2.4% Y/Y clip in December.
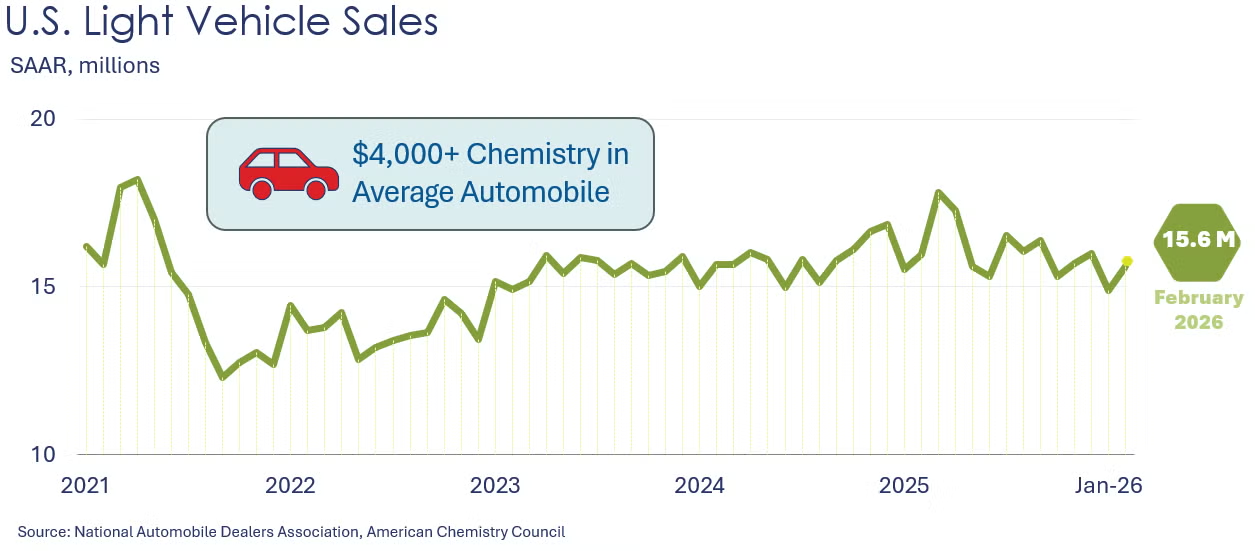
After falling in January, light vehicle sales recovered some ground by rising to 15.6 million seasonally adjusted annual pace in February, still below the 16.0-million pace registered in December.

The ISM Manufacturing PMI® dipped 0.2 points in February to 52.4, the second month of expansion (i.e., above 50) in a row. New orders and production grew at a slower pace while order backlogs and export orders increased at a faster clip. Supplier deliveries slowed at a faster rate, suggesting increasing demand continued to stretch supplier capacity. Inventories contracted while customers’ inventories were deemed “too low”, both at a slower rate than the previous month. Employment continued to contract (albeit at a slower rate) as imports rose. Twelve industries, including chemicals, reported expansions while five reported contractions.
The ISM Services PMI® gained 2.3 points to 56.1, above the 50-point growth borderline for the 20th straight month. Business activity/production, new orders, and employment grew faster, while inventories, backlog of orders, export orders, and imports switched from contracting to growing. Supplier deliveries slowed as prices increased at a softer pace.
Looking abroad, the JP Morgan Global Manufacturing PMI rose 1.0 points to 51.9 in February, its highest reading in more than 3-1/2 years. Output and new orders strengthened, but input prices accelerated.
Combined business inventories rose 0.1% in December, with similar gains in wholesale, manufacturing, and retailer stocks. Combined business sales rose 0.5%, with wholesale and manufacturing sales increasing while retailer sales remaining unchanged. The inventories-to-sales ratio dipped to 1.36 from 1.37 in November. A year earlier, the ratio was 1.39.
Import prices (which exclude tariffs) rose 0.2% in January while export prices increased 0.6%. Compared to last year, import prices dipped 0.1% while export prices grew 2.6%.
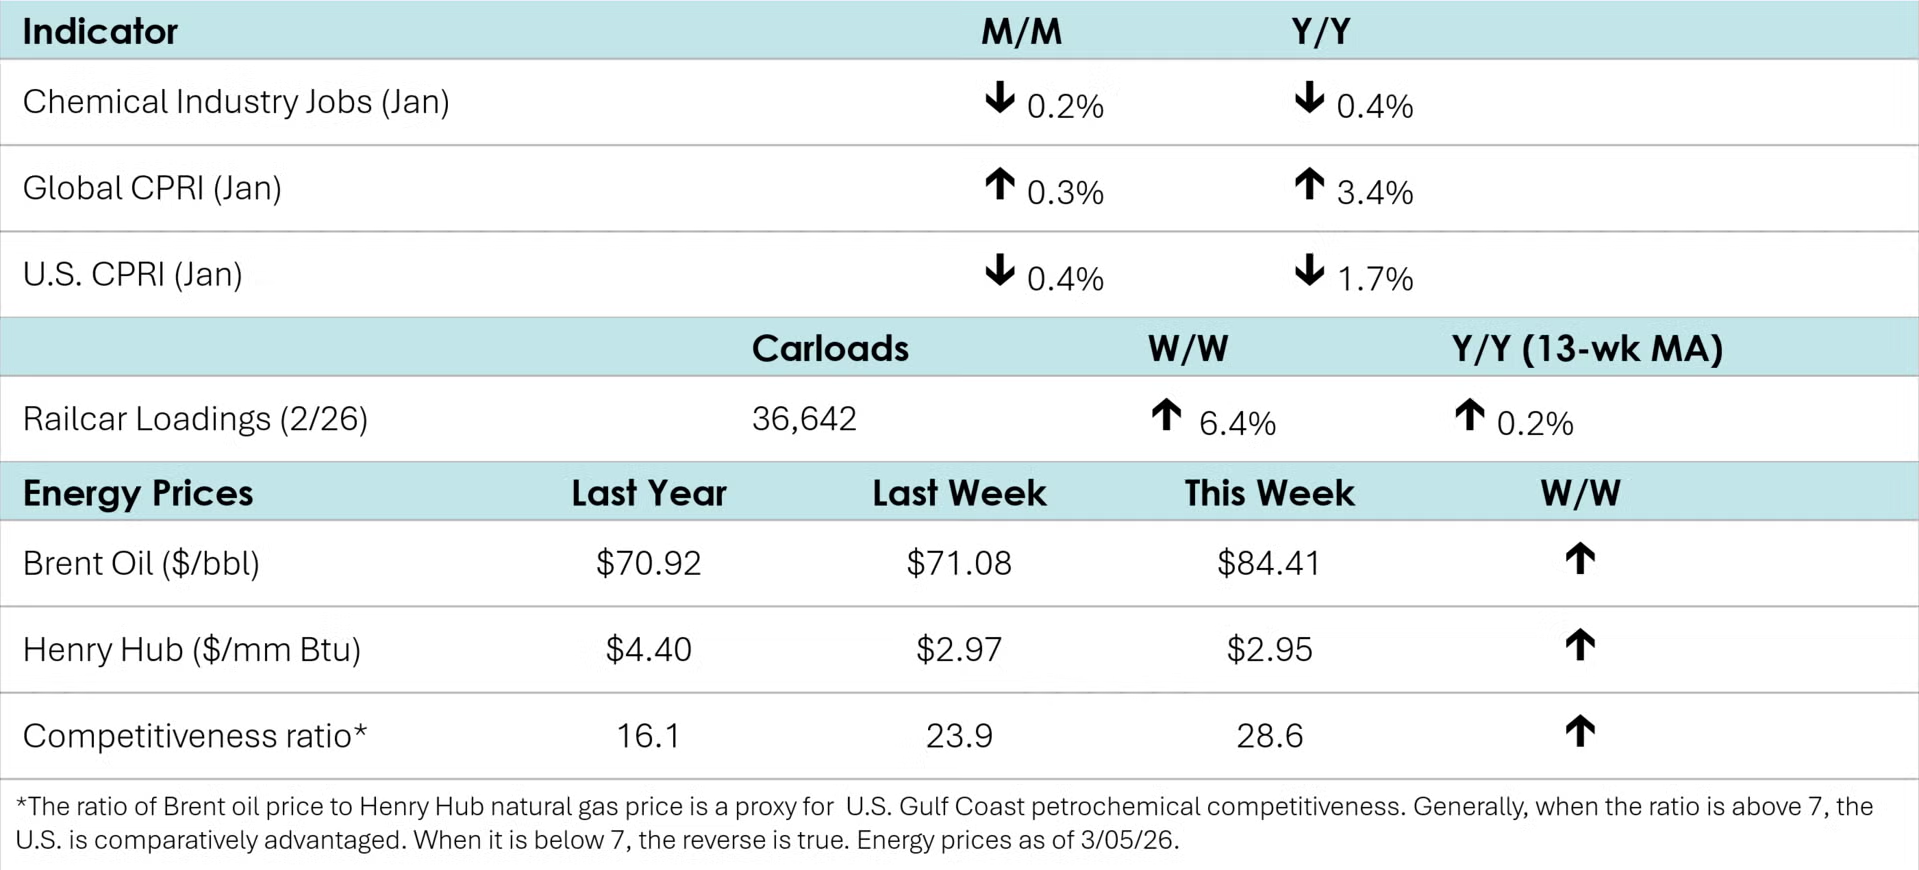
According to data released by the Association of American Railroads, chemical railcar loadings rose to 36,642 for the week ending February 28th, the highest level since the end of April 2025. Loadings were up 0.2% Y/Y (13-week MA) and up 2.9% YTD.
Chemical industry employment totaled 543,400 in January, down 0.2% after losing 0.5% in December. Compared to a year ago, employment was off 0.4% Y/Y. Employment in plastic resin manufacturing also eased in January, down 0.7% to 59,300, a level 0.3% higher than the previous year. (Note that data at the detailed industry level are lagged one month behind the headline jobs report.)
In February, combined chemical and pharmaceutical jobs increased by 1,000 to 900,500, up 2,300 from a year earlier. An increase in supervisory & non-production workers offset a decline in production workers. Average hourly earnings for production workers rose 0.7% from a year ago to $32.02. The average workweek for production workers was unchanged at 42.3 hours in February.
Within the details of the ISM Manufacturing PMI® report, the chemical industry was reported to be in expansion in February. One chemical industry respondent noted, “Economic activity seems to be also challenging for this year. Some recovery in certain sectors in the economy but still lot[s] of cost pressures and soft demand. Cost discipline is the priority.” Another stated, “January sales continued to provide positive indications for growth opportunities. Data center, health care, and food and beverages remain positive growth areas. We continue to receive price increase notifications from suppliers based on unsupported tariff claims and are expanding corporate staff to support sales growth.” The chemical industry reported expansions in new orders, production, backlog of orders, export orders, imports, and inventories. Chemical employment contracted while supplier deliveries slowed and customer inventories were deemed “too low” as prices increased.
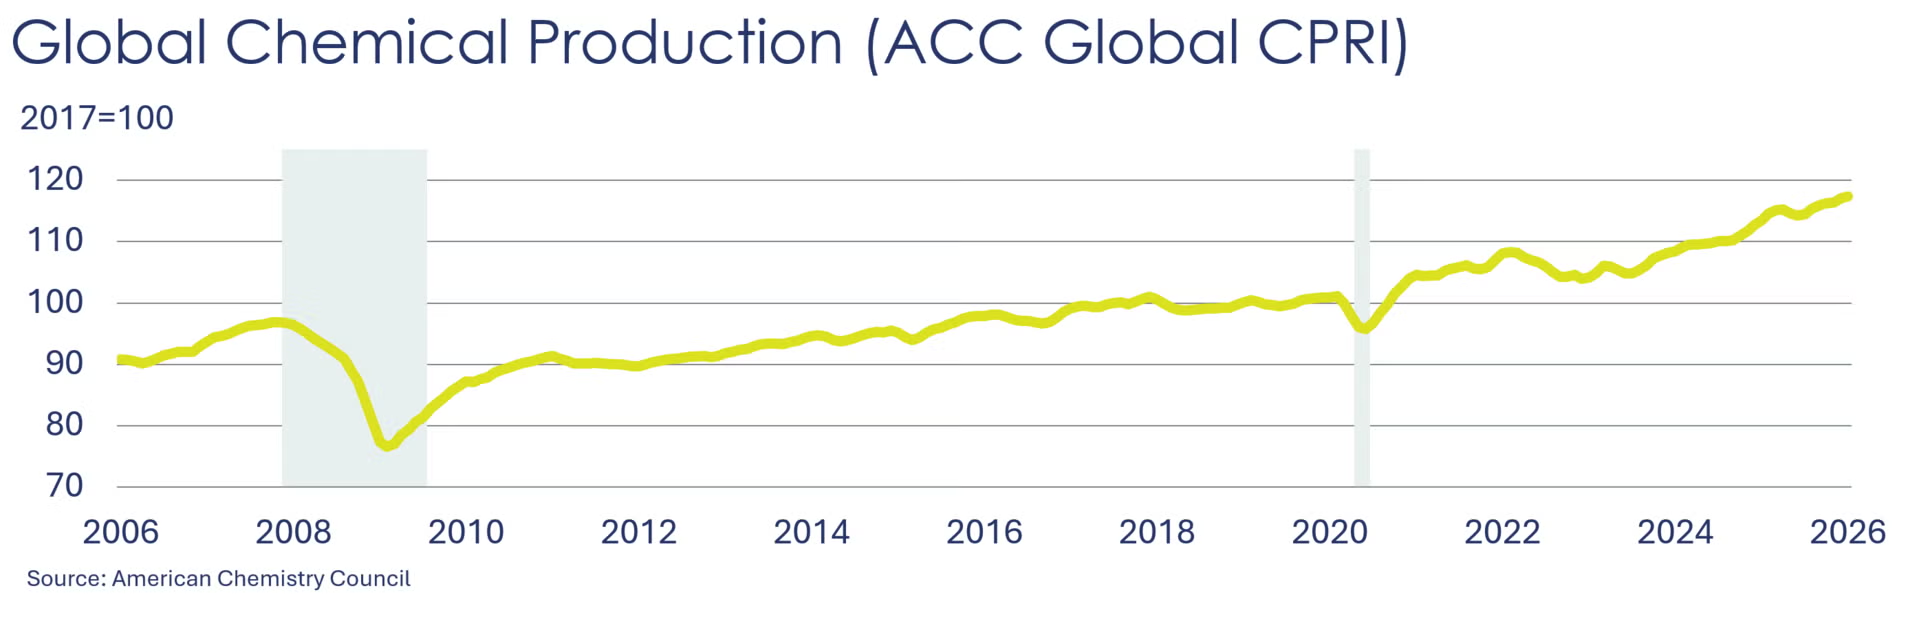
Global chemical production began 2026 with a 0.3% increase, according to ACC’s Global Chemical Production Regional Index (Global CPRI). Growth was driven by the Asia Pacific, Middle East & Africa, and Europe regions, while North America, South America, and the Former Soviet Union saw declines. Korea posted the strongest performance, with output rising 4.0%, and all major chemical segments expanded. On a year‑over‑year basis, global chemical production rose 3.4% in January 2026.
For more details, check out our new CPRI Dashboard.
Following a 1.0% drop in December, the U.S. CPRI started 2026 with another 0.4% decline. This index measures chemical production trends based on a three-month moving average to smooth out month-to-month volatility. Production declined in all regions. Overall, the U.S. CPRI was 1.7% lower than it was a year ago.
Energy Wrap-Up
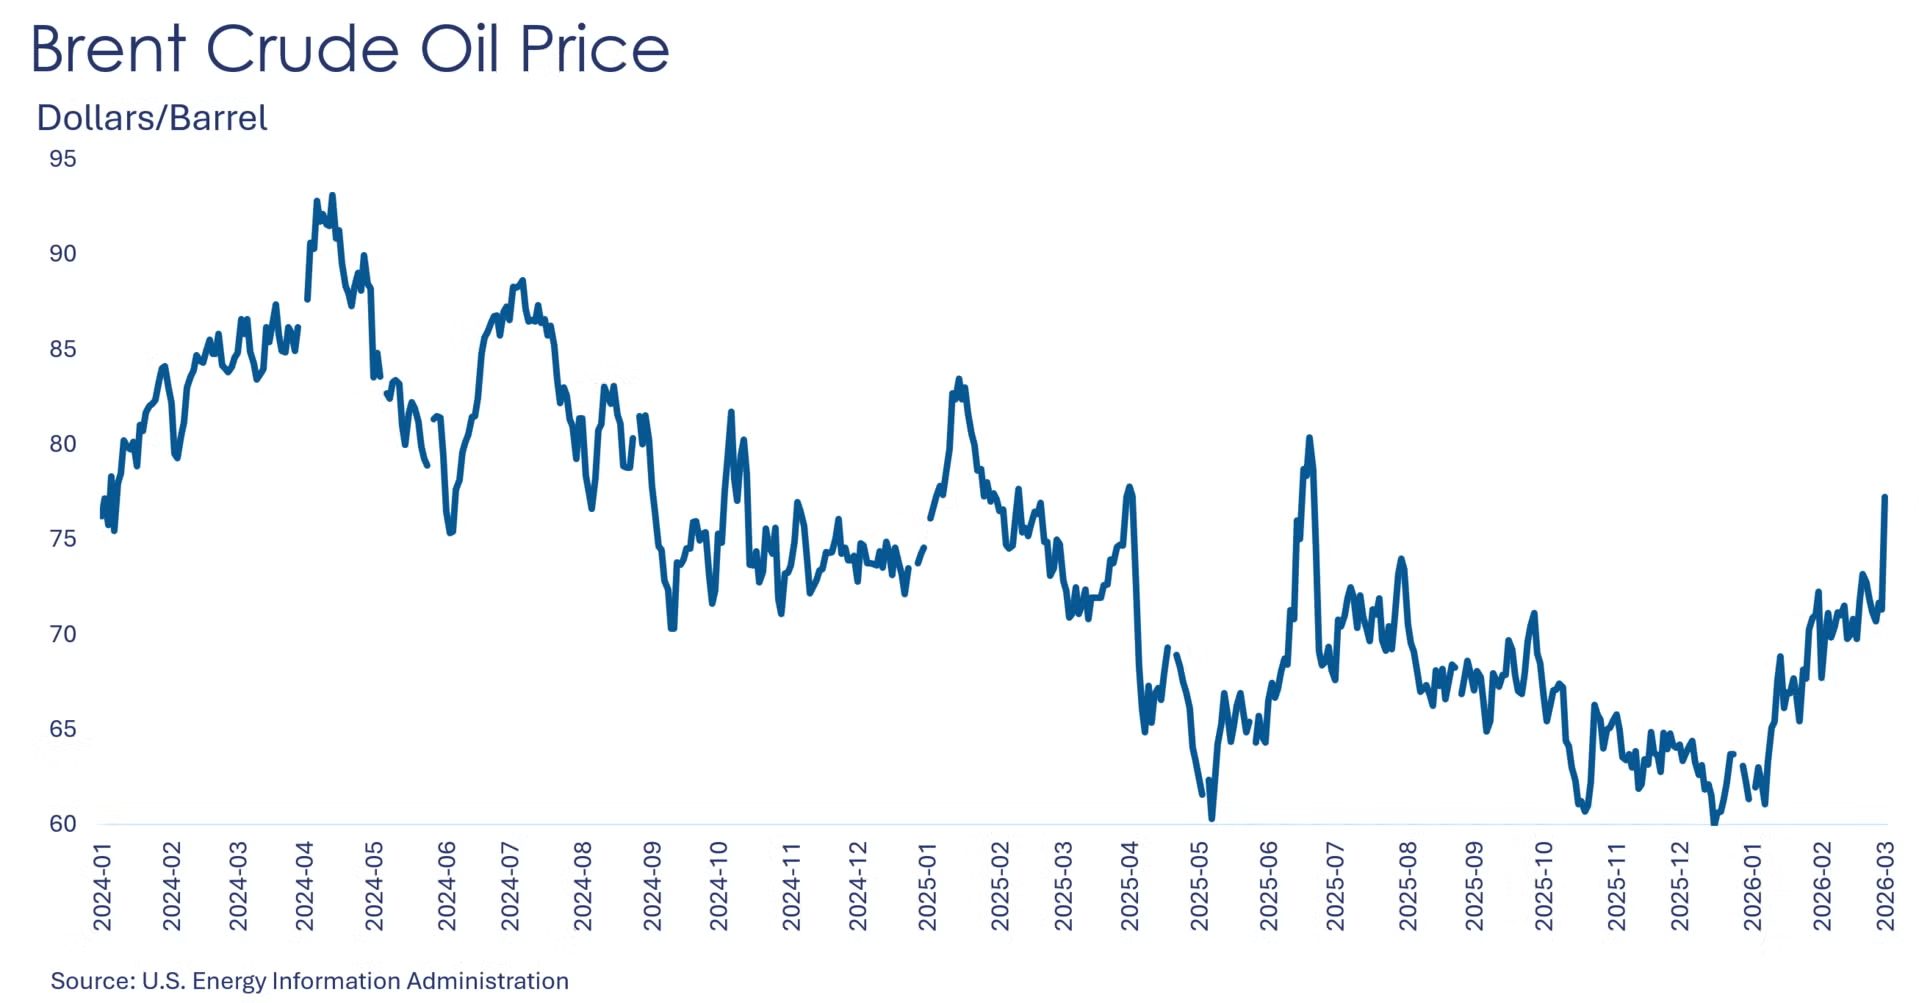
• Oil prices were up sharply following the widening conflict in the Middle East and an effective closure of the Strait of Hormuz.
• U.S. natural gas prices moved slightly higher but remained under $3/mmbtu. Inventories were ahead of last year at this time and are only slightly lower than the five-year historical average.
• The combined oil & gas rig count fell by one to 541.
For More Information
ACC members can access additional data, economic analyses, presentations, outlooks, and weekly economic updates through ACCexchange: https://accexchange.sharepoint.com/Economics/SitePages/Home.aspx
In addition to this weekly report, ACC offers numerous other economic data that cover worldwide production, trade, shipments, inventories, price indices, energy, employment, investment, R&D, EH&S, financial performance measures, macroeconomic data, plus much more. To order, visit http://store.americanchemistry.com/.
Every effort has been made in the preparation of this weekly report to provide the best available information and analysis. However, neither the American Chemistry Council, nor any of its employees, agents or other assigns makes any warranty, expressed or implied, or assumes any liability or responsibility for any use, or the results of such use, of any information or data disclosed in this material.
Contact us at ACC_EconomicsDepartment@americanchemistry.com.


