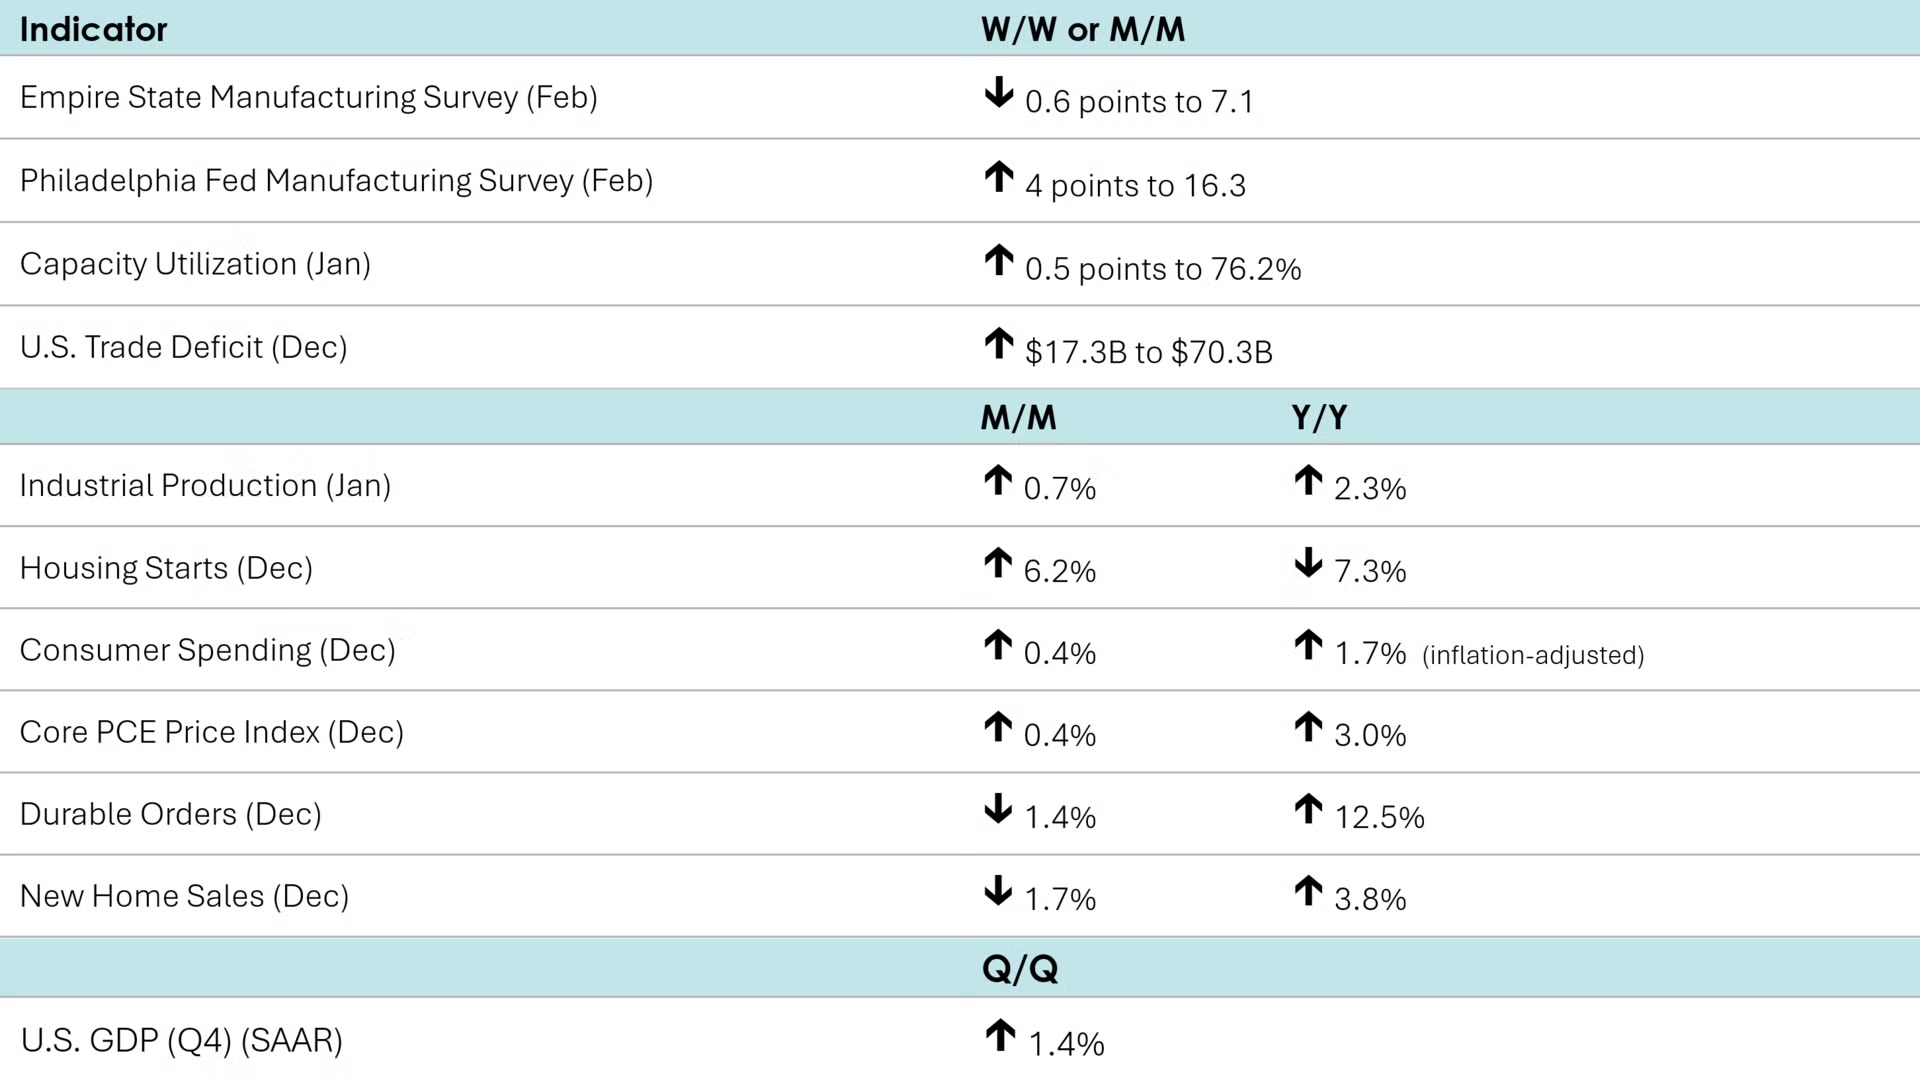
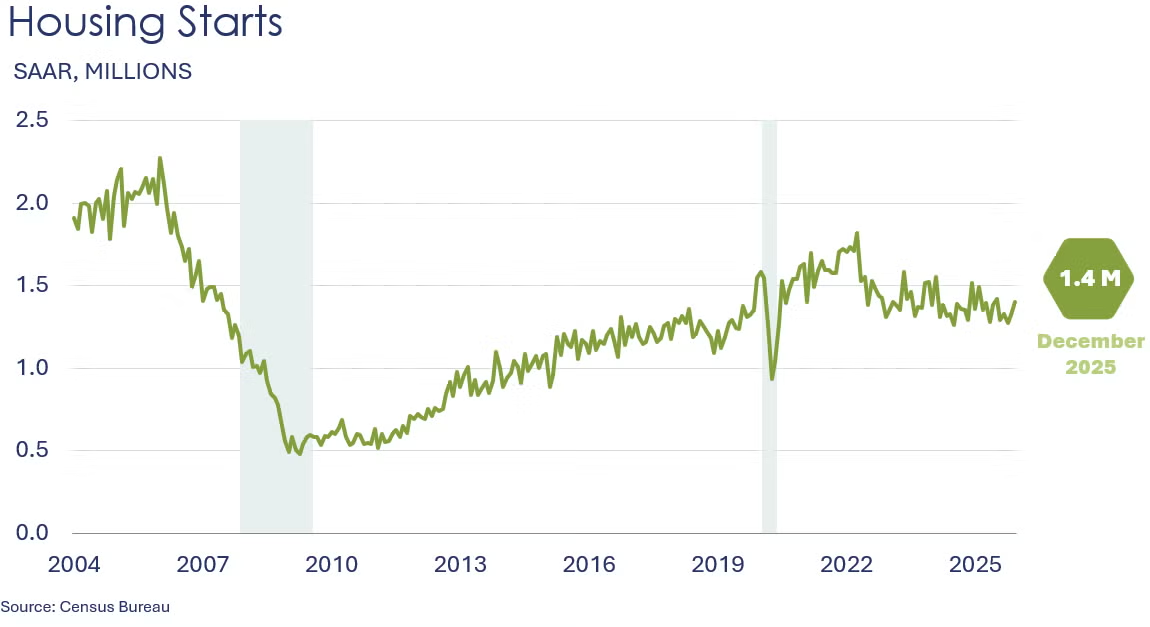
Headline housing starts rose 6.2% in December to 1.4 million units’ annual pace. Chemistry-intensive single-family starts increased 4.1%, with gains in all the regions except for the Midwest; the West rose the most, jumping 24.7%. Forward-looking building permits advanced 4.3% in December. All the regions saw gains in permits except for the South; permits in the Northeast zoomed 44.4%. Compared to a year ago, housing starts were down 7.3% Y/Y while building permits were off by 2.2% Y/Y.
New home sales dropped 1.7% in December after jumping 15.5% in November. December sales dropped in the Northeast and the South while rising in the Midwest and the West. Home sales grew 3.8% Y/Y. Inventories dropped from November and from a year ago. At the current sales pace, inventories represent a 7.6-month supply, down from November and below 8.2 months a year earlier. The median sales price was $414,400, off 2.0% Y/Y and down 10.0% from the median price in October 2022 where it reached an all-time high of $460,300.
NAHB/Wells Fargo homebuilder confidence fell for a second straight month in February, down 1 point to 36. This below-50 reading suggests that homebuilders are increasingly concerned about prospects for the market for newly built single-family homes. While the current sales activity component remained stable, there was deterioration in sales expectations and prospective buyer traffic.
A leading indicator of nonresidential building activity, the AIA/Deltek Architectural Billings Index® slipped by 3.3 points in January to 43.8, a level that indicates a greater number of firms experienced a decline in billings compared to December. Newly signed design contracts declined and inquiries about new projects fell for the first time since April 2025.
Industrial production expanded for a third month in January, up by 0.7%. A strong gain in utility output and a lesser increase in manufacturing production offset slightly lower output from the mining sector. Within manufacturing, the largest gains were in nonmetallic mineral products, plastics & rubber, motor vehicles & parts, machinery, and chemicals & pharmaceuticals. The largest declines were in apparel, food & beverages, and textiles. Overall industrial production was up 2.3% Y/Y, with manufacturing output rising 2.4%. Capacity utilization rose 0.5 points to 76.2%, its highest reading since July. However, capacity utilization remains well below its long-term average of 79.5%.
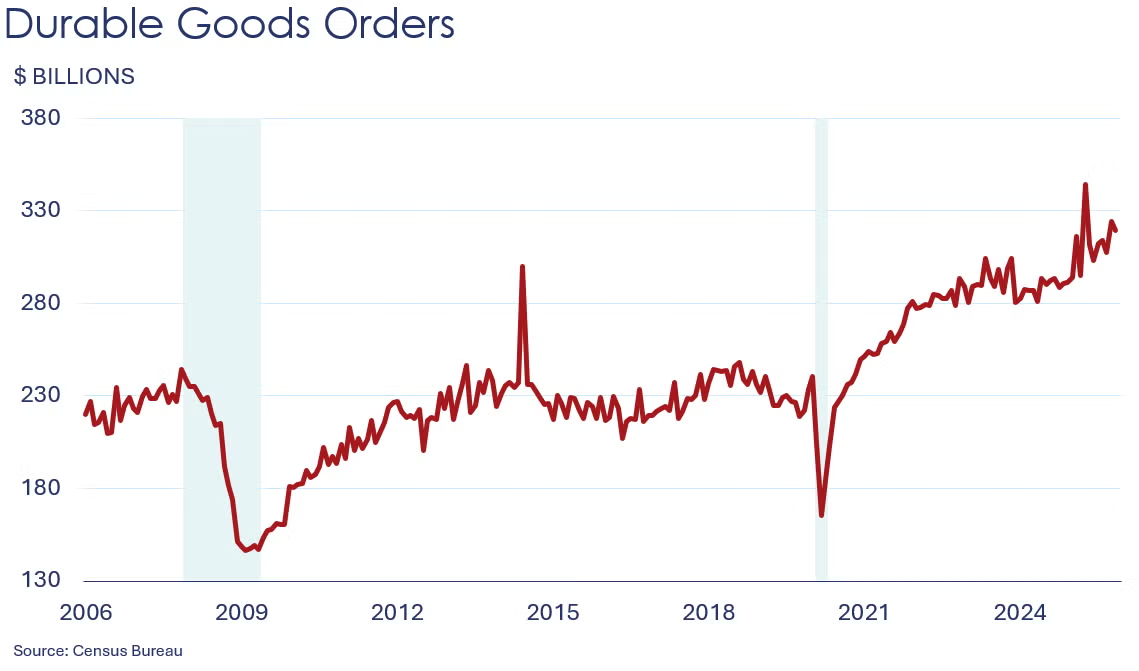
Durable goods orders fell 1.4% in December, closing out a volatile year. Gains across most major durable manufacturing sectors rose at the end of the year but were offset by a steep decline in the notorious civilian aircraft category which nearly doubled in November. Core business orders (nondefense capital goods excluding aircraft) continued to expand, up 0.6%. Compared to a year ago, orders were up 12.5% Y/Y while core orders were up 7.5% Y/Y.
Manufacturing expanded modestly in February in New York State, according to the Empire State Manufacturing Survey which essentially held steady at 7.1, the fourth positive reading since October of last year. New orders and unfilled orders rose as delivery times were slightly longer. Employment increased somewhat after shrinking in January. Price increases accelerated while capital spending plans improved.
Manufacturing activity in the Philadelphia region also expanded in February, according to the Philadelphia Fed’s Manufacturing Outlook Survey. The general activity index increased 4 points to 16.3, the second straight increase and highest level since September. New orders also increased while shipments were virtually flat. The employment index entered negative territory as prices continued to rise.
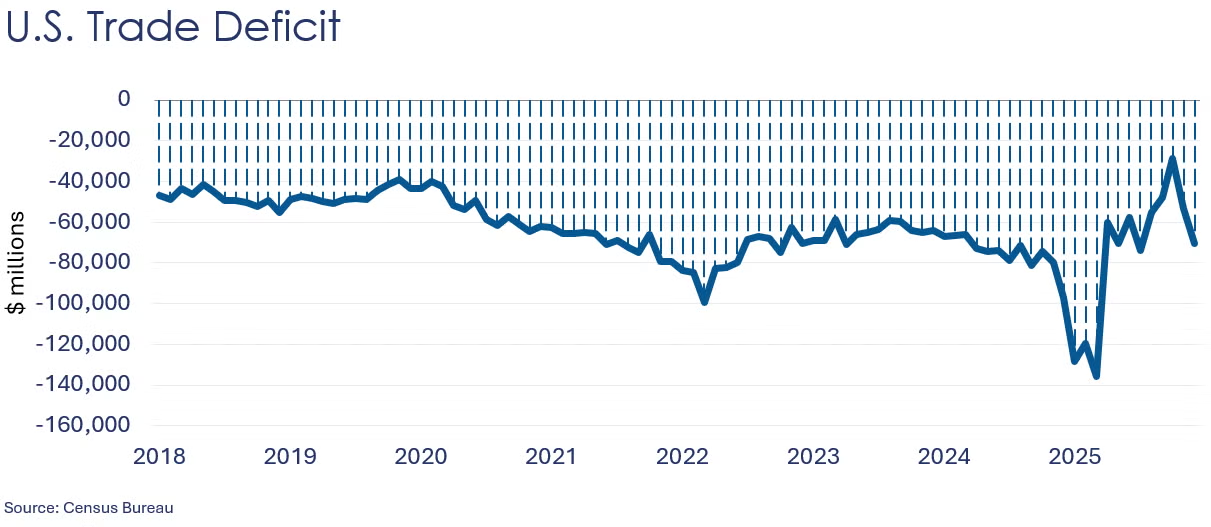
U.S. trade deficit rose by $17.3 billion in December to $70.3 billion. The deficit increase reflected a drop of 1.7% in exports versus growth of 3.6% in imports. Exports of industrial supplies & materials such as nonmonetary gold declined. On the flip side, exports of capital goods (semiconductors) and consumer goods (pharmaceuticals) increased. Concurrently, imports of industrial supplies and materials (nonmonetary gold, copper, & crude oil) and capital goods (computer accessories & telecom equipment) increased, while imports of consumer goods (pharmaceuticals) declined.
BEA’s preliminary estimate of Q4 GDP shows an increase of 1.4% seasonally adjusted annual rate (SAAR), down from 4.4% in the third quarter and the lowest reading since Q1 2025. Increases in consumer spending and investment offset declines in government spending and net exports. Real final sales to domestic purchasers, which strips out government, net exports, and inventories, rose 2.4%, down from 2.9% in Q3.
Consumer spending expanded by 0.4% in December, finishing off a better than expected year for household expenditures. December’s gain was led by an increase in spending on services. Spending on nondurable goods was essentially flat while spending on long-lasting durable goods (including motor vehicles) fell. After adjusting for inflation, real consumer spending was up 1.7% from a year ago. The Fed’s preferred inflation measure, the price index for personal consumption expenditures (PCE) was up 2.9% Y/Y and excluding food and energy, the core PCE price index was up 3.0% Y/Y. Both measures were higher than in November and further from the Fed’s 2% target.
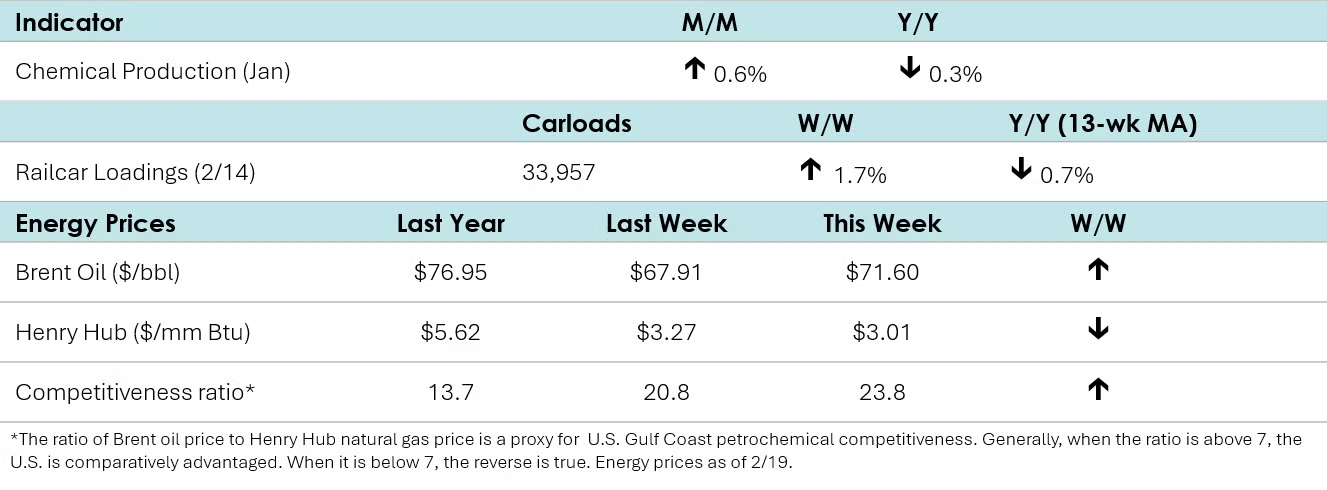
According to data released by the Association of American Railroads, chemical railcar loadings rose to 33,957 for the week ending February 14th. Loadings were down 0.7% Y/Y (13-week MA) but up 1.9% YTD.
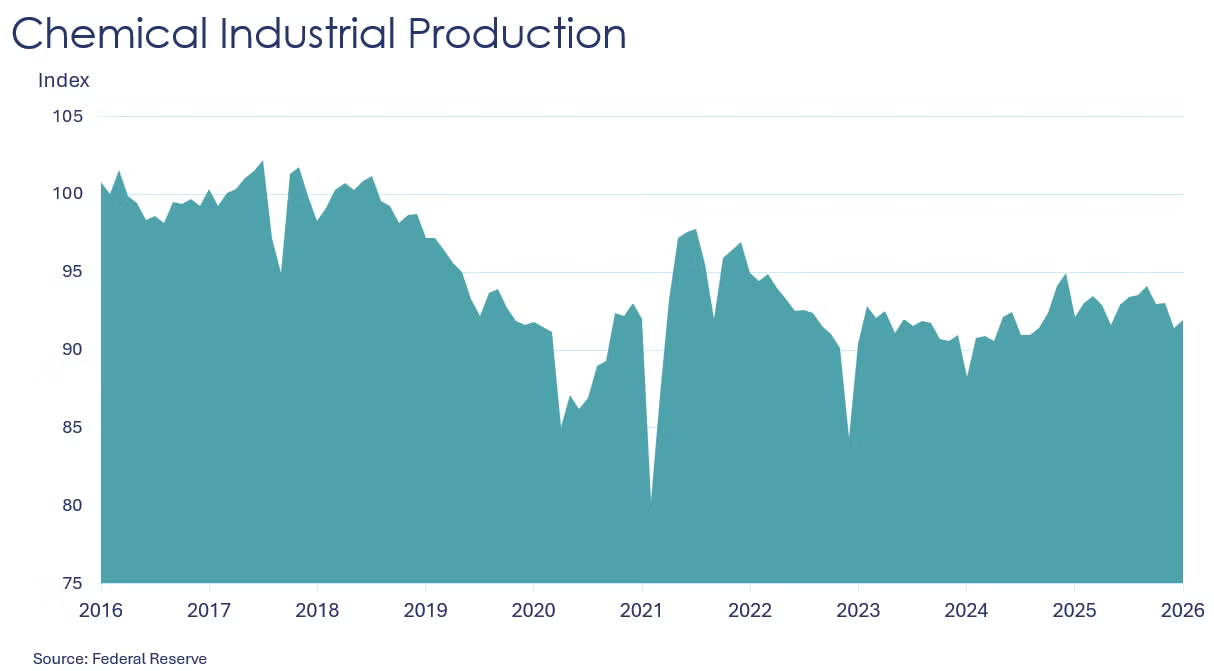
Chemical production gained 0.6% in January, partially recovering from a 1.7% loss in December and a flat reading in November. The largest increases were seen in agricultural chemicals (including pesticides) and consumer products, while organic chemicals, plastic resins, synthetic fibers, and manufactured fibers saw smaller gains. On the other hand, other specialties, synthetic dye & pigment, industrial gases, and basic inorganic chemicals witnessed declines. Compared to a year ago, chemical production was down 0.3% Y/Y. With the revised December data, chemical production was up 1.3% in 2025 compared to 2024.
Chemical capacity utilization tightened in January to 80.0%.
Energy Wrap-Up
• Oil prices moved higher to a six-month high on increasing concerns of U.S. military action in Iran and a better-than-expected report on U.S. industrial production.
• U.S. natural gas prices continued to move lower on a warmer forecast.
• The combined oil & gas rig count remained stable at 542
For More Information
ACC members can access additional data, economic analyses, presentations, outlooks, and weekly economic updates through ACCexchange: https://accexchange.sharepoint.com/Economics/SitePages/Home.aspx
In addition to this weekly report, ACC offers numerous other economic data that cover worldwide production, trade, shipments, inventories, price indices, energy, employment, investment, R&D, EH&S, financial performance measures, macroeconomic data, plus much more. To order, visit http://store.americanchemistry.com/.
Every effort has been made in the preparation of this weekly report to provide the best available information and analysis. However, neither the American Chemistry Council, nor any of its employees, agents or other assigns makes any warranty, expressed or implied, or assumes any liability or responsibility for any use, or the results of such use, of any information or data disclosed in this material.
Contact us at ACC_EconomicsDepartment@americanchemistry.com.


