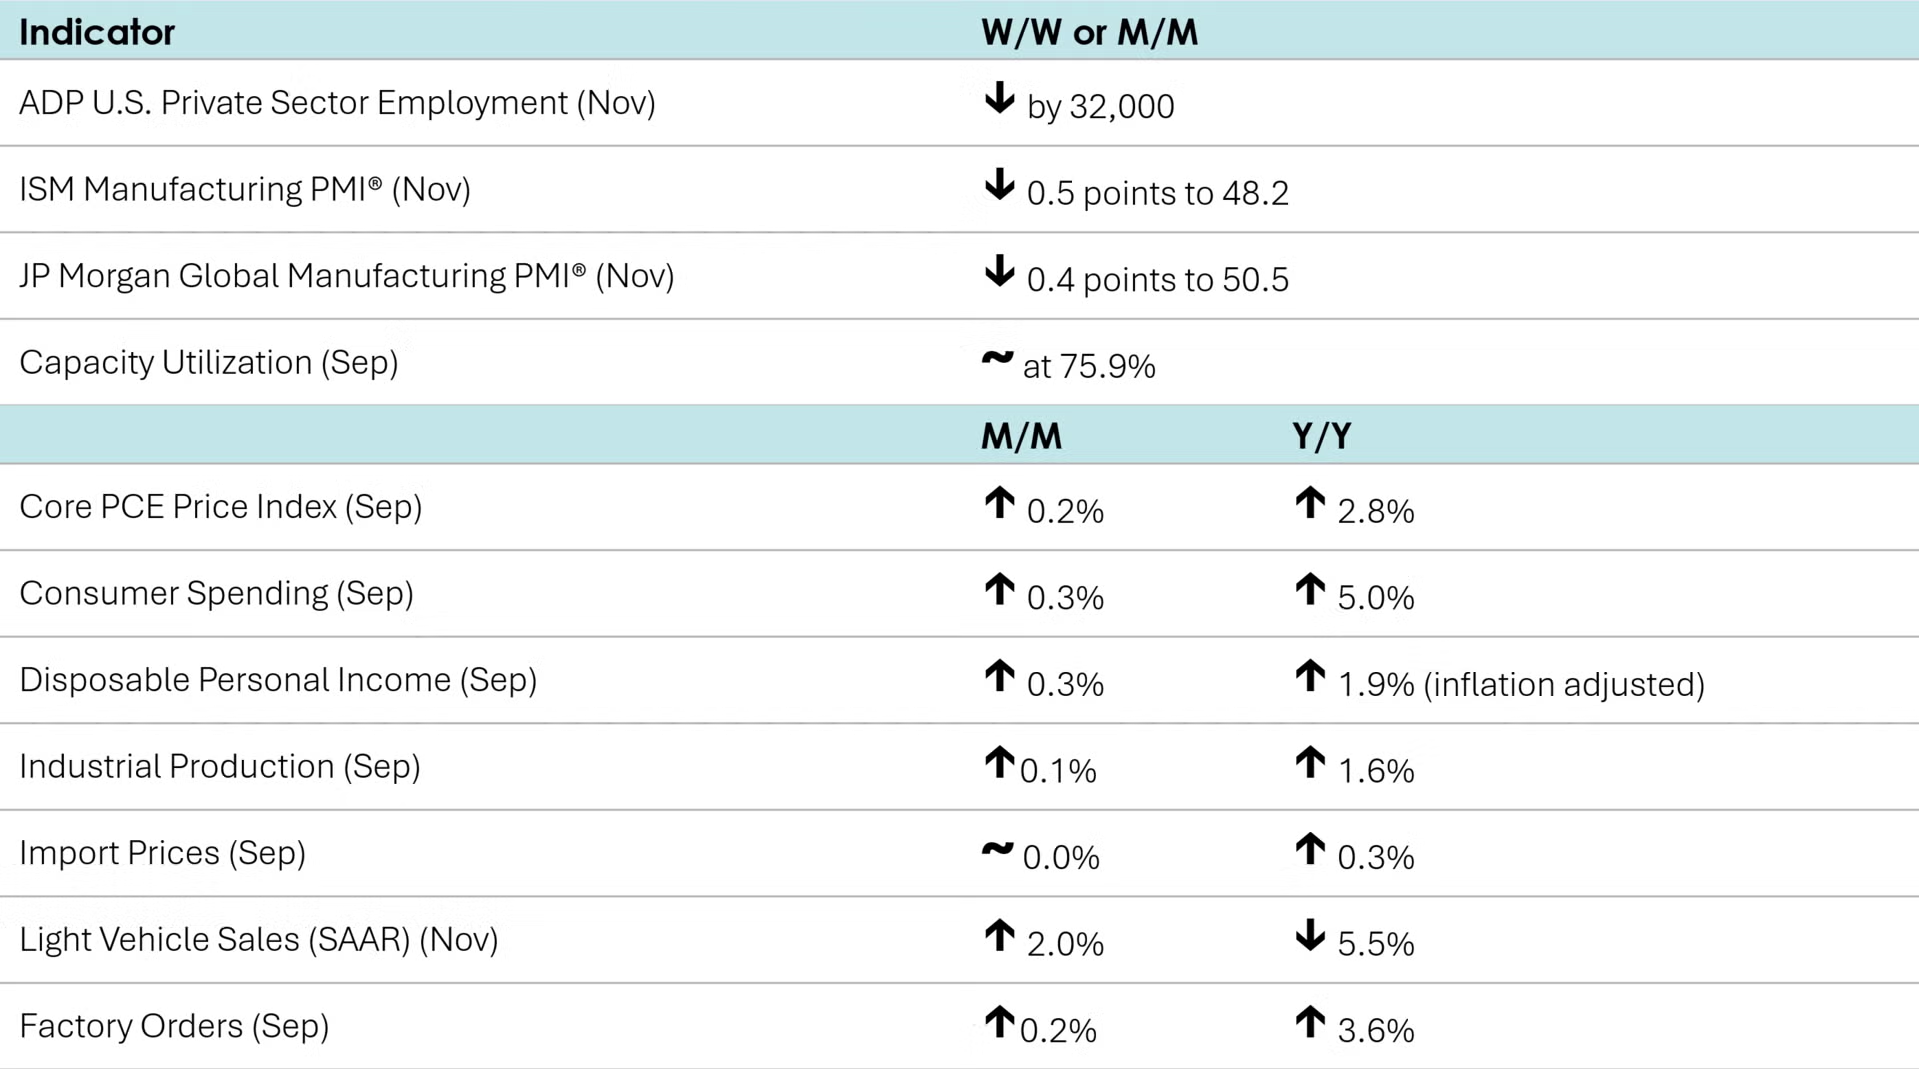
Consumer spending rose 0.3% in September, led by higher spending on gasoline, housing, health care, financial services & insurance, and food services. Disposable personal income also rose, up by 0.3%, driven by higher employee compensation and personal income receipts on assets such as stock dividends and real estate rents. The savings rate was 4.7%, the same as in August and the lowest since December 2024. Compared to a year ago, inflation-adjusted consumer spending was up 2.1% Y/Y while income was 1.9% Y/Y higher.
The headline personal consumption expenditures (PCE) price index rose 2.8% Y/Y in September, up from 2.7% Y/Y in August. Excluding food and energy, the core PCE price index also added 2.8% Y/Y, down from 2.9% in August.
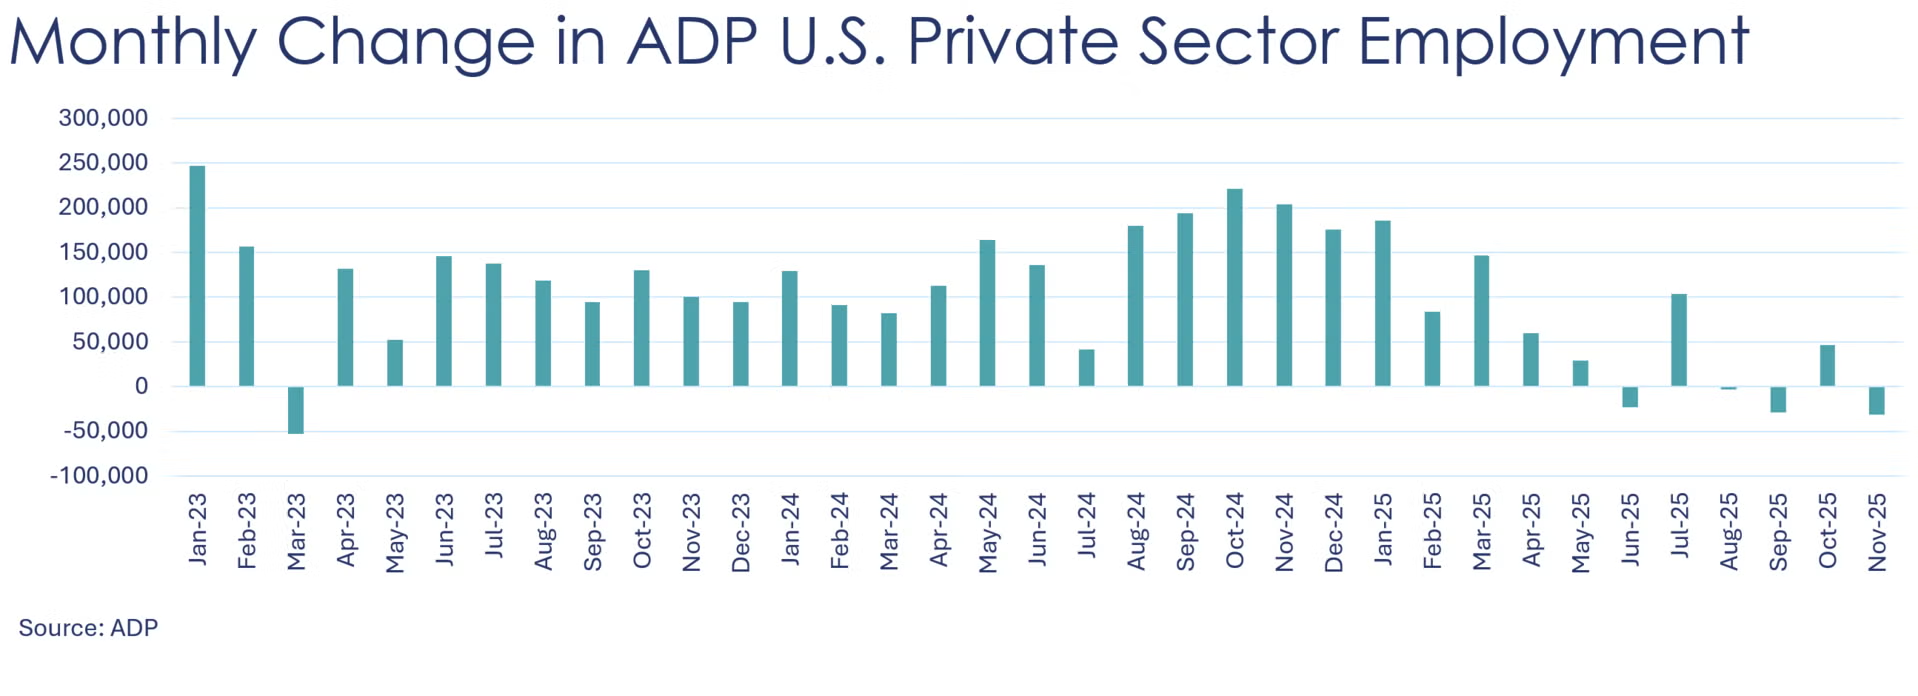
A proxy for the BLS nonfarm payrolls data, ADP reported that U.S. private sector employment shrank by 32,000 in November after gaining a revised 47,000 in October. Private payrolls have declined four out of the last six months. The year-to-date average monthly job gain in 2025 is 52,000, compared to 141,000 for the same period in 2024. Job losses were reported in manufacturing (down 18,000) and construction (down 9,000), as well as information, financial activities, and professional and business services. Employment rose in natural resources and mining (up 8,000); trade, transportation, and utilities; education and health services; and leisure and hospitality. Among size classes, the November pullback was entirely driven by small businesses, which lost 120,000 jobs, with mid-sized and large businesses adding 51,000 and 39,000 jobs, respectively. The ADP National Employment Report is an independent and high-frequency view of the private-sector labor market based on the aggregated and anonymized payroll data of more than 26 million U.S. employees.
US businesses announced over 71,000 layoffs in November, according to Challenger, Gray & Christmas, an executive staffing firm. The November cuts were 53% down from October but 24% higher than a year earlier. So far in 2025, for a total of eight months employers have cut staff at a higher rate than they did the year before. The firm noted that after the Great Recession, layoff plans have tended to soften towards the end of the year to avoid cuts happening during the holidays. The year-to-date total reached nearly 1.2 million, up 54% from the same period last year. The industries that cut the most in November include telecommunications, technology, food distribution, services (especially outsourcing), retail, non-profits, and media.
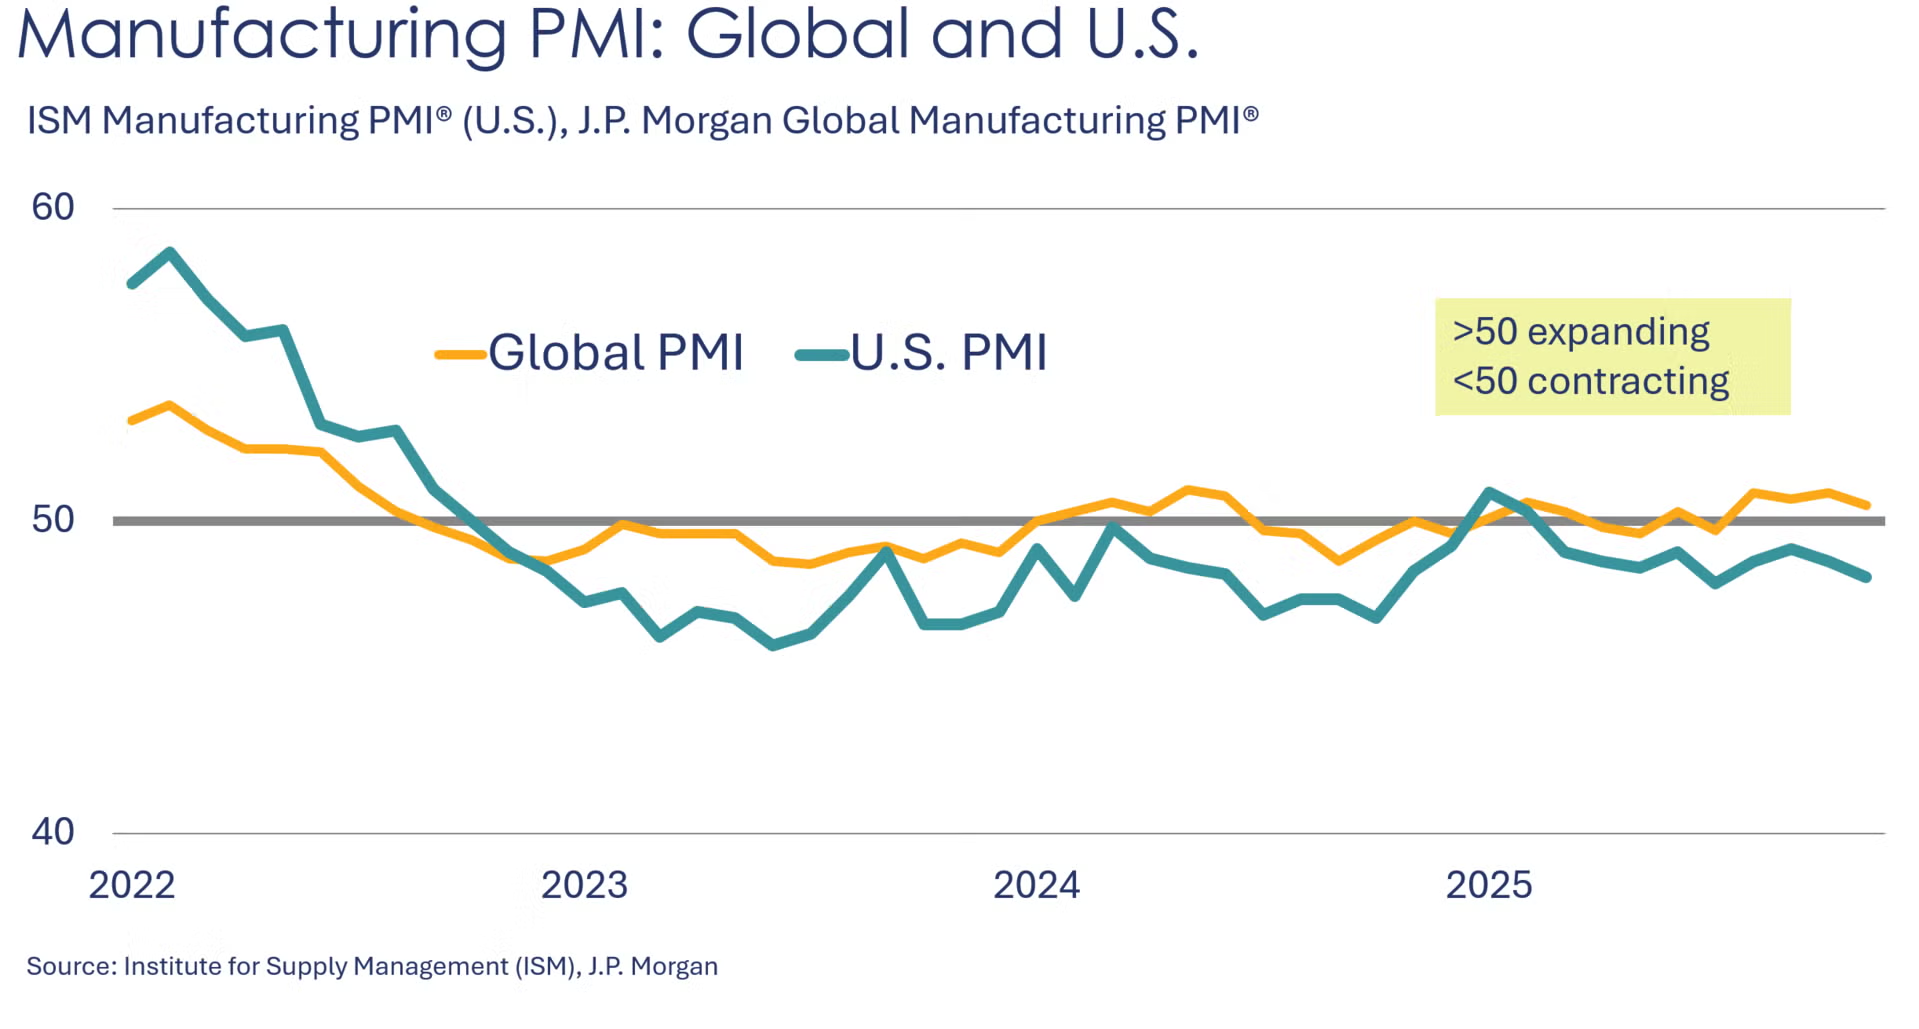
The ISM Manufacturing PMI® fell 0.5 points in November to 48.2, the ninth month of contraction. New orders, employment, and order backlogs contracted at a faster pace while production expanded. New export orders, imports, and inventories contracted at a slower pace. Customer inventories were again deemed to be “too low” and supplier deliveries were faster (suggesting more slack in the distribution network). Only four industries reported expansion in November, while 11 industries reported contraction, including chemicals.
Looking abroad, growth in global manufacturing momentum slowed in November with the JP Morgan Global Manufacturing PMI® falling 0.4 points to 50.5. It was the lowest reading in four months. While output, new orders, and supplier deliveries were at levels consistent with improved operating conditions, employment and inventories signaled contraction. New export orders contracted for an eight straight month.
Light vehicle sales increased in November, rising to a seasonally adjusted annual rate of 15.6 million units. Compared to last year, sales fell 5.5% Y/Y, as sales of both cars and light trucks declined, down 18.4% Y/Y and 2.7% Y/Y, respectively. Sales are still reflecting the significant increases that took place earlier in the year as vehicle demand increased in anticipation of the expiration of the EV tax credits and tariff-related price changes.
After rising 1.3% in August, factory orders inched up 0.2% in September, driven by orders for primary and fabricated metals, electrical equipment, computers and electronic products, and transportation equipment. Within the latter, a drop in nondefense aircraft orders was more than offset by a large increase in defense aircraft orders. Motor vehicle orders increased slightly. Orders for core business goods (nondefense capital goods, excluding aircraft) advanced 0.9%, following another 0.9% rise in August. Unfilled orders (a measure of the manufacturing pipeline) gained 0.7% on top of another 0.7% increase in August. Manufacturing shipments and manufacturing inventories were virtually flat in September, with the inventories-to-shipments ratio remaining at 1.56.
The ISM Services PMI® increased slightly to 52.6 in November (a level above 50 corresponds to an expansion while a level below 50 indicates a contraction in the services sector). The increase was led by order backlogs, imports, new export orders, employment (all contracting at a slower pace), and inventories (which switched from contracting to growing). Business activity/production grew at a slightly faster pace. Inventory sentiment remained “too high” while supplier deliveries slowed further. Prices continued to increase but at a slower pace.
Industrial production edged slightly higher (up by 0.1%) in September, following a downwardly revised 0.3% decline in August. The gain was led by higher utility output; mining and manufacturing production were flat. Within manufacturing, the largest percentage gains were in metals & metal products, electrical equipment, and aerospace. The largest declines were in wood products and motor vehicles & parts. Compared to a year ago, industrial production was up 1.6% Y/Y. Capacity utilization remained steady at 75.9%, which was slightly higher than last September’s 75.7% rate.
Headline import prices (which do not include tariffs) were unchanged in September, following a small gain in August. A decline in prices for imported fuels was offset by higher prices for non-fuel imports. Compared to a year ago, import prices were up 0.3% Y/Y. Export prices were also unchanged, but up 3.7% Y/Y.
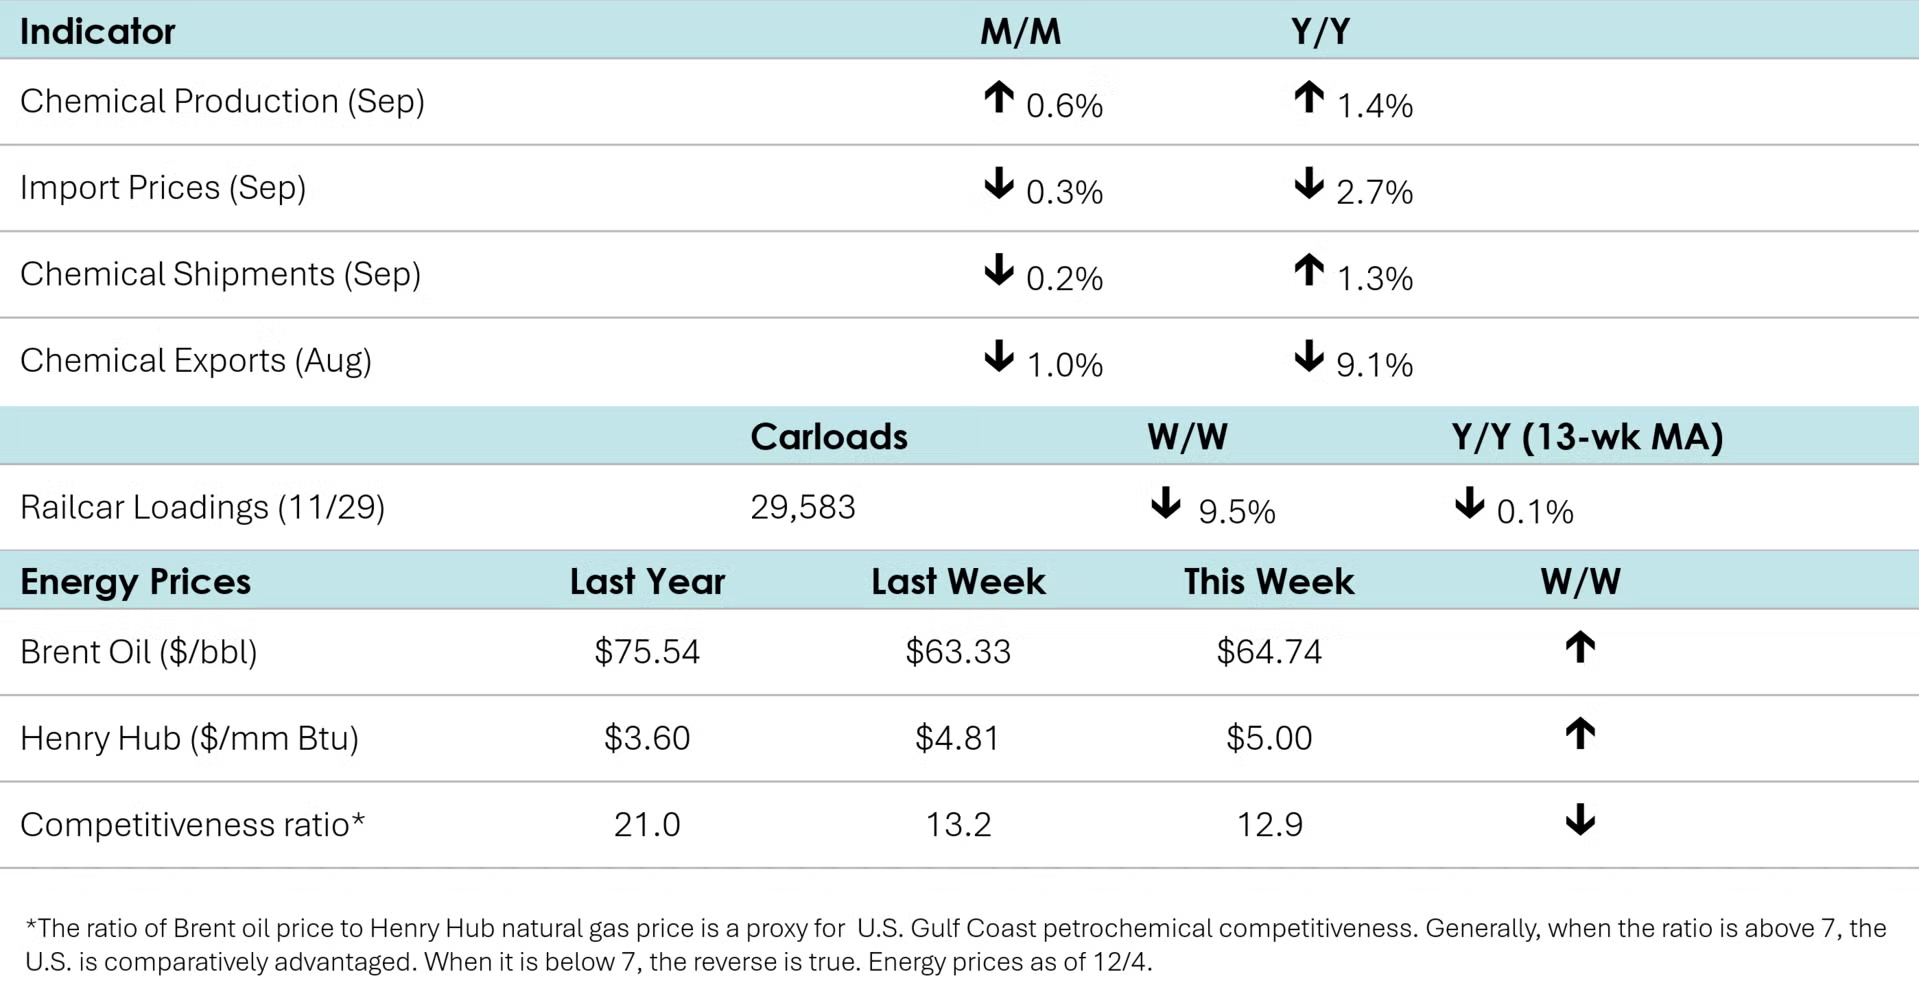
According to data released by the Association of American Railroads, chemical railcar loadings fell sharply to 29,583 for the week ending November 29th, which included the Thanksgiving holiday. Loadings were down 0.1% Y/Y (13-week MA), the first negative comparison in nearly two years. Chemical railcar loadings were up 1.3% YTD/YTD and have been on the rise for seven of the last 13 weeks.
Within the details of the ISM Manufacturing PMI® report, the chemical industry was reported to be in contraction. One chemical industry respondent noted, “Tariffs and economic uncertainty continue to weigh on demand for adhesives and sealants, which are primarily used in building construction.” There was contraction in new orders, production, employment, inventories, order backlogs, new export orders and imports. Customer inventories were deemed “too low”. The chemical industry was one of seven that reported higher supplier deliveries, an indicator of slackness in the distribution network.

Chemical production rose 0.6% in September, following two months of back-to-back declines. Output was higher for agricultural chemicals, consumer products, coatings, synthetic rubber, manufactured fibers. Thes gains were partially offset by declines in the production of plastic resins, organic chemicals, inorganic chemicals, and other specialty chemicals. Compared to a year ago, chemical production was up 1.4% Y/Y. Chemical capacity utilization tightened slightly to 80.2% in September, the highest since last December.

Chemical exports continued to decline in August (-1.0%). Drops in agricultural and consumer chemicals offset gains in basic and specialty chemicals. Imports fell even more (-7.0%), driven by consumer chemicals (-16.2%), basic chemicals (-3.6%), and specialty chemicals (-13.9%). Compared to a year ago, exports and imports decreased by 9.1% and 10.2%, respectively. Due to exports’ relative resilience, the trade surplus grew from $2.4 billion in July to $3.0 billion in August.
Chemical import prices (which do not include tariffs) eased for a second consecutive month in August, down another 0.3%. Chemical export prices were also lower by 0.4%. Compared to a year ago, chemical import prices were off 2.7% Y/Y while export prices were 1.5% Y/Y higher.
Chemical shipments were down 0.2% to $57.6 billion in September after being flat in August. Shipments of agricultural chemicals dropped 1.4%, while coatings & adhesives and all other chemicals were down by 0.3% and 0.1%, respectively. Chemical inventories were unchanged, with stocks of coatings & adhesives and all other chemicals dropping slightly while agricultural stocks increased. Compared to a year ago, chemical shipments were up 1.3% Y/Y, down from a 1.5% rise in August, while inventories were up 0.6% Y/Y. The inventories-to-shipments ratio for chemicals was 1.24, unchanged from August.
Energy Wrap-Up
• Oil prices moved higher as Ukraine stepped up attacks on Russian oil infrastructure and OPEC left production targets unchanged for Q1.
• U.S. natural gas futures jumped to $5.00/mmbtu (the highest in nearly three years) as sharply colder weather settled in across much of the U.S. this past week.
• The combined oil & gas rig count fell by nine to 537.
For More Information
ACC members can access additional data, economic analyses, presentations, outlooks, and weekly economic updates through ACCexchange: https://accexchange.sharepoint.com/Economics/SitePages/Home.aspx
In addition to this weekly report, ACC offers numerous other economic data that cover worldwide production, trade, shipments, inventories, price indices, energy, employment, investment, R&D, EH&S, financial performance measures, macroeconomic data, plus much more. To order, visit http://store.americanchemistry.com/.
Every effort has been made in the preparation of this weekly report to provide the best available information and analysis. However, neither the American Chemistry Council, nor any of its employees, agents or other assigns makes any warranty, expressed or implied, or assumes any liability or responsibility for any use, or the results of such use, of any information or data disclosed in this material.
Contact us at ACC_EconomicsDepartment@americanchemistry.com.