Note: Due to the July 4th holiday, we will publish the next report on Monday, July 7th.
MACROECONOMY & END-USE MARKETS
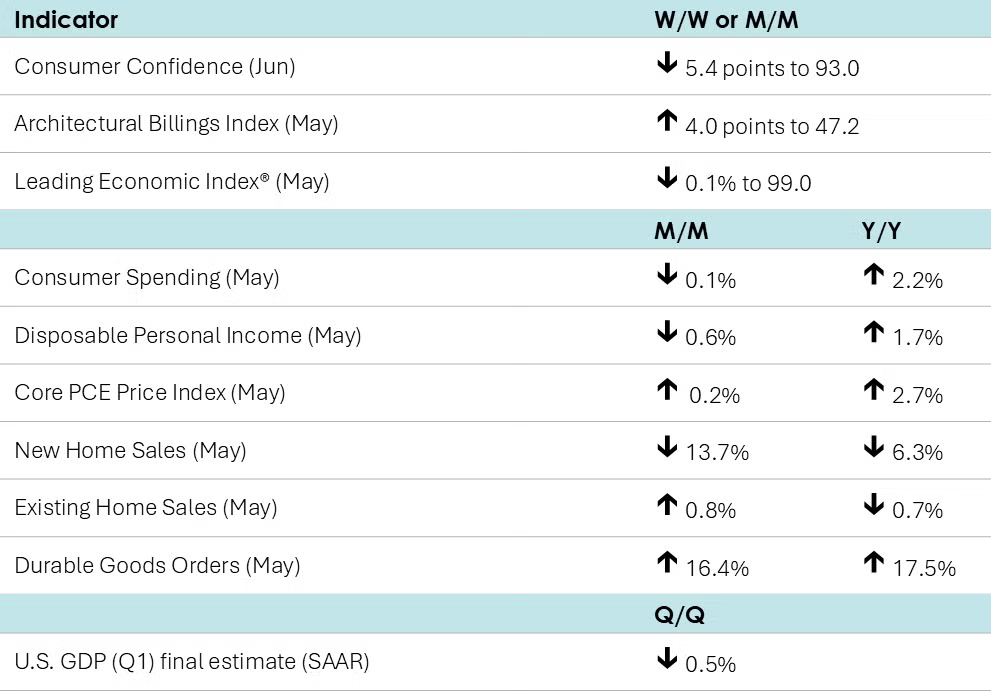
Consumer spending eased by 0.1% in May (the first decline this year), led by a sharp pullback in spending on durable goods (especially autos). Spending on nondurable goods was also lower, and spending on services was essentially flat. Personal income fell for the first time in since September 2021, down by 0.4% with led by declines in benefits payments (related to the expiration of benefits for certain state & local government workers) and lower proprietor’s income. The price index for personal consumption expenditures (PCE) rose 2.3% Y/Y, slightly higher than April’s 2.2% increase. Excluding the volatile food and energy components, the core PCE price index rose at a 2.7% Y/Y rate, also slightly higher compared to April’s 2.6% Y/Y gain. Growth in the core PCE price index has been stuck in a narrow range around 2.6%-2.9% for the past year. The core PCE price index is the Fed’s preferred inflation measure and remains above its 2% target. The savings rate moved lower from 4.9% in April to 4.5% in May.
Following a short-lived burst of optimism in May, consumer confidence fell in June, down 5.4 points to 93.0, the second lowest reading since the pandemic. Expectations continued to weaken across all three components – business conditions, employment prospects, and future income. Purchasing plans for cars were steady at the highest level since last December, while purchasing plans for homes declined. Compared to May, more consumers were undecided about plans to buy big-ticket items overall. Buying plans for most appliances were slightly up while plans to buy electronics goods were down.
Existing home sales rose 0.8% in May to a 4.03 million seasonally adjusted annual rate (SAAR). Inventories rose and were up more than 20% Y/Y while sales were 0.7% Y/Y lower. At the current sales pace, inventories represented a 4.6-month supply (the highest since 2016 if you exclude May 2020). The median sales price rose 1.3% Y/Y to $422,800.
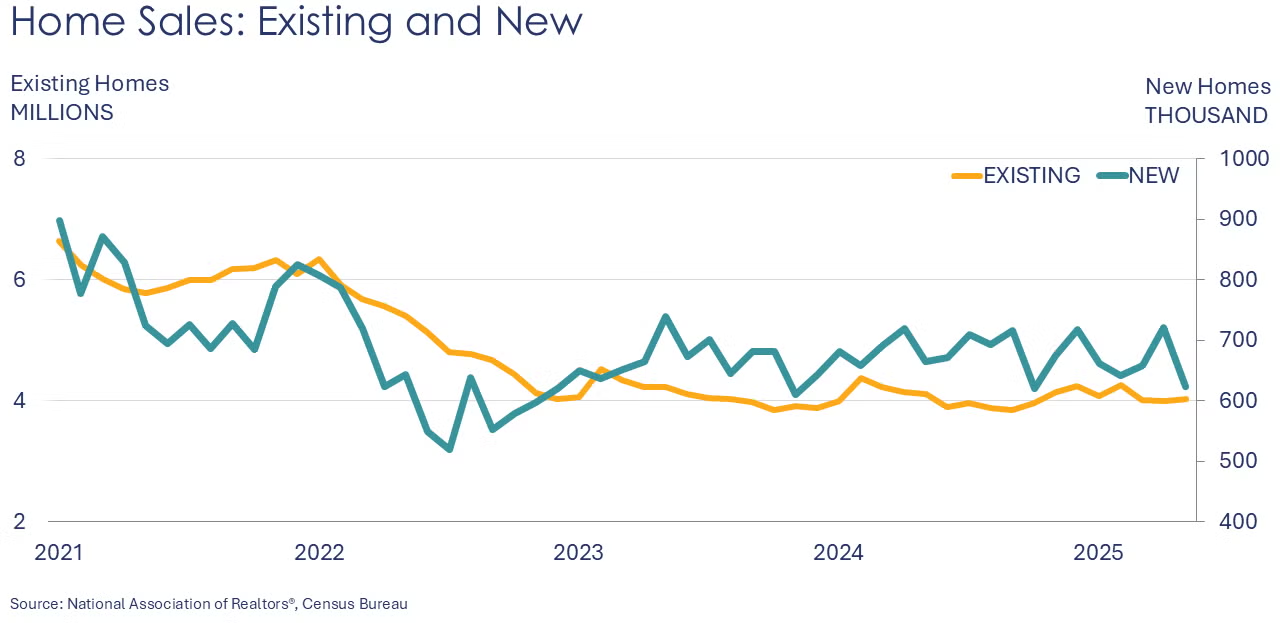
Following an increase in April, new home sales retreated in May, down 13.7% to their lowest rate in nearly 2 ½ years. With 33,000 pounds of chemistry in a typical single-family home, new residential construction is an important end-use market for chemicals. The inventory of unsold homes rose and represent a 9.8-month supply at the current sales pace. Compared to a year ago, inventories were up 8.1% Y/Y while sales were down 6.3% Y/Y. The median sales price was up 3.0% Y/Y.
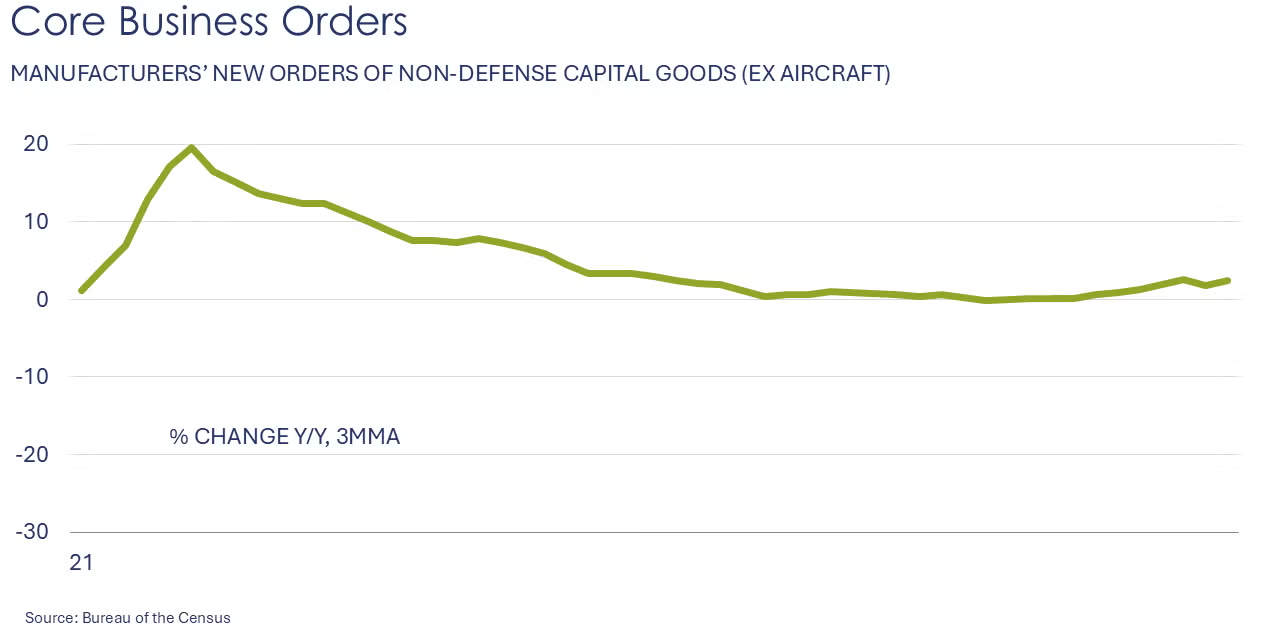
Durable goods orders surged in May, up by 16.4%, after a pullback in April. The gain was largely driven by a tripling of orders for civilian aircraft, but there were smaller gains across most other major categories, as well. Following a 1.4% decline in April, core durable orders (nondefense capital equipment, excluding aircraft) rebounded and were up 1.7%. Compared to a year ago, core durable orders were up 2.3% Y/Y while headline orders were ahead by 17.5% Y/Y.
Q1 U.S. GDP fell at a 0.5% seasonally adjusted annual rate (SAAR) according to BEA’s third and final estimate. The lower estimate primarily reflects downward revisions to consumer spending . As with the previous two estimates, the contraction in GDP was driven by the strong growth in imports ahead of the April 2nd tariff announcement. Imports are counted as a negative contributor to GDP. Underlying domestic activity continued to expand but was weaker than originally estimated with real final sales to domestic purchasers up at a 1.9% rate (down from 2.5% in the 2nd estimate).
Following a deep 1.4% decline in April, the Conference Board’s Leading Economic Index® (LEI) continued to slide, edging down by 0.1% in May. Over the past six months, the LEI has fallen by 2.7%, a faster pace of contraction than the 1.4% over the previous six-month period. Consumers’ pessimism, persistently weak new orders in manufacturing, a second consecutive month of rising initial claims for unemployment insurance, and a decline in housing permits were only partially offset by higher stock prices in May.
The Architectural Billings Index, a leading indicator for nonresidential construction activity, rose by 4.0 points to 47.2, a level that still indicates a decline in billings. While billings declined across all specializations, the pace of decline slowed for firms specializing in multifamily residential projects.
CHEMICALS
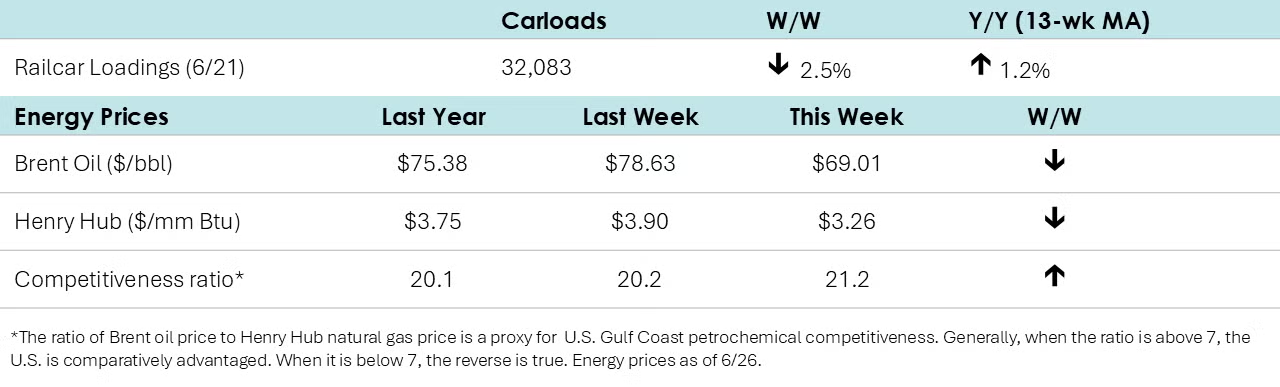
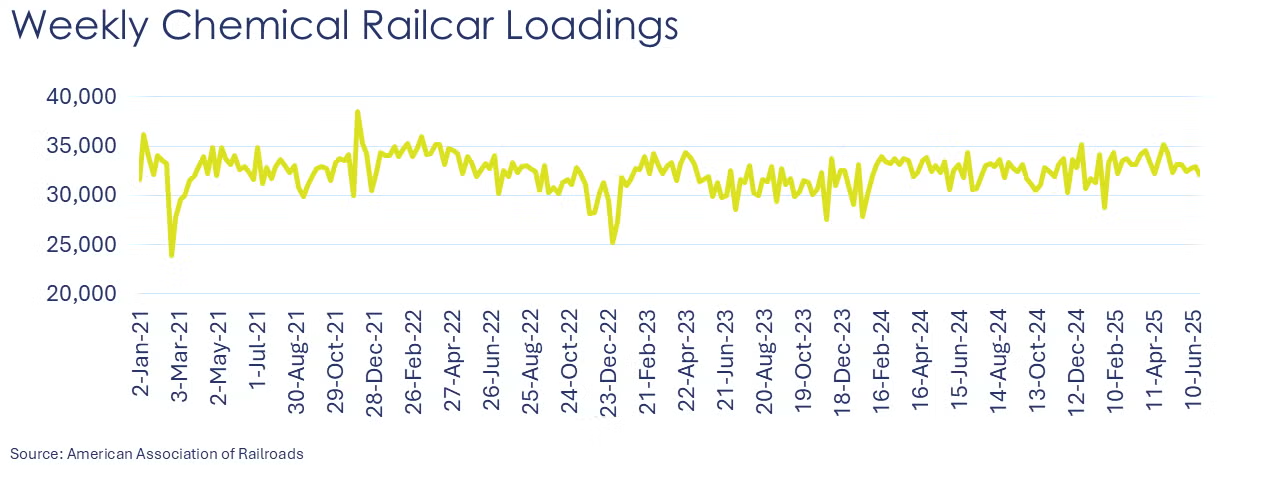
According to data released by the Association of American Railroads, chemical railcar loadings were down to 32,083 for the week ending June 21st. Loadings were up 1.2% Y/Y (13-week MA), up 1.8% YTD/YTD and have been on the rise for seven of the last 13 weeks.
Energy Wrap-Up
- Oil prices fell from a week ago as the Israel-Iran ceasefire appears to be holding.
- U.S. natural gas prices also eased, both in the U.S. and Europe.
- The combined oil & gas rig count fell by another three to 549, its lowest level since 2021.
For More Information
ACC members can access additional data, economic analyses, presentations, outlooks, and weekly economic updates through ACCexchange.
In addition to this weekly report, ACC offers numerous other economic data that cover worldwide production, trade, shipments, inventories, price indices, energy, employment, investment, R&D, EH&S, financial performance measures, macroeconomic data, plus much more. To order, visit the ACC Store.
Every effort has been made in the preparation of this weekly report to provide the best available information and analysis. However, neither the American Chemistry Council, nor any of its employees, agents or other assigns makes any warranty, expressed or implied, or assumes any liability or responsibility for any use, or the results of such use, of any information or data disclosed in this material.