MACROECONOMY & END-USE INDUSTRIES
As widely expected, the Federal Reserve left interest rates unchanged for a fourth consecutive time. The Fed noted that “Uncertainty about the economic outlook has diminished but remains elevated.” In addition, the Fed projects that the economy will grow more slowly, unemployment will pick up slightly, and inflation will rise before dissipating. Expectations remain for two rate cuts before the end of this year, but fewer cuts in 2026 and 2027.
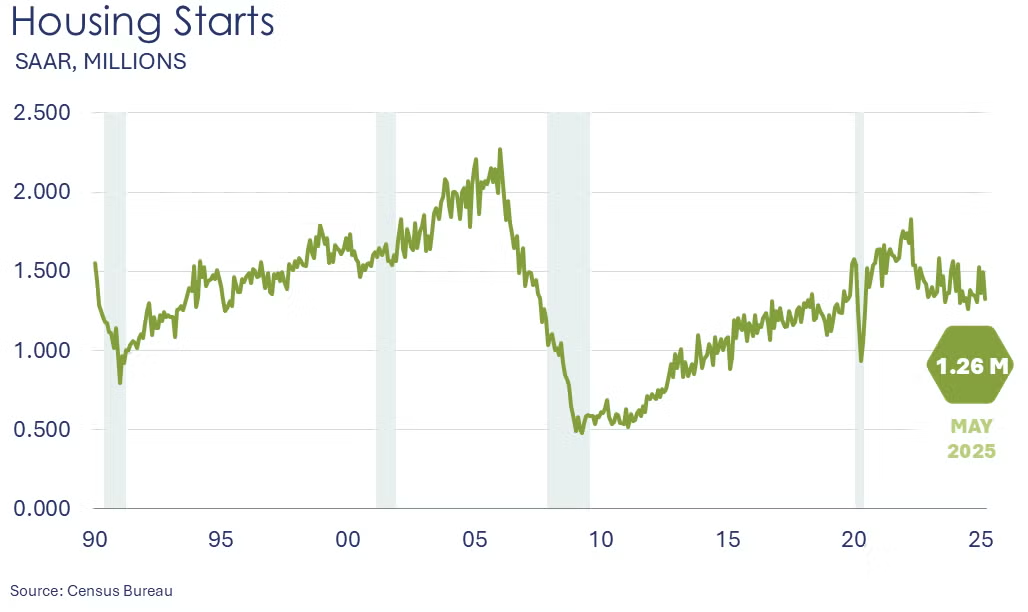
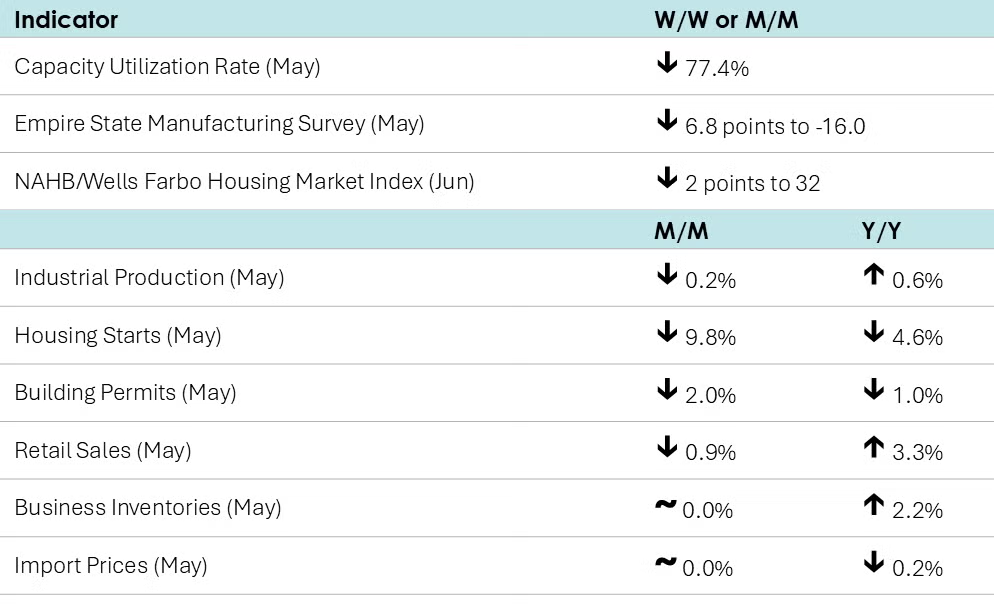
Headline housing starts fell 9.8% in May to a 1.26 million annual pace, the lowest level in five years. Chemistry-intensive single-family starts were slightly higher (up 0.4%) from April, with gains in the West and Midwest regions. Multifamily was down sharply. Forward-looking building permits fell for a second month, down 2.0%. Compared to a year ago, housing starts were off 4.6% Y/Y while building permits were down 1.0% Y/Y.
Homebuilder sentiment (as measured by the NAHB/Wells Fargo Housing Market Index) continued to tumble in June, falling two points to 32. There was ongoing deterioration among the three subcomponents – current sales activity, expected sales, and buyer traffic.
Following essentially flat growth in April, headline industrial production eased in May, down by 0.2%. Sharply lower utility output was offset by marginal gains in mining and manufacturing output. Within manufacturing, the largest declines were in nonmetallic metal products, metal products, machinery, printing, and petroleum products. The largest gains were in motor vehicles, aircraft, apparel and wood products. Capacity utilization fell 0.3 percentage points to 77.4% and was well below the 78.1% rate a year ago.
Headline retail and food service sales fell 0.9% in May, following a revised 0.1% decline in April. Sales in may were higher at furniture & home furnishing stores, sporting goods & hobby stores, clothing & accessory stores, online platforms, and miscellaneous retailers. Offsetting those gains, however, were declines in sales at building & garden centers, grocery stores, gas stations, department stores, electronics retailers, and motor vehicle & parts dealers. Restaurant and bar sales also fell. Core retail sales (excluding vehicle & gas station sales) were essentially flat for a second month as consumers pulled back amid an uncertain economic environment.
Import prices (which do not include tariffs) were flat in May, as lower prices for imported fuels were offset by a 0.3% gain in the prices of nonfuel imports. Prices for exported goods fell 0.9% with a small gain in agricultural export prices offsetting a 1.0% decline in the prices for non-agricultural exports. Compared to a year ago, import prices were up 0.2% while export prices were 1.7% higher.
Manufacturing activity continued to decline in New York State in June according to the Empire State Manufacturing Survey. New orders and shipments declined, and supply availability worsened. Firms were more optimistic looking ahead six months, however.
Business inventories were flat in April as a gain in wholesale inventories was offset by slightly lower manufacturing inventories. Retail inventories were flat. A component of GDP growth, the report shows that the stockpiling that occurred ahead of tariffs in Q1 may have leveled off. Combined business sales eased by 0.1% as declines in manufacturing and retail sales were offset by a small gain in sales at the wholesale level. The inventories-to-sales ratio remained steady at 1.38.
CHEMICALS
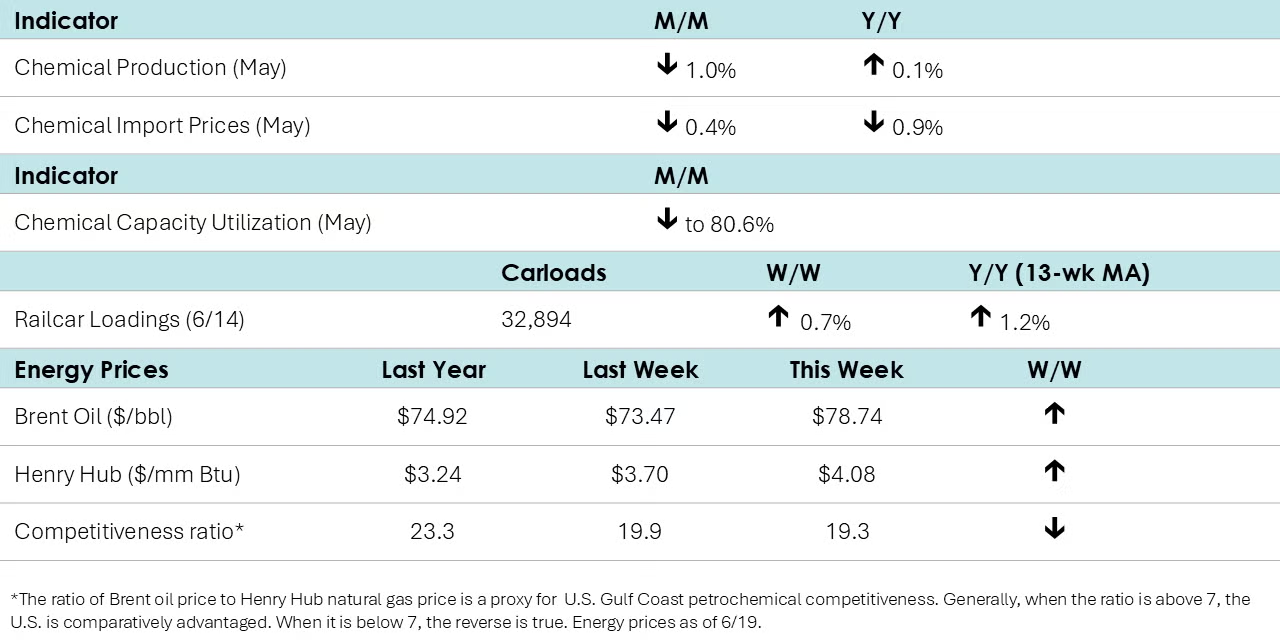
According to data released by the Association of American Railroads, chemical railcar loadings were up to 32,894 for the week ending June 15th. Loadings were up 1.2% Y/Y (13-week MA), up 1.8% YTD/YTD and have been on the rise for seven of the last 13 weeks.
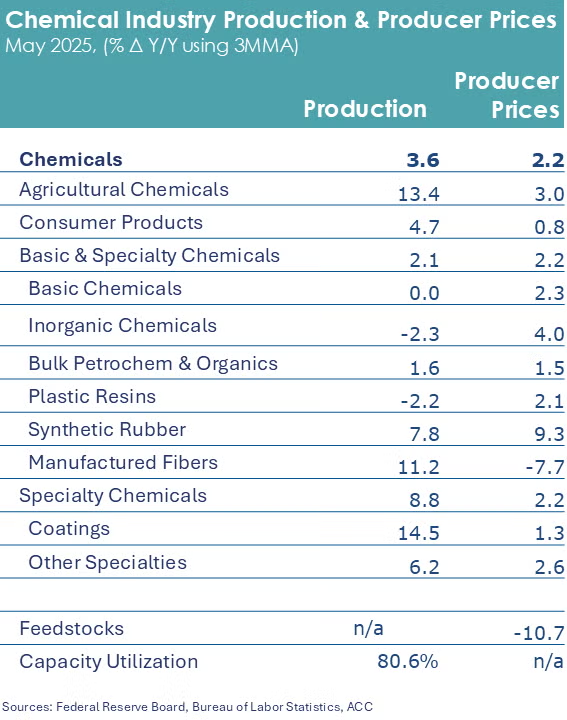
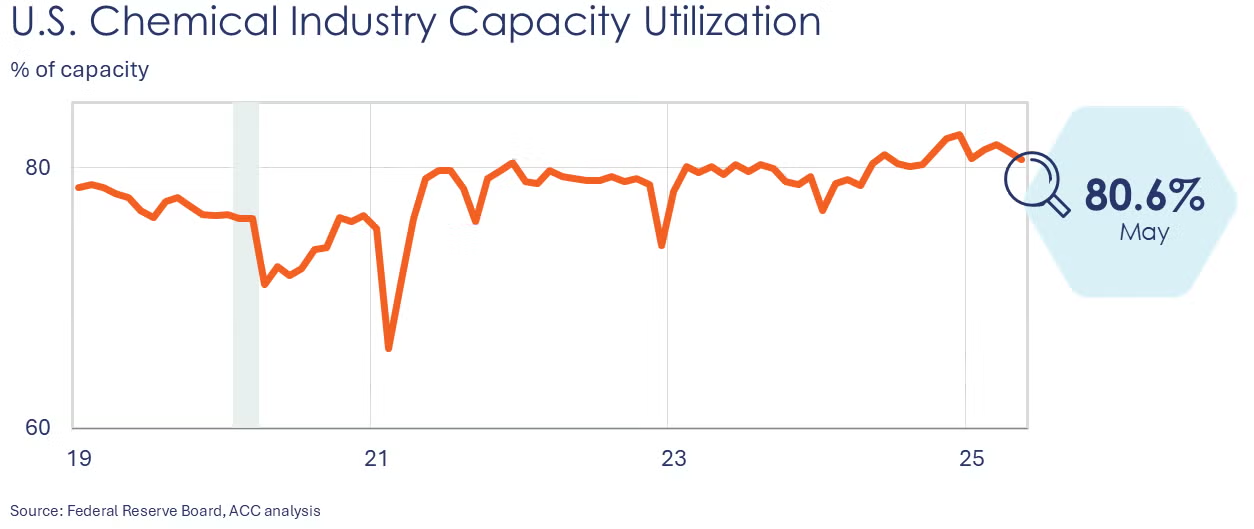
Chemical production fell for a second consecutive month in May, down 1.0% (following a 0.7% decline in April). Production fell sharply for fertilizers, crop protection chemicals, coatings, adhesives, other specialty chemicals, plastic resins, synthetic rubber and manufactured fibers. Those declines were only partially offset by higher output of organic chemicals, industrial gases, and other inorganic chemicals. Compared to a year ago, chemical production was essentially flat (up 0.1%). Chemical industry capacity utilization also fell for a second straight month, down to 80.6%.
Chemical import prices (which do not reflect tariffs) rose 0.5% in May, following a 0.9% decline in April. Export prices eased 0.4%. Compared to a year ago, chemical import prices were lower for a 30th consecutive month (off by 0.9%). Export prices, on the other hand, were up 3.7% Y/Y.
Energy Wrap-Up
- Oil prices were up sharply from a week ago due to ongoing Israeli-Iranian conflict
- U.S. natural gas prices were also higher, back above $4/mmbtu as a hot weather forecast met a lower than expected inventory build.
- Natural gas inventories rose by 95 BCF.
- The combined oil & gas rig count fell for a seventh consecutive week, down by four to 552 (for the week ending 6/13). Since the end of April, the rig count has fallen by 30 to the lowest level in 3 ½ years.
For More Information
ACC members can access additional data, economic analyses, presentations, outlooks, and weekly economic updates through ACCexchange.
In addition to this weekly report, ACC offers numerous other economic data that cover worldwide production, trade, shipments, inventories, price indices, energy, employment, investment, R&D, EH&S, financial performance measures, macroeconomic data, plus much more. To order, visit http://store.americanchemistry.com/.
Every effort has been made in the preparation of this weekly report to provide the best available information and analysis. However, neither the American Chemistry Council, nor any of its employees, agents or other assigns makes any warranty, expressed or implied, or assumes any liability or responsibility for any use, or the results of such use, of any information or data disclosed in this material.
Contact us via email.


