MACROECONOMY & END-USE MARKETS
Running tab of macro indicators: 14 out of 20
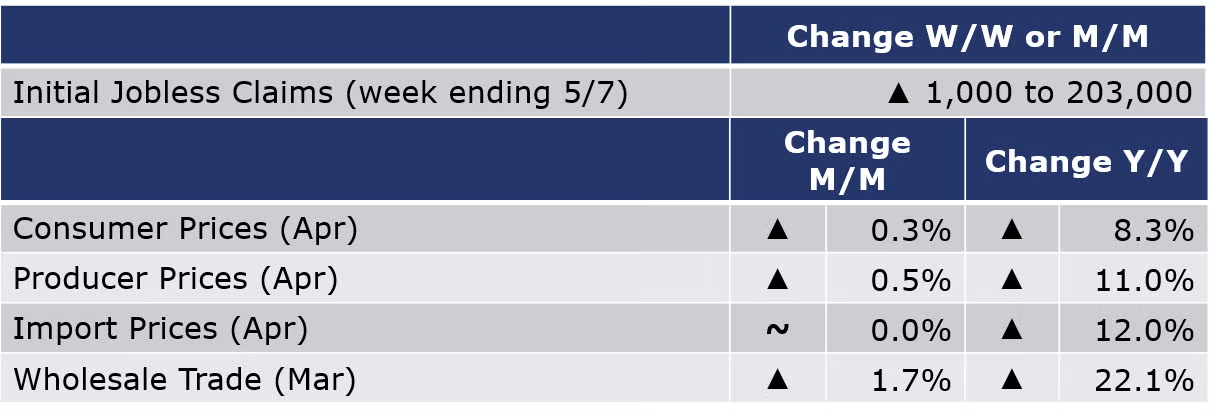
The number of new jobless claims rose by 1,000 to 203,000 during the week ending 7 May. Continued claims fell by 44,000 to 1.34 million, and the insured unemployment rate for the week ending 30 April was unchanged at 1.0%.
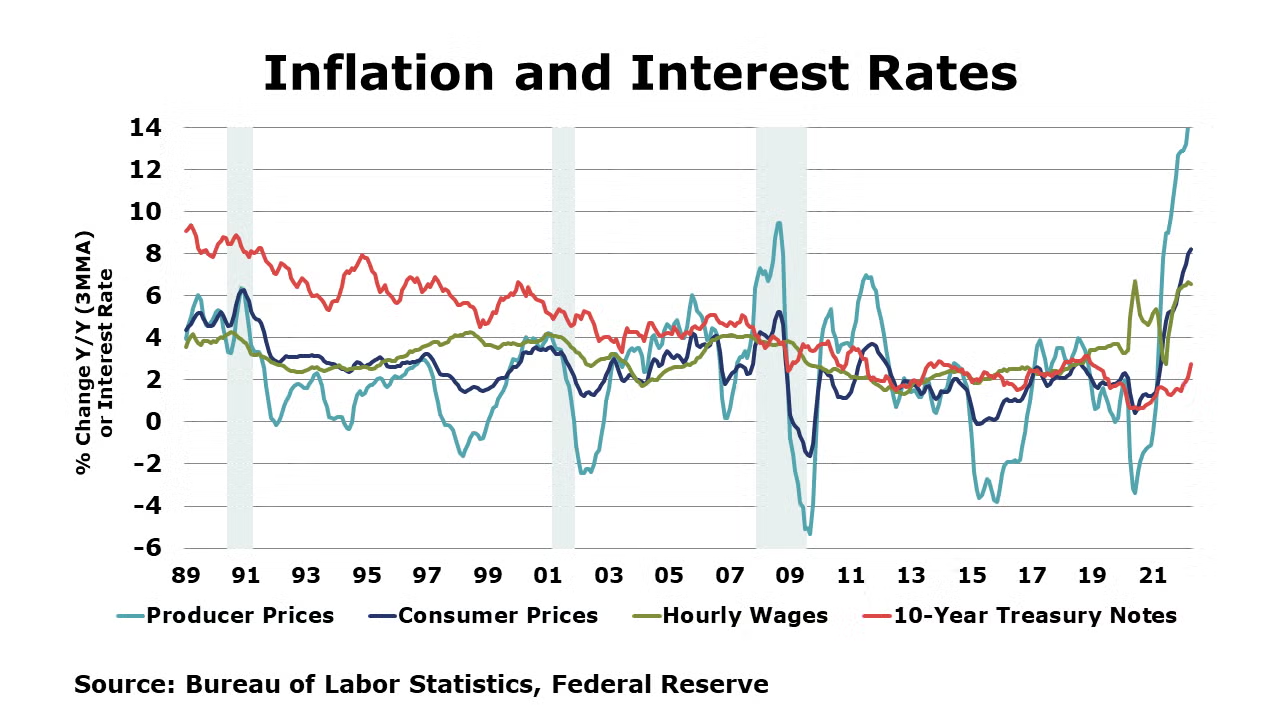
Headline consumer prices rose by 0.3% in April and were up 8.3% Y/Y following a 1.2% rise in March. The indexes for shelter, food, airline fares, and new vehicles were the biggest contributors to the gain in the “all items” index. In the month prior, March, higher gasoline prices drove the gain large gain in the “all items” index; however, in April, gasoline prices fell, pulling down the energy prices index. The index for all items less food and energy (core CPI) rose 0.6% in April and has risen 6.2% over the past 12 months.
Headline producer prices rose 0.5% in April, following gains of 1.6% in March and 1.1% in February. Prices for motor vehicles and equipment rose 0.8%, along with gains in diesel fuel, chicken eggs, jet fuel, electric power, and residential natural gas; gasoline fell 3.2%. Excluding food and energy, core producer prices were up 0.6%. Compared to a year ago, headline producer prices were up 11.0% Y/Y while core prices were up 6.9% Y/Y. Both measures showed a slowing pace compared to readings in March. Import prices were flat in April following a combined gain of 6.8% during Q1. Prices for imported fuels fell in April but were offset by a 0.4% gain in prices for nonfuel imports. The gain in nonfuel imports was the smallest since last September. Export prices rose 0.6% with gains in agricultural and nonagricultural export prices. Compared to a year ago, import prices were up 12.0% while export prices were up 18.0% Y/Y, representing slower annual gains compared to last month.
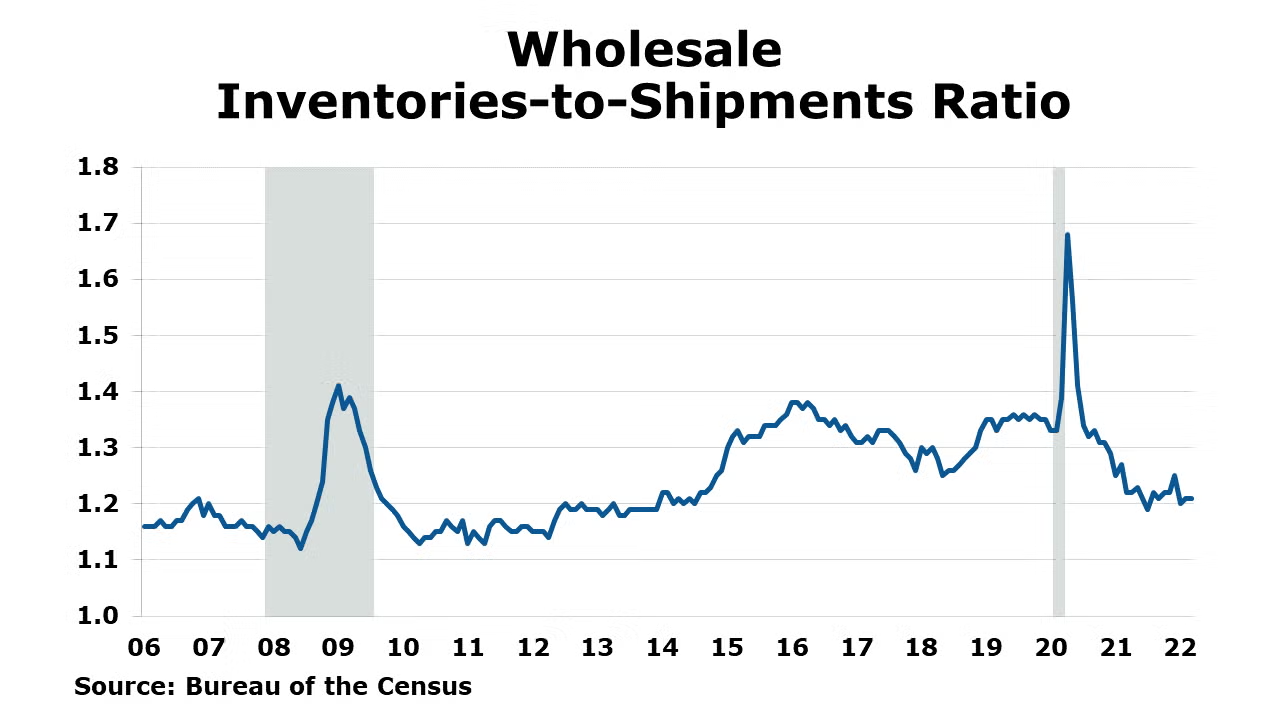
Sales at the wholesale level continued to expand at a robust pace in March, up by 1.7%. Gains were broad-based with the largest increases in motor vehicles, apparel, metals, and lumber. Wholesale inventories also continued to expand by 2.3%. Compared to a year ago, wholesale sales were up 22.1% while inventories were ahead by 22.0% Y/Y. The inventories-to-shipments ratio remained steady at 1.22. Last March, it was 1.23.
The National Federation for Independent Business (NFIB) reported that its index of small business optimism remained unchanged in April at 93.2, the fourth consecutive month below its 48-year average. Expectations for business conditions six months from now fell to a 48-year low. Inflation continues to be cited as the single most important problem facing small business owners.
ENERGY
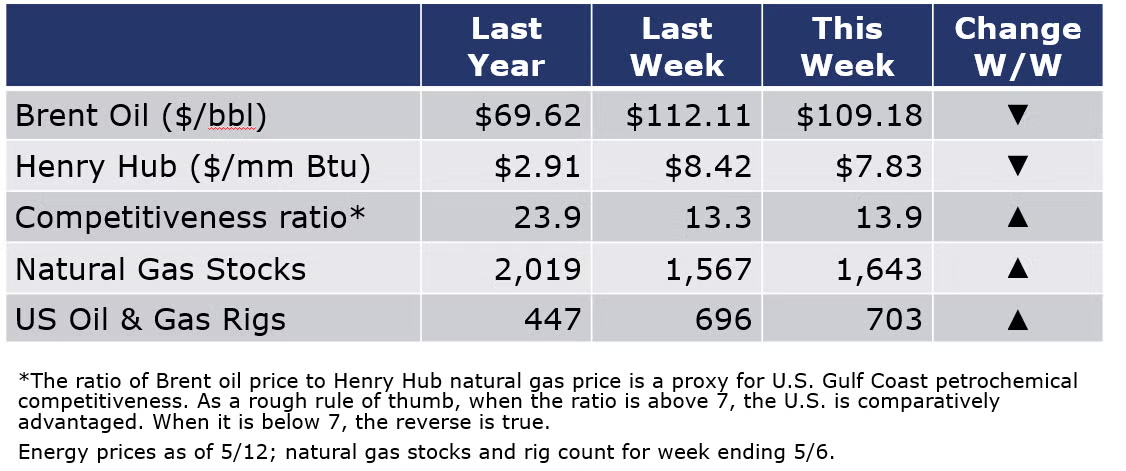
Oil prices moved lower compared to last week on concerns about weakness in China’s economy (from continued lockdowns in Shanghai). U.S. natural gas prices were also lower compared to a week ago but remain sharply above historic averages. European natural gas prices jumped higher, however, following Russian actions against certain European energy companies that could further disrupt gas supplies. The combined oil and gas rig count rose by seven to 703, the first time above 700 in more than two years.
CHEMICALS
For the business of chemistry, the indicators still bring to mind a green banner for basic and specialty chemicals.
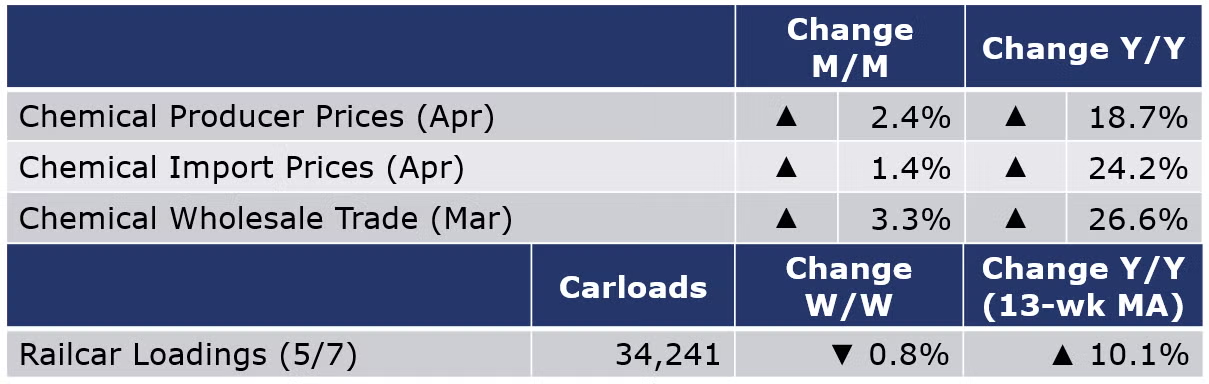
According to data released by the Association of American Railroads, chemical railcar loadings were down slightly (0.8%) for the week ending 7 May. Loadings were up 10.1% Y/Y (13-week MA), up 7.4% YTD/YTD and have been on the rise for 8 of the last 13 weeks.
Following a 1.2% gain in February, chemical wholesaletrade rose by 3.3% in March. Chemical wholesaleinventories rose by 2.9%, following a 3.3% gain in February. Compared to a year ago, chemical wholesale sales were up 26.6% while inventories were up 24.0% Y/Y. The inventories-to-sales ratio fell from 1.10 in February to 1.09 in March. A year ago, it was 1.11.
Chemical prices (as measured by the producer price index) rose 2.4% in April, the 23rd monthly gain. Chemical prices rose in all categories with the largest gains in coatings and synthetic rubber. Plastic resin prices increased 3.5% after several months of decline. Compared to a year ago, chemical prices were up 18.7%; prices for agricultural chemicals were up 44.6% Y/Y. Chemical import prices rose by 1.4% in April, also the 23rd consecutive gain. Chemical export prices rose 2.2%. Compared to a year ago, import prices were up 24.2% Y/Y while export prices were up 8.5% Y/Y. The annual gain in both measures marked the second month of deceleration.
Note On the Color Codes
The banner colors represent observations about the current conditions in the overall economy and the business chemistry. For the overall economy we keep a running tab of 20 indicators. The banner color for the macroeconomic section is determined as follows:
Green – 13 or more positives
Yellow – between 8 and 12 positives
Red – 7 or fewer positives
For the chemical industry there are fewer indicators available. As a result we rely upon judgment whether production in the industry (defined as chemicals excluding pharmaceuticals) has increased or decreased three consecutive months.
For More Information
ACC members can access additional data, economic analyses, presentations, outlooks, and weekly economic updates through MemberExchange.
In addition to this weekly report, ACC offers numerous other economic data that cover worldwide production, trade, shipments, inventories, price indices, energy, employment, investment, R&D, EH&S, financial performance measures, macroeconomic data, plus much more. To order, visit https://store.americanchemistry.com/.
Every effort has been made in the preparation of this weekly report to provide the best available information and analysis. However, neither the American Chemistry Council, nor any of its employees, agents or other assigns makes any warranty, expressed or implied, or assumes any liability or responsibility for any use, or the results of such use, of any information or data disclosed in this material.
Contact us at ACC_EconomicsDepartment@americanchemistry.com