Running tab of macro indicators: 9 out of 20
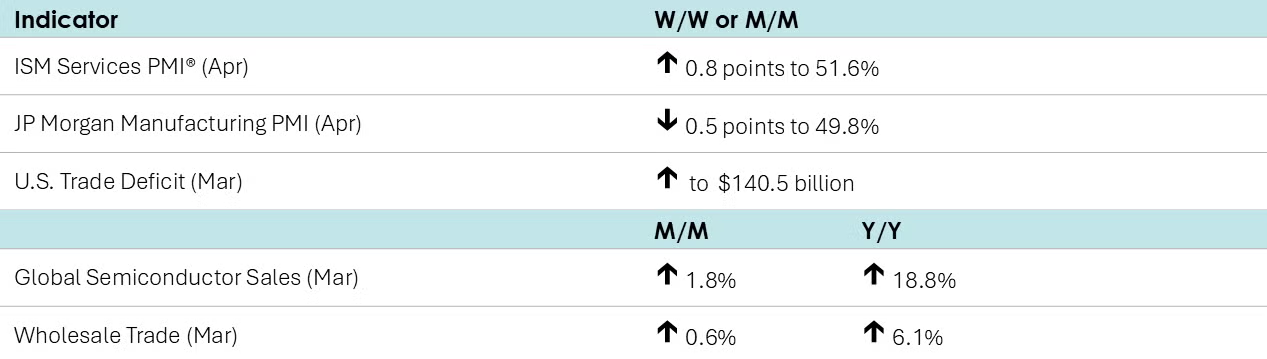
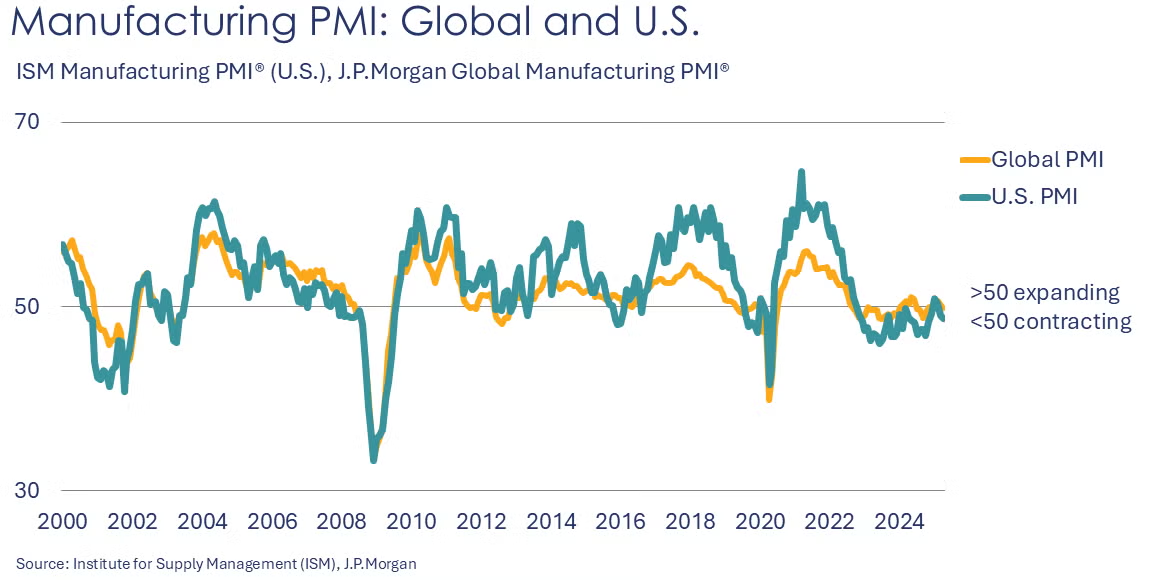
The JP Morgan Global Manufacturing PMI® eased by 0.5 points to 49.8 in April. New orders, new export orders and employment were lower, while production rose for a fourth month. Geographically, India, Ireland and the Philippines saw the largest expansions in manufacturing while smaller expansions occurred in China and the Eurozone. Among the largest economies, manufacturing in the U.S. and Japan contracted.
The ISM Services PMI® expanded in April, up by 0.8 points to 51.6%. Business activity expanded at a slower pace, employment contracted, new orders expanded at a faster pace. Order backlogs and new export orders fell at a slower pace than in March. Inventories rose at a faster pace. The tone among the comments was mixed – several respondents noted steady or improving activity while others noted significant slowdowns related to tariffs and overall uncertainty.
The U.S. trade deficit surged to a new record $140.5 billion as imports accelerated as businesses and consumers rushed to bring in products ahead of tariffs. Imports were up by $22.5 billion (representing a large gain in pharmaceuticals) while U.S. exports edged higher by $0.5 billion. The trade deficit with China narrowed, while the trade deficit with the EU widened, driven by imports from Ireland. Compared to a year ago, the trade deficit has more than doubled.
Wholesale sales rose 0.6% in March, following a 2.0% build in February. The largest sales gains were in computer equipment, metals and electrical equipment, farm products, and pharmaceuticals. Inventories rose 0.4%, following a 0.5% gain in February, with the largest gains in furniture, chemicals, hardware, automotive, and miscellaneous durable goods. Compared to a year ago, wholesale inventories were up 2.2% while sales 6.1% higher. The inventories-to-sales ratio remained stable at 1.30. A year ago, it was 1.35.
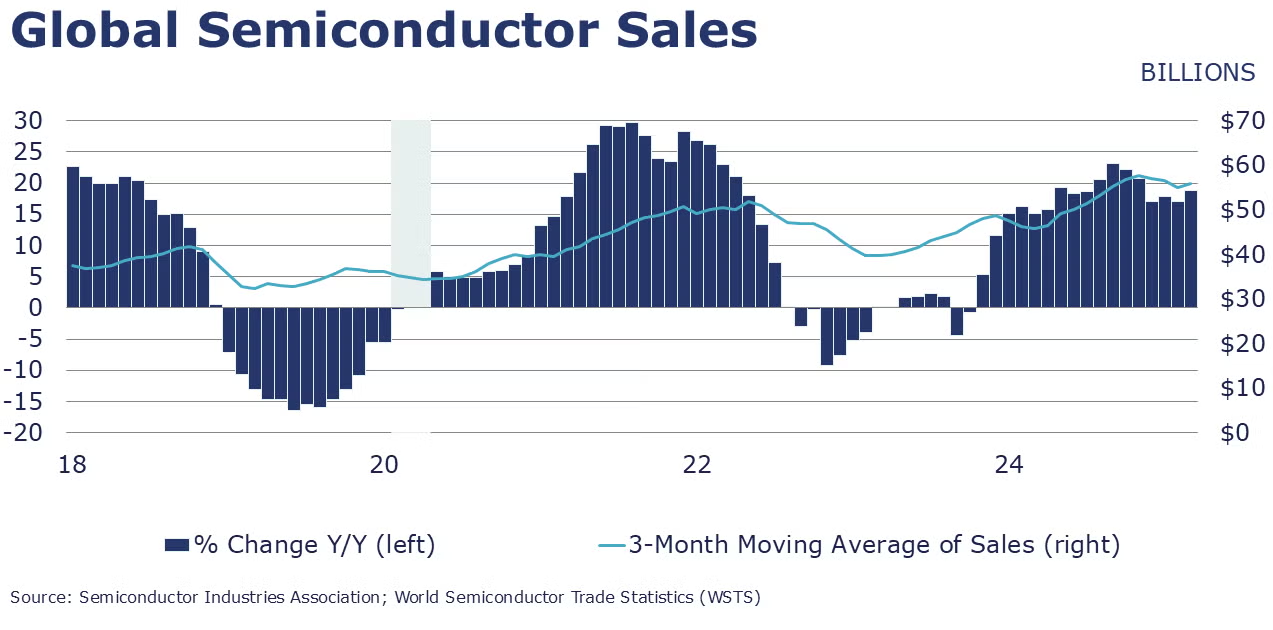
Global semiconductor sales rose 1.8% in March to $55.9 billion. The highest growth was in the Americas region. Semiconductors require more than 500 highly specialized process chemistries to manufacture. Compared to a year ago, semiconductor sales were up 18.8% Y/Y.
Indicators for the business of chemistry suggest a yellow banner.
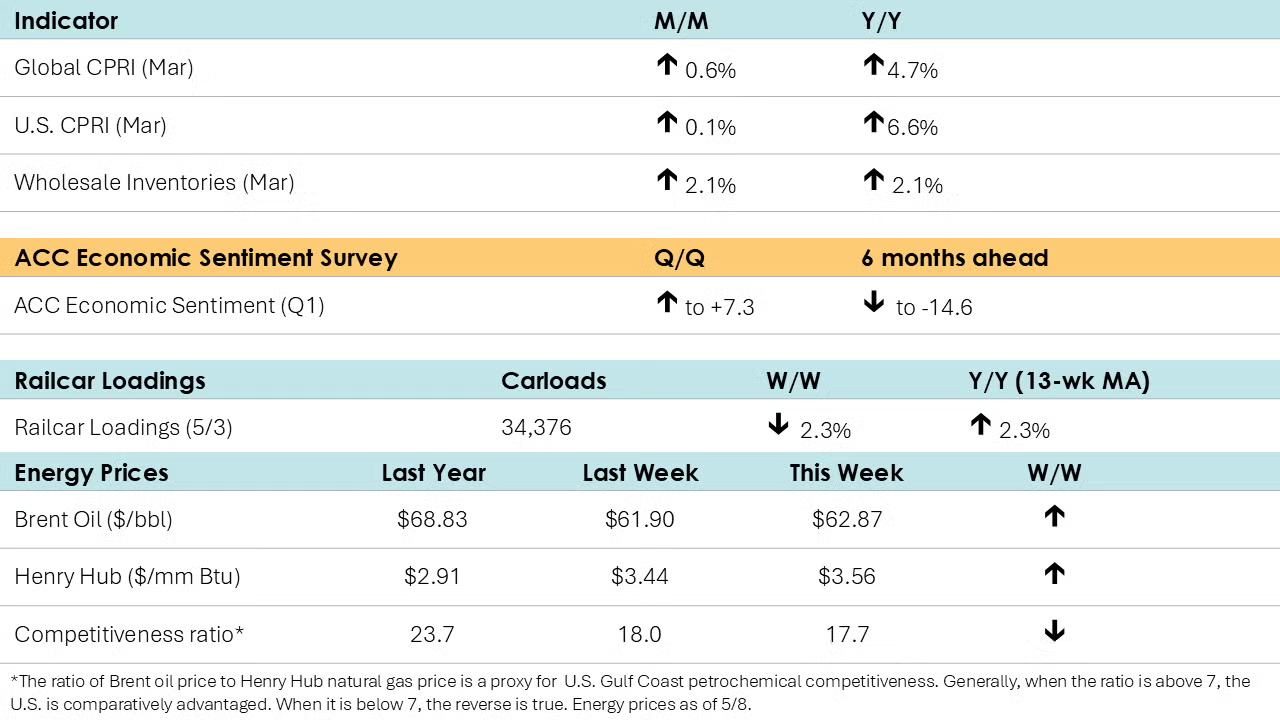
Following a 0.9% increase in February,ACC’s Global Chemical Production Regional Index (Global CPRI) rose again (0.6%) in March. Production in most regions increased, except South America, where output declined. Production in China grew, likely due to front-loading from U.S. importers. A similar phenomenon was also observed among European producers. All segments showed strength in March. Global chemical production growth was up 4.7% Y/Y.
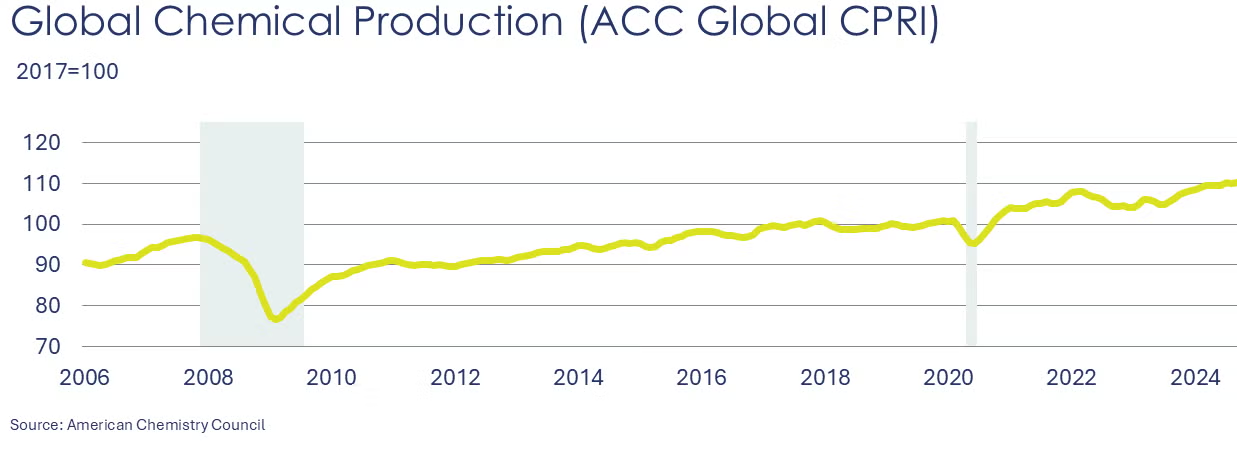
The U.S. CPRIsaw a slight uptick in March, rising by 0.1% from February. Chemical production advanced in all regions, except the Gulf Coast. The U.S. CPRI was 6.6% higher than a year ago. The CPRI measures chemical production trends on a three-month moving average (3MMA) to smooth month-to-month volatility.
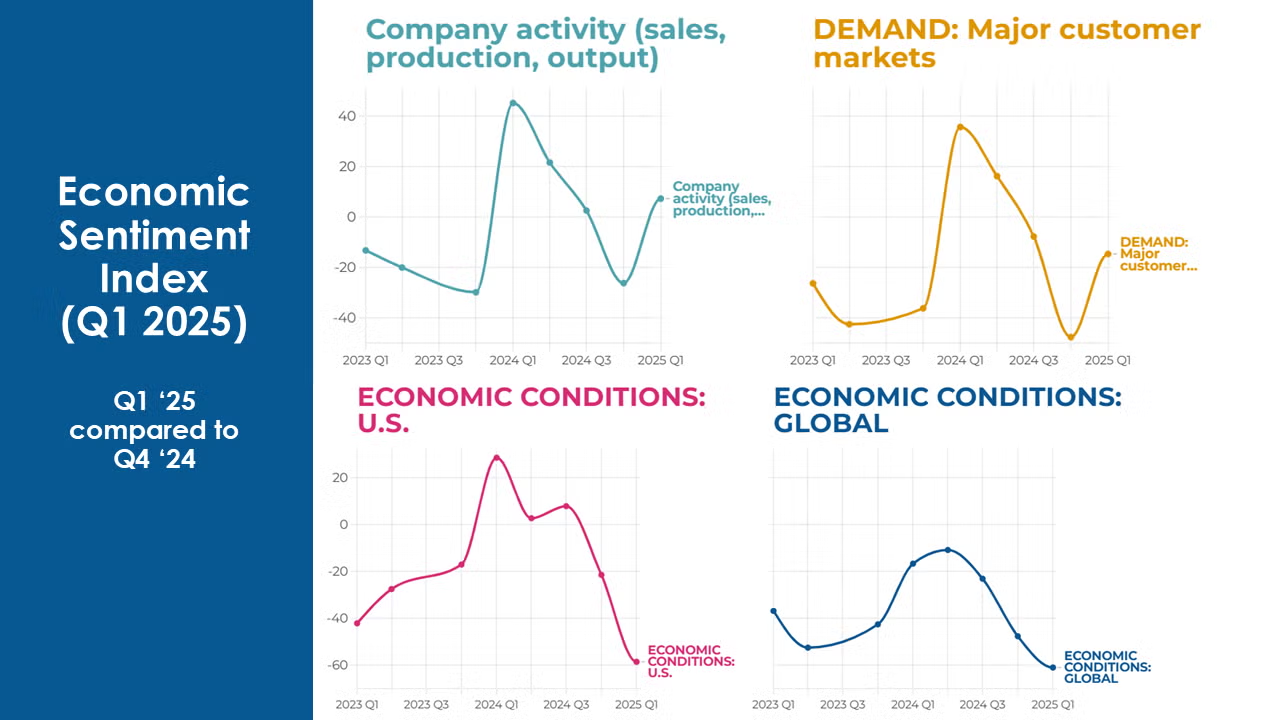
ACC’s Economic Sentiment Index showed that chemical manufacturers reported gains in Q1 despite weak demand in major markets and challenging economic conditions. Overall, chemical manufacturers believe their activity levels improved in Q1, but looking ahead, they are pessimistic about the next six months.
Key highlights:
- Early Year Upswing: New orders, production, and capacity utilization increased in Q1. However, expectations for the next six months turned negative.
- Growing Pessimism: Chemical manufacturers noted worsening economic conditions in the U.S. and globally in Q1. Over the next six months, more than two-thirds expect conditions to worsen.
- Inflated Costs: Production costs rose in Q1, with increases in raw materials, energy, transportation, and labor. Manufacturers expect these costs to continue rising.
- Regulatory Relief: The regulatory burden in the U.S. has impacted manufacturers, deterring investments and innovation. With the new Administration, there is hope for regulatory relief. While the regulatory burden increased at a slower pace in Q1, manufacturers expect a slight increase over the next six months.
The ESI provides quarterly insights from chemical companies across the manufacturing sector and the U.S. economy. This latest report builds on eight quarters of data from Q1 2023 to Q1 2025. You can view the complete findings here.
According to data released by the Association of American Railroads, chemical railcar loadings were down to 34,376 for the week ending 3 May. Loadings were up 2.3% Y/Y (13-week MA), up (2.2%) YTD/YTD and have been on the rise for eight of the last 13 weeks.
Following a modest gain in wholesale inventories of chemicals rose 2.1% in March, the largest monthly gain in nearly 2 ½ years. Sales of chemicals at the wholesale level also rose, up by 0.7%. Compared to a year ago, sales were off 2.0% while inventories were 2.1% higher. The inventories-to-sales ratio moved higher, from 1.13 in February to 1.15 in March. A year ago, the ratio was 1.10.
Energy Wrap-Up
- Oil prices moved lower at the beginning of the week lower after OPEC+ said it would boost production in June, but rebounded mid-week on US-China trade hopes.
- U.S. natural gas prices continued to firm.
- Natural gas inventories continued to build by another 104 BCF and inventories have returned to close to their five-year historical average.
- The combined oil and gas rig count fell by two to 580.
Note On the Color Codes
Banner colors reflect an assessment of the current conditions in the overall economy and the business chemistry of chemistry. For the overall economy we keep a running tab of 20 indicators. The banner color for the macroeconomic section is determined as follows:
Green – 13 or more positives
Yellow – between 8 and 12 positives
Red – 7 or fewer positives
There are fewer indicators available for the chemical industry. Our assessment on banner color largely relies upon how chemical industry production has changed over the most recent three months.
For More Information
ACC members can access additional data, economic analyses, presentations, outlooks, and weekly economic updates through ACCexchange.
In addition to this weekly report, ACC offers numerous other economic data that cover worldwide production, trade, shipments, inventories, price indices, energy, employment, investment, R&D, EH&S, financial performance measures, macroeconomic data, plus much more. To order, visit the ACC Store.
Every effort has been made in the preparation of this weekly report to provide the best available information and analysis. However, neither the American Chemistry Council, nor any of its employees, agents or other assigns makes any warranty, expressed or implied, or assumes any liability or responsibility for any use, or the results of such use, of any information or data disclosed in this material.
Contact ACC's Economics & Data Analytics department via email.


