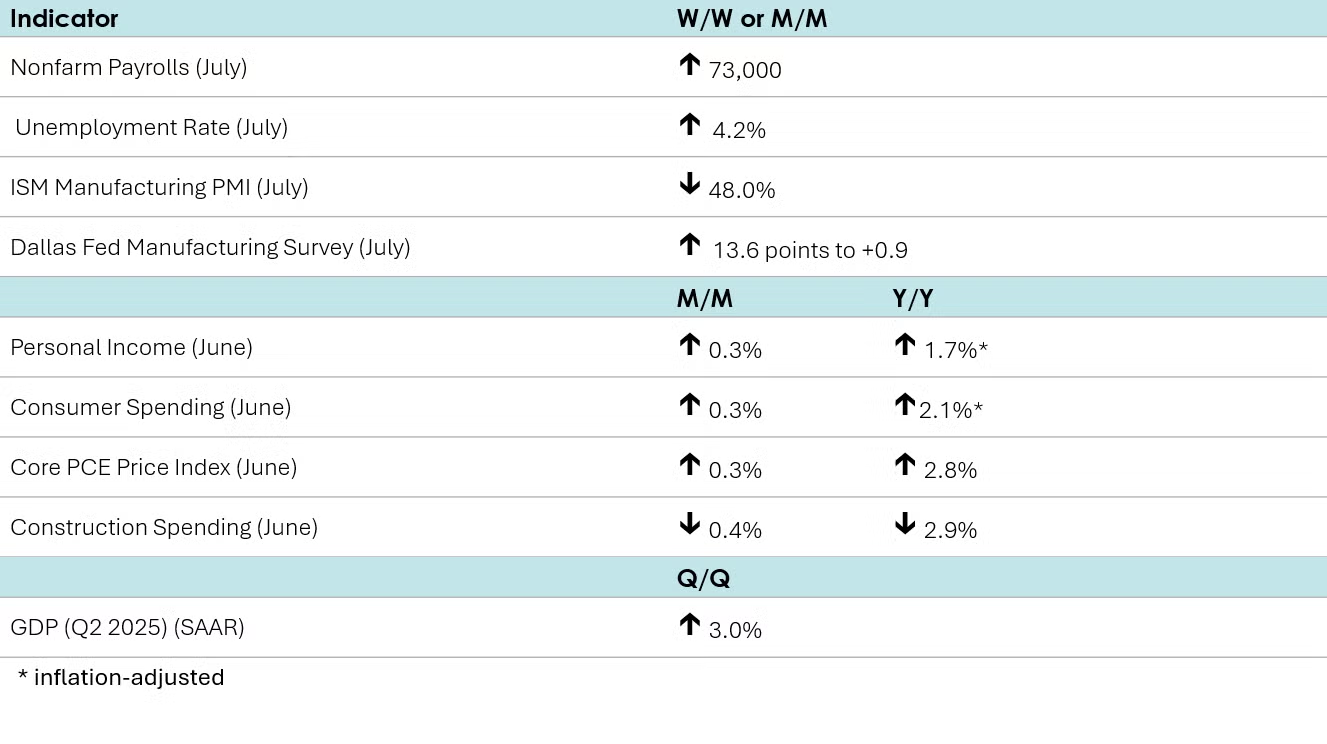
Texas manufacturing activity expanded slightly in July according to the Dallas Fed’s Texas Manufacturing Outlook Survey. The headline index for general business activity rose 13.6 points to +0.9. Production, shipments, and employment expanded. New orders, unfilled orders and inventories continued to contract, however.
Job openings declined slightly to 7.4 million in June from 7.7 million in May. The rate of people voluntarily quitting their job (a rough measure of workers’ confidence in the labor market) remained essentially unchanged, as did layoffs.
After dropping slightly in June, consumer confidence inched up in July, up 2.0 points to 97.2. Expectations improved across all three components – business conditions, employment prospects, and future income. Purchasing plans for both cars and homes declined a bit but remained relatively stable. In terms of big-ticket items, consumers leaned towards buying slightly more electronic goods, while plans for purchasing appliances appeared mixed.
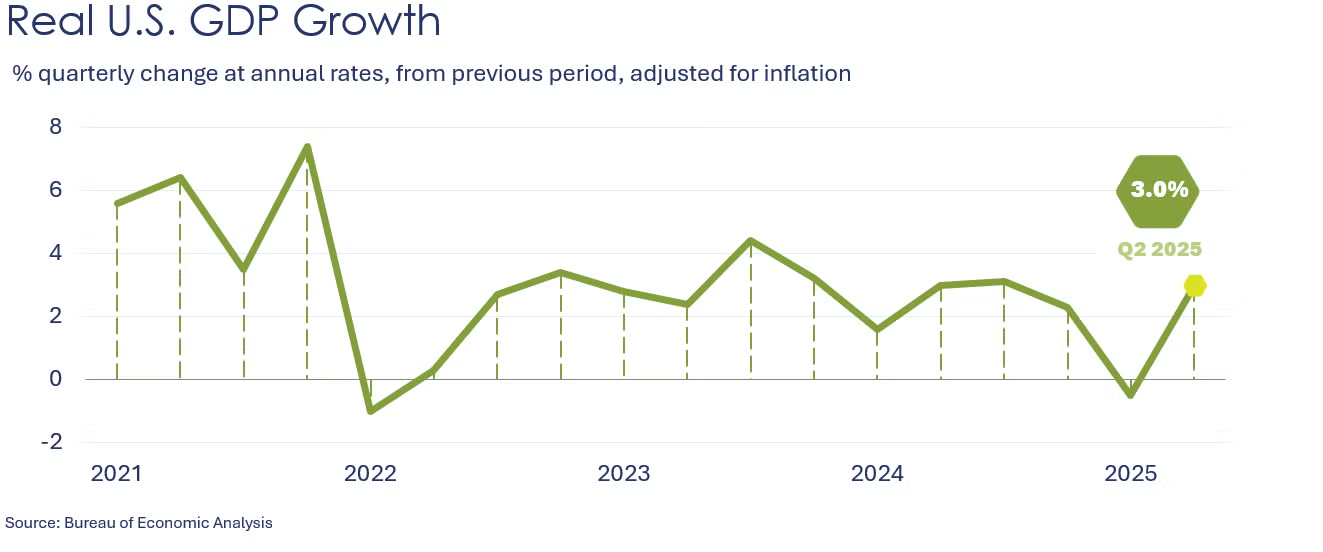
U.S. GDP advanced at a 3.0% seasonally adjusted annual rate during Q2, according the first of three estimates from the Bureau of Economic Analysis. The increase primarily reflected a decrease in imports (which raises GDP) and an increase in consumer spending. These gains were partly offset by decreases in exports and gross private domestic investment, with the latter being dragged down by a drop in residential and nonresidential structures.
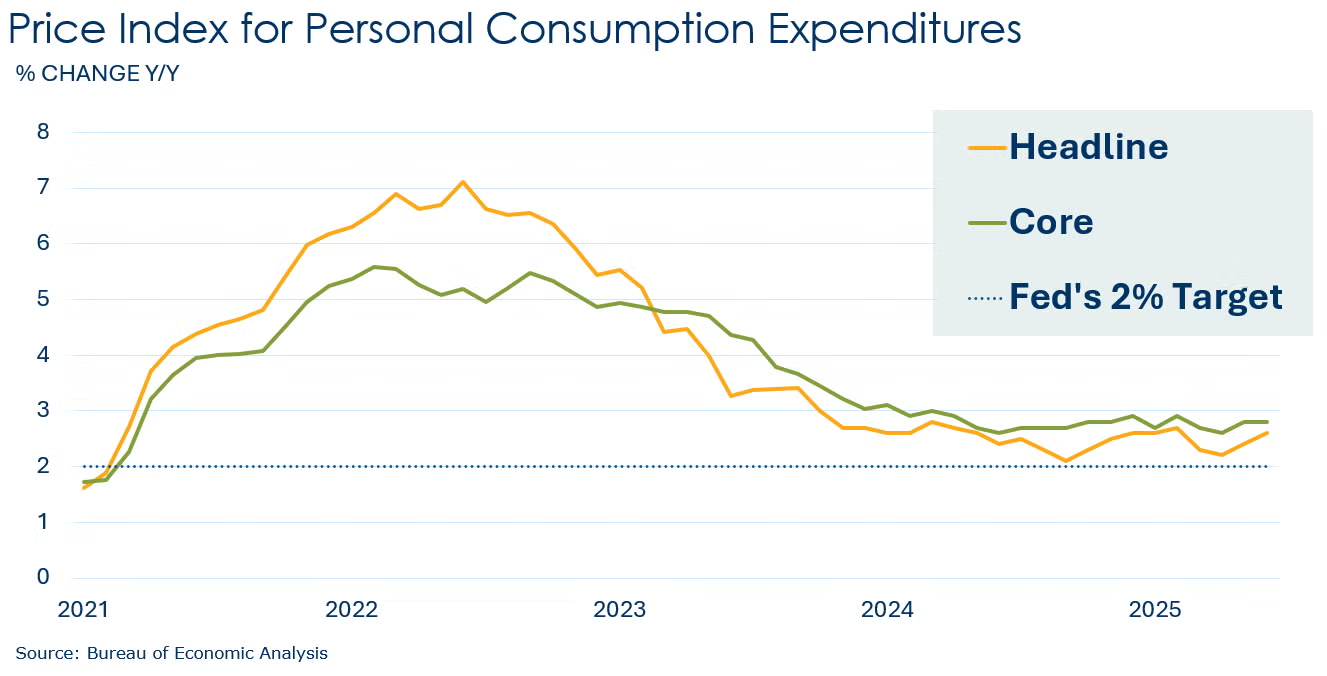
Consumer spending rose by 0.3% in June, bouncing back from a flat reading in May. The increase was propelled by a 0.7% jump in nondurable goods and a 0.3% rise in services, while spending on durable goods was unchanged. Personal income advanced 0.3%, recovering from a 0.4% drop in May. The increase was led by growth in government social benefits and employee compensation. The price index for personal consumption expenditures (PCE) leaped 2.6% Y/Y, higher than May’s 2.4% clip. Excluding the volatile food and energy components, the core PCE price index rose by a 2.8% Y/Y rate, replicating May’s Y/Y gain. Growth in the core PCE price index remains stuck in a narrow range around 2.6%-2.9% for the past year. The core PCE price index is the Fed’s preferred inflation measure and remains above its 2% target. Finally, the savings rate was unchanged in June from May’s reading of 4.5%.
Nonfarm payrolls increased by 73,000 in July, up from a 14,000 gain in June. Jobs in manufacturing fell, down by 11,000 after losing 15,000 in June. Construction jobs rose by 2,000 while the services sector added 96,000, led by healthcare, financial activities, and retail trade. Average hourly earnings rose 3.9% Y/Y, up from a 3.8% Y/Y increase in June. From the separate household survey, the unemployment rate ticked higher to 4.2%, staying within a narrow range of 4.0 percent to 4.2 percent since May 2024. The labor participation rate moved slightly lower to 62.2%, as it has trended down from the recent peak of 62.8% in November 2023.
Excluding April, construction spending fell for a tenth consecutive month in June, down 0.4% (the same decrease witnessed in May). The decline was led by a continued decline in spending on privately-funded residential and nonresidential projects. Publicly-funded construction edged slightly higher. Compared to a year ago, construction spending was down by 2.9% Y/Y.
The ISM Manufacturing PMI® slid one point in July to 48%, a level that indicates U.S. manufacturing contracted for a fifth consecutive month. New orders, order backlogs and employment continued to contract, but production expanded for the second straight month. Inventories continued to contract. Prices rose at a slower rate and delivery times contracted. Imports and export orders continued to contract, although imports did so at a slower rate. The average procurement lead times were flat production materials, while increasing slightly for capital expenditures and declining for MRO supplies. Seven manufacturing industries reported growth in July, including plastics and rubber products, while 10 reported contraction (including chemicals). Many of the comments continued to cite tariff uncertainty and the negative impact on planning for production and costs.
As widely expected, the Federal Open Market Committee (FOMC) held interest rates steady for a fifth consecutive time. For the first time since 1993, two Fed governors dissented from the majority, favoring a rate cut. The next meeting of the FOMC is in September.
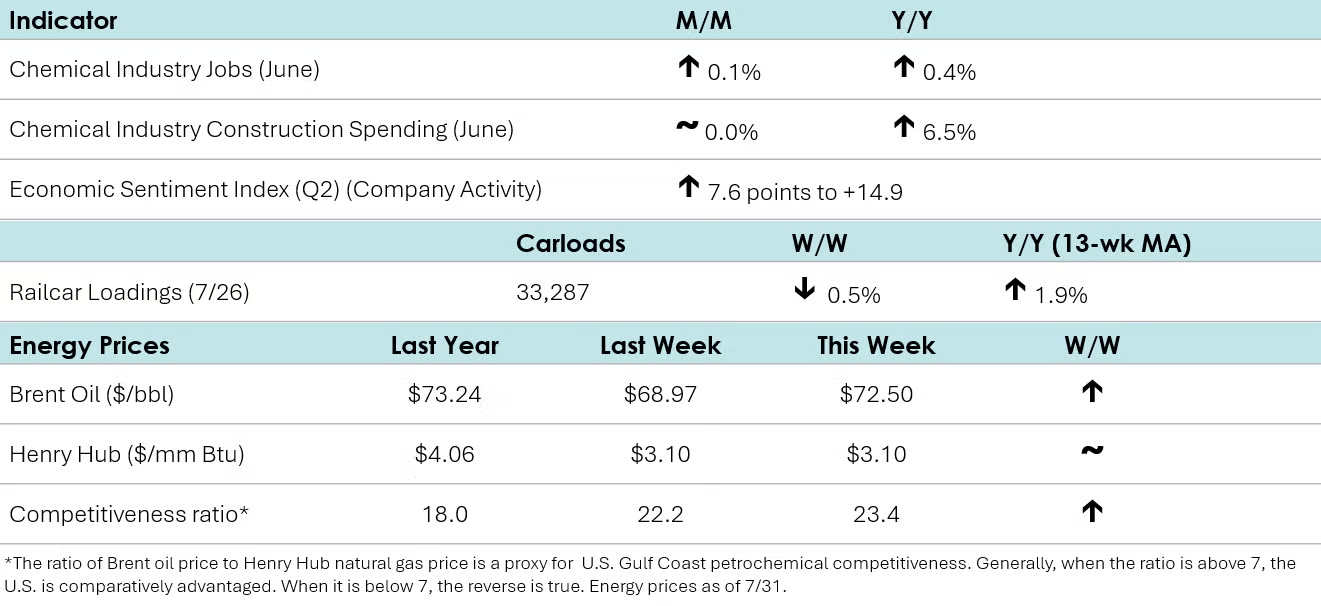
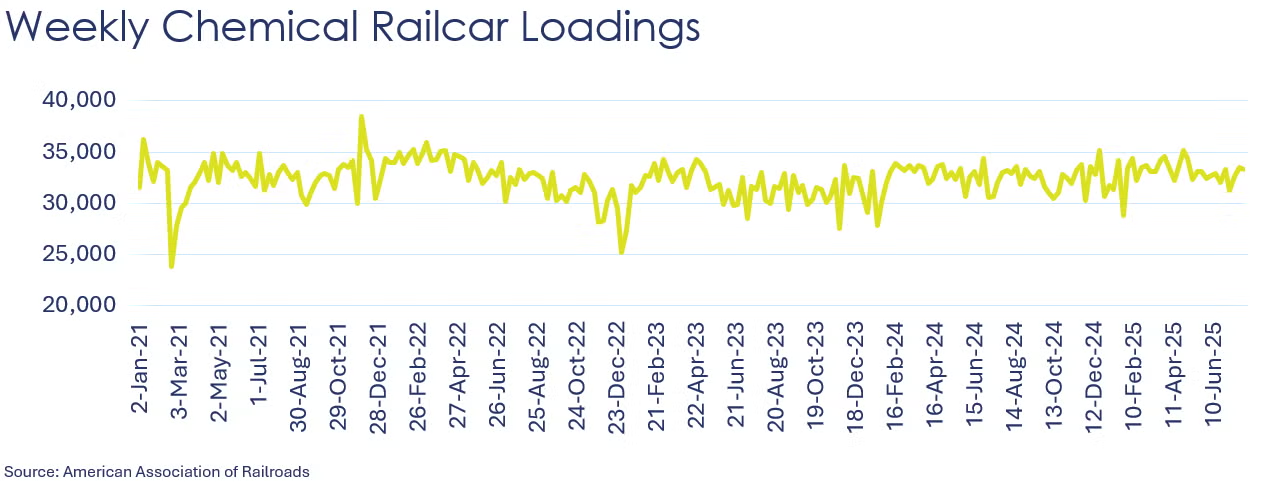
According to data released by the Association of American Railroads, chemical railcar loadings were down to 33,287 for the week ending 26 July. Loadings were up 1.9% Y/Y (13-week MA), up 1.8% YTD/YTD and have been on the rise for six of the last 13 weeks.
Among the comments in the Dallas Fed’s Texas Manufacturing Outlook Survey, one chemical manufacturing respondent noted: “Construction and automotive continue to have severe declines, leading to major impacts on the basic materials markets.”
Within the details of the ISM Manufacturing PMI® report, the chemical products sector was one of ten industries that reported contraction in July. Manufacturers of chemical products reported lower production, employment, inventories (with customers’ inventories being “too low”), backlog of orders, export orders and imports. On the flip side, the sector reported faster supplier deliveries.
Chemical industry construction spending was flat in June at a $42.2 billion seasonally adjusted annual rate. Compared to a year ago, spending on chemical manufacturing projects was up 6.5% Y/Y.
Chemical industry employment rose in June, up 0.1% to 549.5 (up 0.4% Y/Y). Employment in plastic resin manufacturing edged slightly higher, up by 0.6% to 62,400, a level 3.0% higher than last June. (Note that data at the detailed industry level are lagged one month behind the headline jobs report.)
In July, combined chemical and pharmaceutical jobs dropped by 1,100 to 902,400, a level up 0.4% Y/Y. The number of supervisory & non-production workers was flat while the number of production workers dipped. Average hourly earnings for production workers rose 3.9% Y/Y to $31.34. The average workweek dropped to 41.2 hours in July from 41.8 in June.
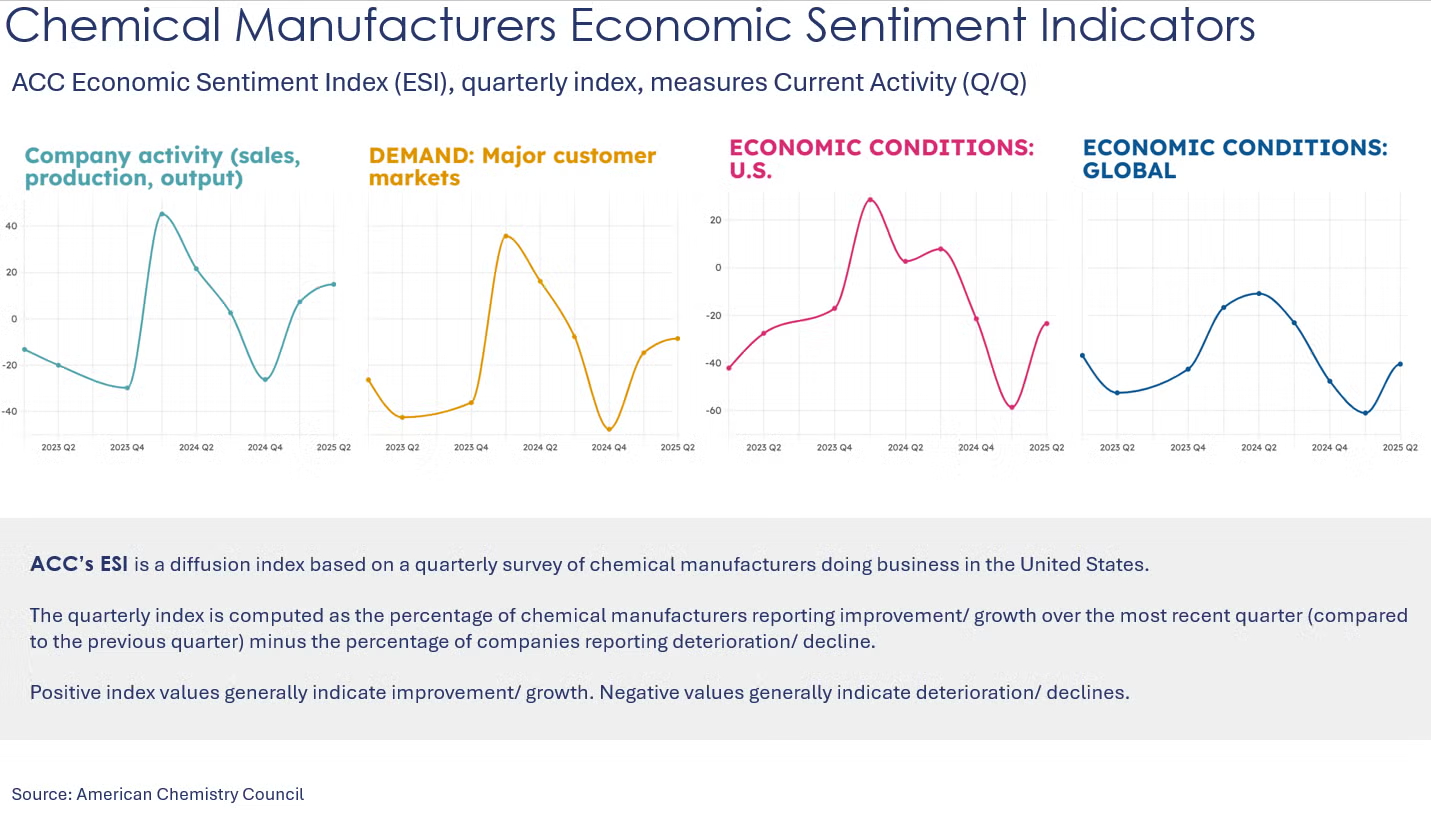
U.S. chemical manufacturers’ overall level of activity continued to improve in the second quarter and is expected to improve through the end of the year, according to companies participating in ACC’s quarterly Chemical Manufacturing Economic Sentiment Index Survey. ACC’s index, based on companies’ assessment of their activity level overall (e.g., sales, production, output), remained positive in Q2 despite chemical manufacturers reporting weak demand in major customer markets and challenging economic conditions in the U.S. and abroad. The majority of companies described major customer market demand as having flattened or deteriorated in Q2. The volume of new orders index rose in Q2, with an increase in domestic orders that was offset by a decline in foreign orders. While the expectation for many indicators remained negative six months ahead, the outlook was generally less pessimistic than during Q1.
Energy Wrap-Up
• Oil prices were higher than a week ago as the U.S. stepped up pressure on Russia to end the war in Ukraine and optimism following several recent trade deals were announced.
• U.S. natural gas prices were just essentially unchanged from a week ago.
• The combined oil & gas rig count fell by two to 537 at the end of last week.
For More Information
ACC members can access additional data, economic analyses, presentations, outlooks, and weekly economic updates through ACCexchange: https://accexchange.sharepoint.com/Economics/SitePages/Home.aspx
In addition to this weekly report, ACC offers numerous other economic data that cover worldwide production, trade, shipments, inventories, price indices, energy, employment, investment, R&D, EH&S, financial performance measures, macroeconomic data, plus much more. To order, visit http://store.americanchemistry.com/.
Every effort has been made in the preparation of this weekly report to provide the best available information and analysis. However, neither the American Chemistry Council, nor any of its employees, agents or other assigns makes any warranty, expressed or implied, or assumes any liability or responsibility for any use, or the results of such use, of any information or data disclosed in this material.
Contact us at ACC_EconomicsDepartment@americanchemistry.com.

