
Note: Consumer Price Index, Real Earnings, Producer Price Index, Retail Sales, Business Inventories, Housing Starts and Permits, Import and Export Prices, and Industrial Production and Capacity Utilization were scheduled for release this week but are unavailable due to the federal government shutdown. Where available, we will include alternative private-sector data in order to continue monitoring the U.S. economy.
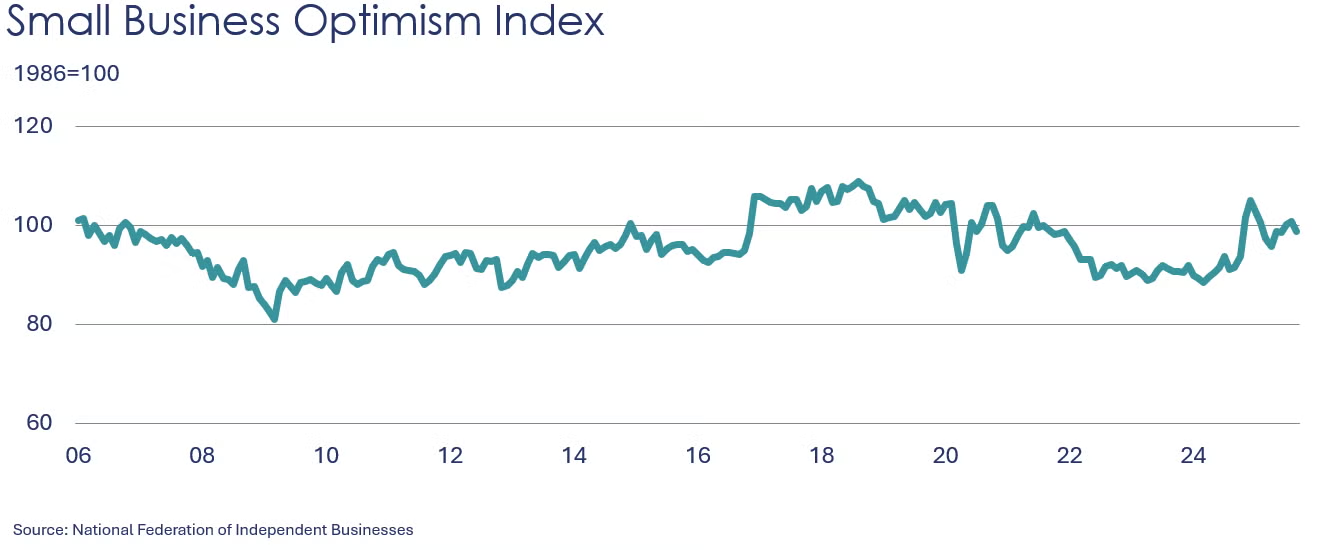
Following gains in July and August, the NFIB’s small business optimism index slipped 2.0 points in September to 98.8. Supply chain and inflation issues remained top of mind on Main Street. Up from August, nearly two-thirds (64%) of business owners reported that supply chain disruptions were impacting their business. Taxes and labor quality were tied for the most important business problem in September.
According to the NY Fed’s Empire State Manufacturing Survey, manufacturing activity increased modestly in New York State in October, recovering from September’s decline. The general business conditions index rose 19 points to 10.7, the third expansionary level in the last four months. The new orders, shipments, and employment indexes also climbed, with both input and selling prices accelerating. Although capital plans remained soft, firms became more optimistic about the outlook, with nearly half expecting improved conditions in the months ahead.
In contrast to the New York survey, manufacturing activity declined in the Philadelphia region, with the current general activity index losing 36 points to -12.8 in October, the lowest level since April, according to the Philadelphia Fed’s Manufacturing Business Outlook Survey. The shipments index dropped 20 points to 6.0, still indicating expansion, while the new orders index gained 6 points to 18.2. Employment and prices continued to increase, with the latter accelerating from the previous month. Expectations for activity over the next six months remained positive and actually improved from September’s reading. When asked about capital expenditures in 2026, 36% of firms indicated an increase in spending while 19% expected a decrease.
Homebuilder confidence improved in October as the NAHB/Wells Fargo Housing Market Index increased to its highest level since April, up 5 points to 37. Current sales activity, buyer traffic, and sales expectations for the next six months all posted gains. The survey revealed that 38% of builders cut prices in October, with the average price reduction coming in at 6%.
Fed Beige Book
Published two weeks in advance of each FOMC meeting, the Beige Book presents a summary of recent economic conditions around the twelve Federal Reserve districts.
• Economic activity changed little on balance since the previous report, with three Districts reporting slight to modest growth in activity, five reporting no change, and four noting a slight softening.
• Overall consumer spending, particularly on retail goods, inched down in recent weeks, although auto sales were boosted in some Districts by strong demand for electric vehicles ahead of the expiration of a federal tax credit at the end of September.
• Demand for leisure and hospitality services by international travelers fell further over the reporting period, while demand by domestic consumers was largely unchanged. Nevertheless, spending by higher-income individuals on luxury travel and accommodation was reportedly strong.
• Several reports highlighted that lower- and middle-income households continued to seek discounts and promotions in the face of rising prices and elevated economic uncertainty.
• Manufacturing activity varied by District, and most reports noted challenging conditions due to higher tariffs and waning overall demand.
• Activity in agriculture, energy, and transportation was generally down among reporting Districts.
• Conditions in the financial services sector and other interest rate-sensitive sectors, such as residential and commercial real estate, were mixed; some reports noted improved business lending in recent weeks due to lower interest rates, while other reports continued to highlight muted activity.
• The outlook for future economic growth varied by District and sector. Sentiment reportedly improved in a few Districts, with some contacts expecting an uptick in demand over the next 6 to 12 months. However, many others continued to expect elevated uncertainty to weigh down activity.
• One District report highlighted the downside risk to growth from a prolonged government shutdown.
Among the detailed comments related to chemicals in the Fed’s Beige book, the Dallas Fed noted “Among nondurables, food manufacturing continued to see strong gains, while chemical production held steady as trade policy and global oversupply put downward pressure on export demand for basic chemicals.”
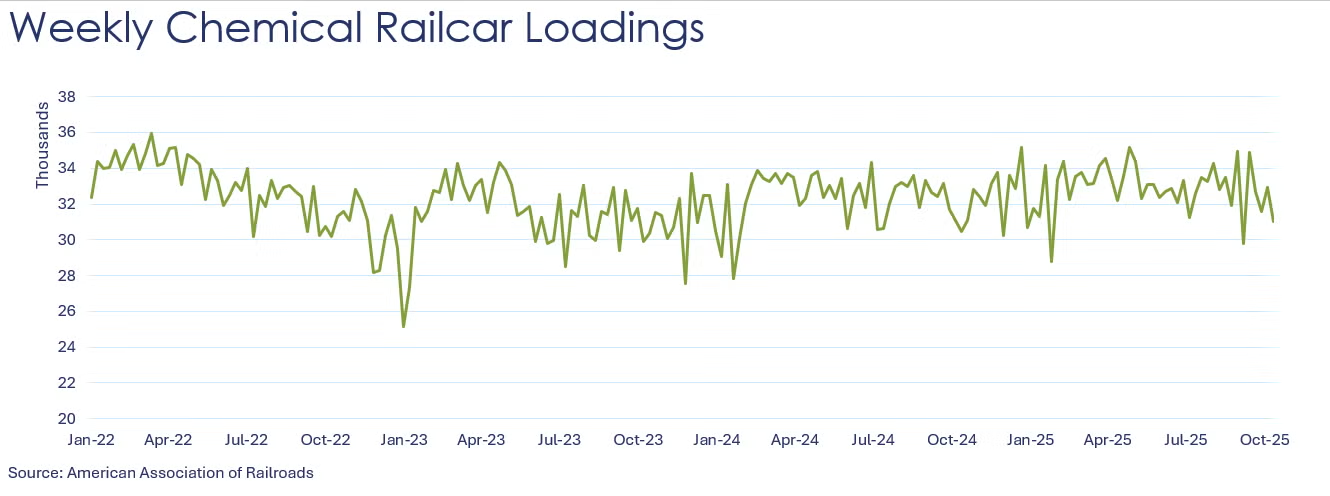
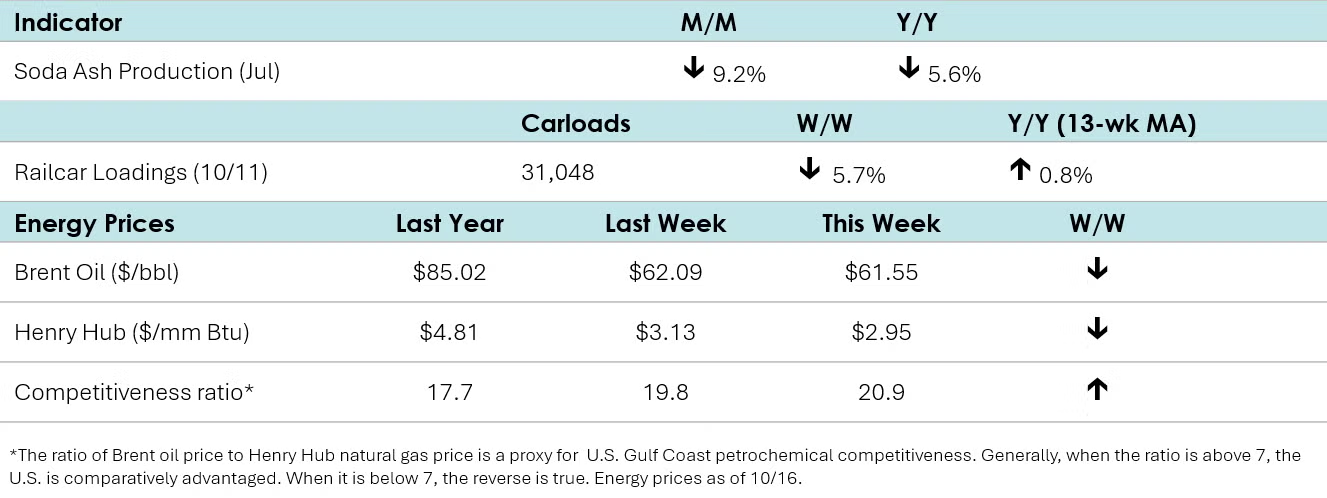
According to data released by the Association of American Railroads, chemical railcar loadings fell to 31,048 for the week ending October 11th. Loadings were up 0.8% Y/Y (13-week MA), up 1.6% YTD/YTD and have been on the rise for six of the last 13 weeks.
Soda ash production fell by 9.2% in July to 963,000 metric tons. Compared to a year ago, soda ash production was off 5.6%. Inventories at the end of July also moved lower, down 6.6% from June’s recent high level to 408,000 metric tons. Soda ash is used in glass, aluminum, detergents and other chemicals.
Energy Wrap-Up
• Oil prices eased this week on a peace deal in Gaza and new IEA forecasts projecting an increased supply gut for 2025 and 2026.
• Natural gas prices fell below the $3 mark following a solid storage build last week.
• The combined oil & gas rig count fell by two to 538.
For More Information
ACC members can access additional data, economic analyses, presentations, outlooks, and weekly economic updates through ACCexchange: https://accexchange.sharepoint.com/Economics/SitePages/Home.aspx
In addition to this weekly report, ACC offers numerous other economic data that cover worldwide production, trade, shipments, inventories, price indices, energy, employment, investment, R&D, EH&S, financial performance measures, macroeconomic data, plus much more. To order, visit http://store.americanchemistry.com/.
Every effort has been made in the preparation of this weekly report to provide the best available information and analysis. However, neither the American Chemistry Council, nor any of its employees, agents or other assigns makes any warranty, expressed or implied, or assumes any liability or responsibility for any use, or the results of such use, of any information or data disclosed in this material.
Contact us at ACC_EconomicsDepartment@americanchemistry.com.

