Note: International Trade and Wholesale Trade were scheduled for release this week but are unavailable due to the federal government shutdown. Where available, we will include alternative private-sector data in order to continue monitoring the U.S. economy.
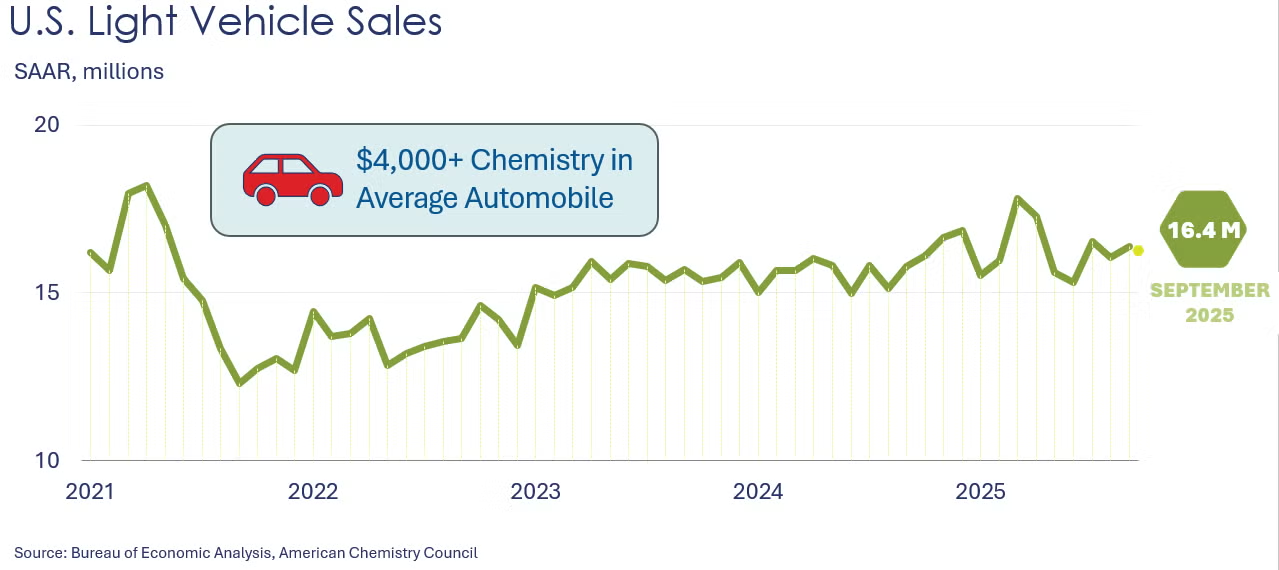
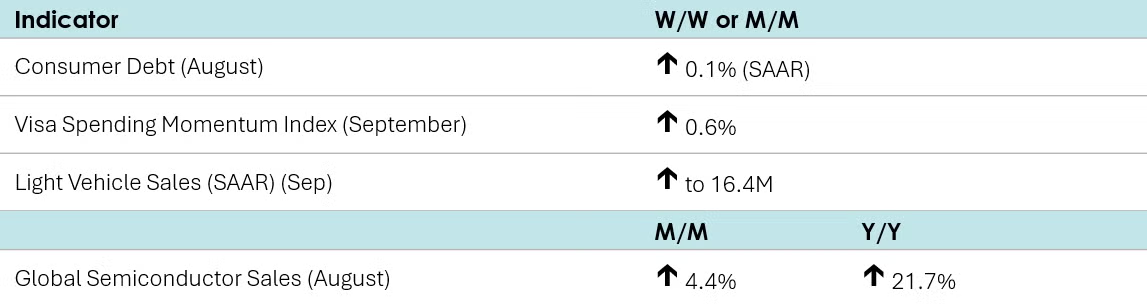
According to the National Automobile Dealers Association (NADA), light vehicle sales rose to a 16.4 million seasonally adjusted annual rate (SAAR) in September, up from 16.1 million in August. The increase was driven by a surge in sales of electric vehicles, as tax credits expired at the end of September. Electric vehicles made up a record high 11.8% of vehicle sales in September.
Borrowing was essentially flat in August as consumer debt rose 0.1% annual rate, after gaining an upwardly revised 4.3% in July. Credit card balances fell 5.5% after jumping 10.3% in July, while balances on nonrevolving debt, such as student loans and car loans, leaped 2.0%, on top of a 2.2% rise in July.
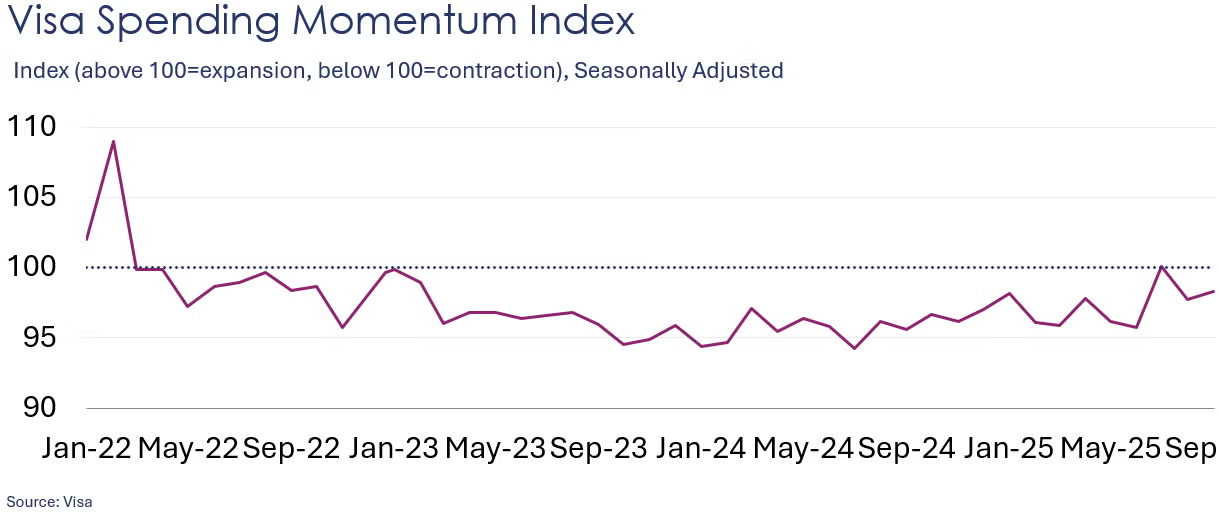
The headline Visa Spending Momentum Index (SMI) moved up in September, rising from 97.7 in August to 98.3, or 0.6%. Except for July of this year, SMI has been below 100 since March 2022, indicating weakness in spending by US consumers (index values above 100 signal strengthening momentum). Nevertheless, the index has been trending higher since it bottomed out at 94.3 in July 2024. SMI is an economic indicator measuring consumer spending based on purchasing data from Visa-branded credit and debit cards.
Global semiconductor sales rose 4.4% in August to $64.9 billion. All regions gained with the largest percentage increases in the Americas and Asia Pacific (excl. China & Japan). Compared to a year ago, sales were up 21.7% Y/Y. The most basic computer chip uses over 500 different chemicals in its creation, with advanced chips using even more high-purity chemistries.
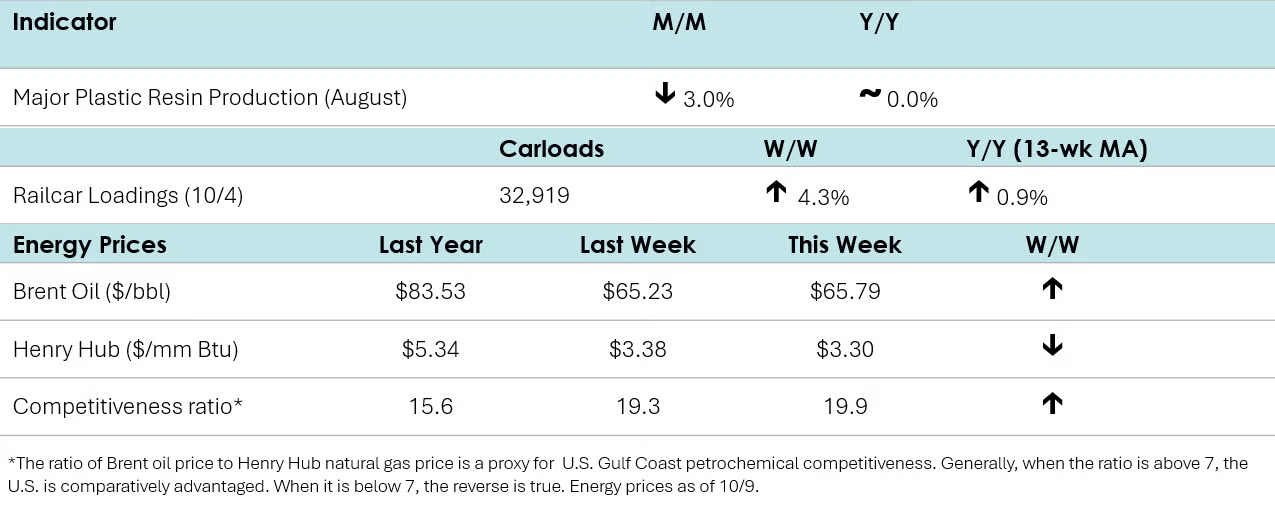
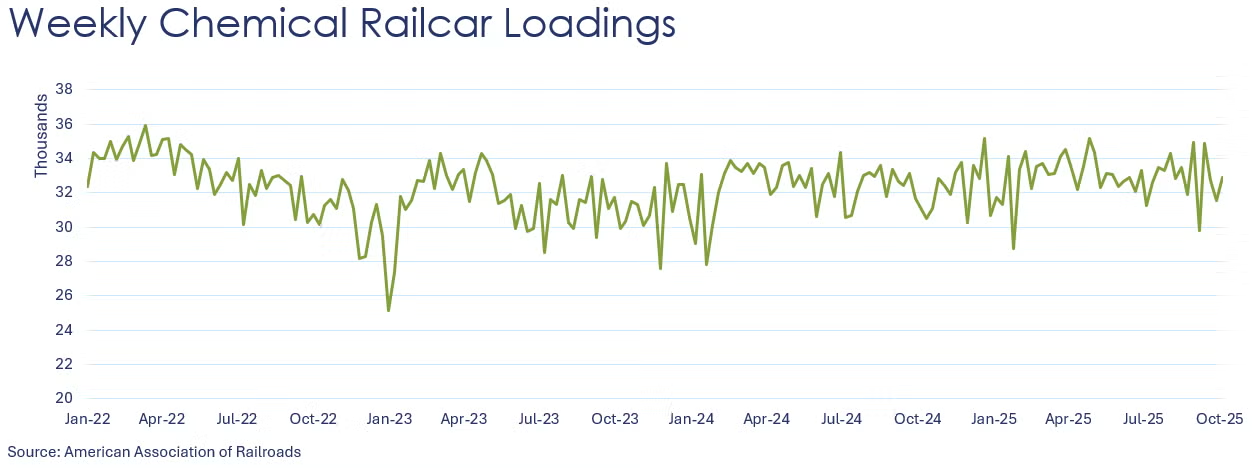
According to data released by the Association of American Railroads, chemical railcar loadings were up to 32,919 for the week ending October 4th. Loadings were up 1.6% Y/Y (13-week MA), up 0.9% YTD/YTD and have been on the rise for seven of the last 13 weeks.
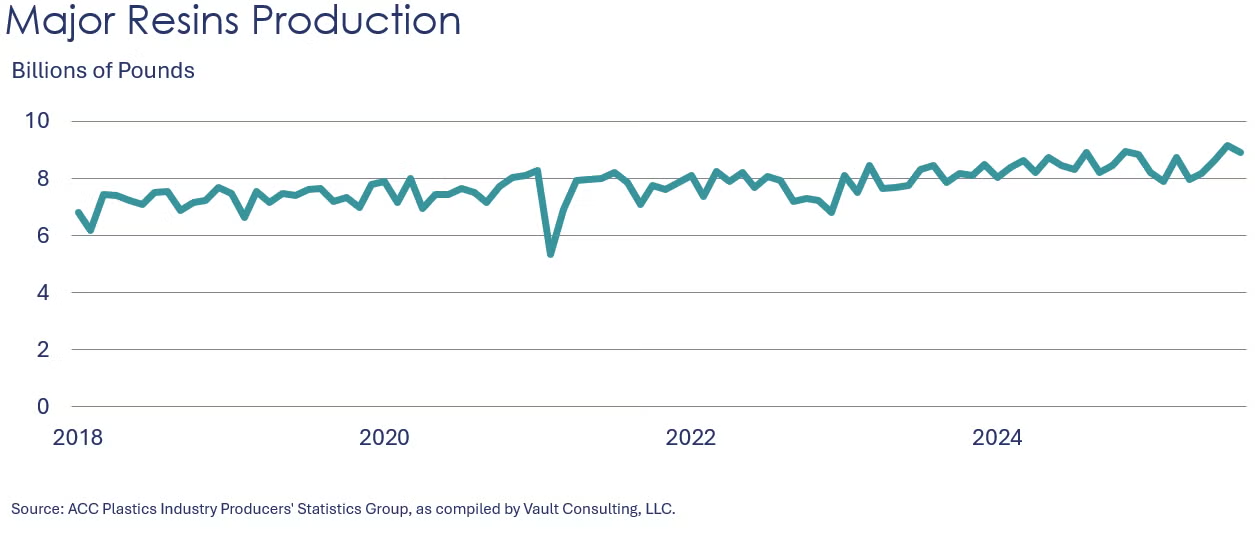
U.S. production of major plastic resins totaled 8.9 billion pounds in August, a decrease of 3.0% compared to the prior month, but flat compared to the same month in 2024, according to ACC. Year-to-date production was 67.6 billion pounds, essentially the same compared to the same period in 2024.
Sales and captive (internal) use of major plastic resins totaled 8.6 billion pounds during August, a decrease of 1.7% compared to the prior month, and a 2.7% increase from the same month one year earlier. Year-to-date sales and captive use were 67.4 billion pounds, ahead by 0.2% compared to the same period in 2024.
Energy Wrap-Up
• Oil prices were slightly higher compared to a week ago despite the ceasefire in Gaza and an OPEC+ announcement to move forward with an incremental production hike for November.
• Natural gas prices edged slightly lower on a solid 80BCF inventory gain.
• The combined oil & gas rig count fell by one to 540.
For More Information
ACC members can access additional data, economic analyses, presentations, outlooks, and weekly economic updates through ACCexchange: https://accexchange.sharepoint.com/Economics/SitePages/Home.aspx
In addition to this weekly report, ACC offers numerous other economic data that cover worldwide production, trade, shipments, inventories, price indices, energy, employment, investment, R&D, EH&S, financial performance measures, macroeconomic data, plus much more. To order, visit http://store.americanchemistry.com/.
Every effort has been made in the preparation of this weekly report to provide the best available information and analysis. However, neither the American Chemistry Council, nor any of its employees, agents or other assigns makes any warranty, expressed or implied, or assumes any liability or responsibility for any use, or the results of such use, of any information or data disclosed in this material.
Contact us at ACC_EconomicsDepartment@americanchemistry.com.


