Running tab of macro indicators: 10 out of 20
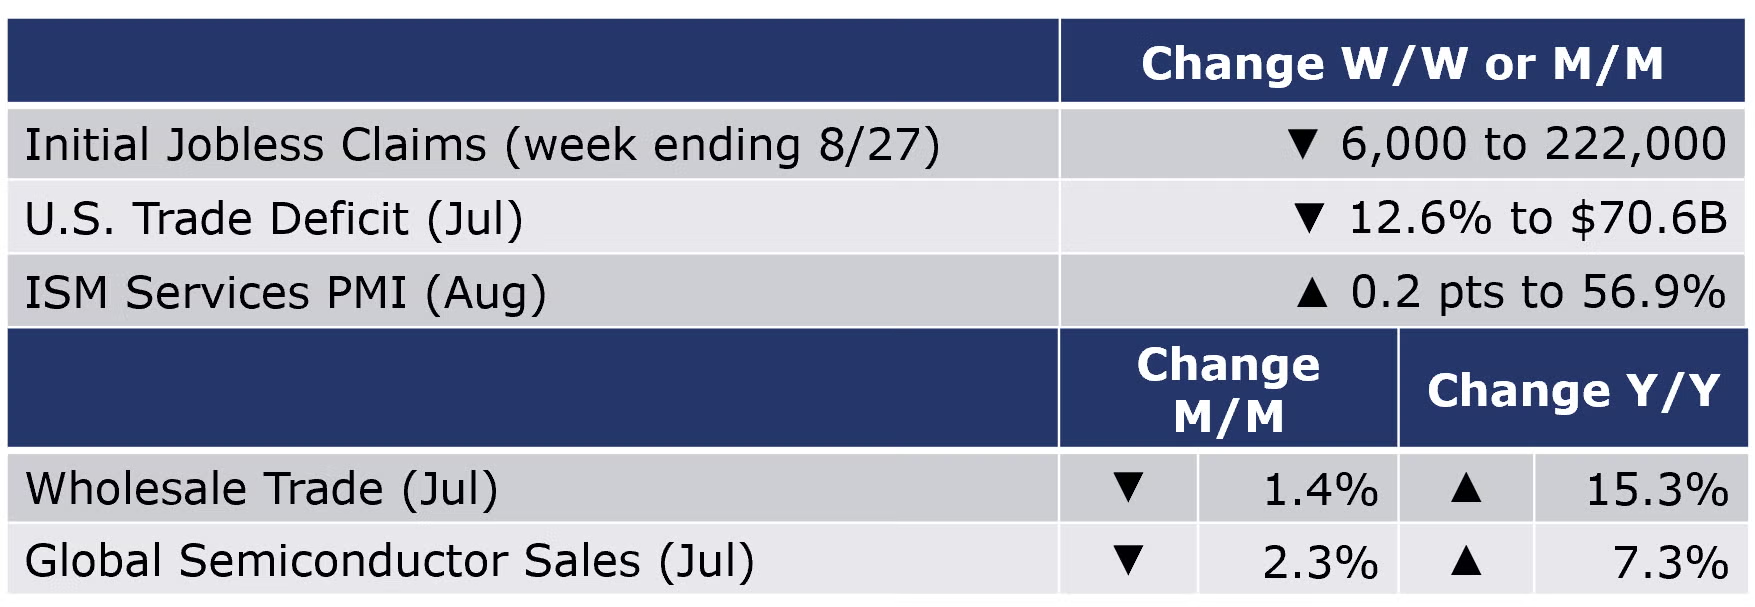
The number of new jobless claims fell by 6,000 during the week ending 8 September to 222,000 – decreasing for the 5th week in a row. Continued claims edged up to 1,473,000 from 1,437,000. The insured unemployment rate for the week ending 27 August was unchanged at 1.0%.
The U.S. trade deficit narrowed to $70.6 billion in July as the monthly rise in exports combined with a decline in imports. Exports were up 0.2% to $259.3 billion while imports were down 2.9% to $329.9 billion. Exports of goods increased driven by higher exports of passenger cars, nonmonetary gold, telecommunications equipment, computer accessories and other industrial machinery. The decline in imported goods reflects lower imports of consumer goods (including pharmaceutical preparations) and industrial supplies and materials which more than offset a gain in imports of automotive vehicles, parts, and engines. Imports from China, the largest source of U.S. imported goods, decreased in July.
Following 10 months of consecutive gains, wholesale trade eased in July, down 1.4%. The largest gains were in sales of lumber, electrical equipment, alcohol, and chemical products. In addition to sharply lower sales of petroleum products (due in large part to lower oil prices in July), there were declines in sales of farm products, metals and apparel. Inventories continued expand, but at a slower 0.6% pace, with broad gains across durable goods segments (except for a decline in lumber inventories). Inventories of nondurable goods were mixed with gains in apparel, chemicals, alcohol, and paper offsetting declines in pharmaceuticals, farm products and petroleum prices. Compared to a year ago, inventories were ahead by 25.1% Y/Y while sales were up 15.3%. The inventories-to-sales ratio rose from 1.26 in June to 1.29 in July, which was up from 1.19 a year earlier.
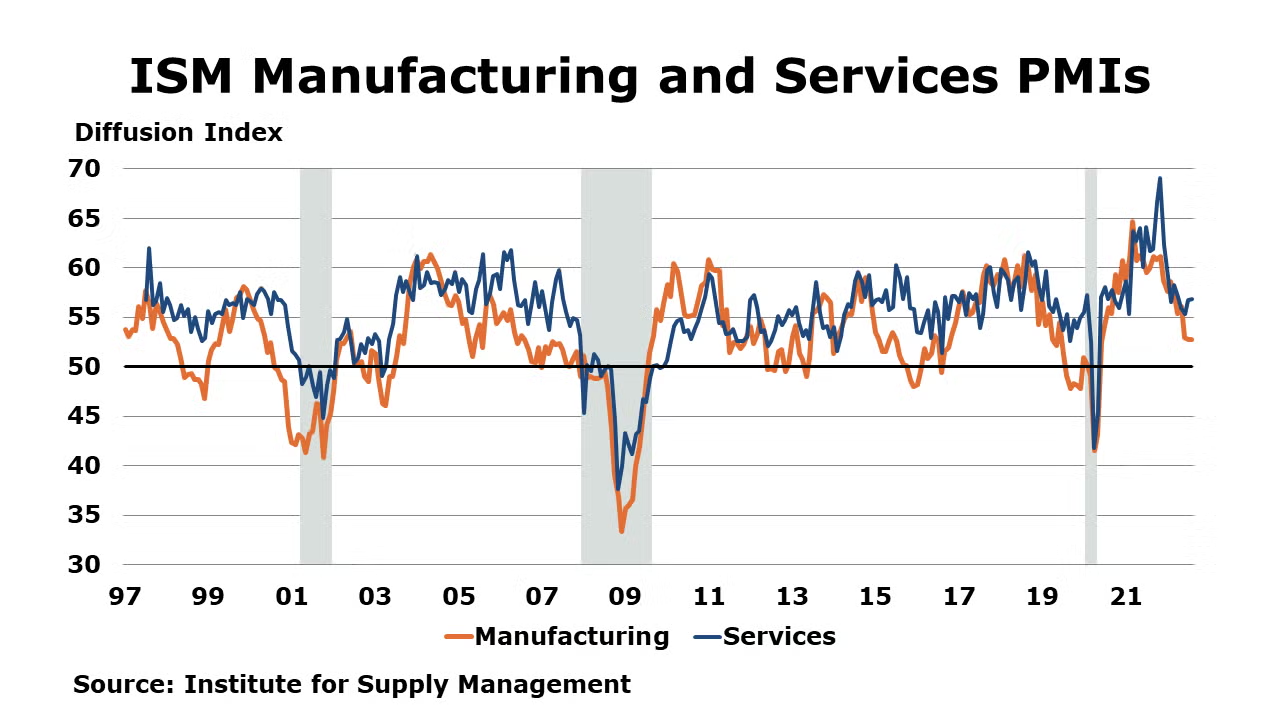
The Institute for Supply Management (ISM) reported that the August Services PMI registered 56.9%, up 0.2 percentage points from July. The result beats expectation and is also the highest reading since April. The index continues to show a robust recovery in services with a 27-month growth since the COVID recession with 14 out of 18 sectors reporting growth. According to ISM, the increase in services sector growth was due to an expansion in business activity and new orders. Employment moved up even though many industries were facing labor shortages. Order backlogs improved and inventories continue to move down. Supplier deliveries eased and so did price pressures. According to the comments, there were some supply chain, logistics and cost improvements but material shortages remain.
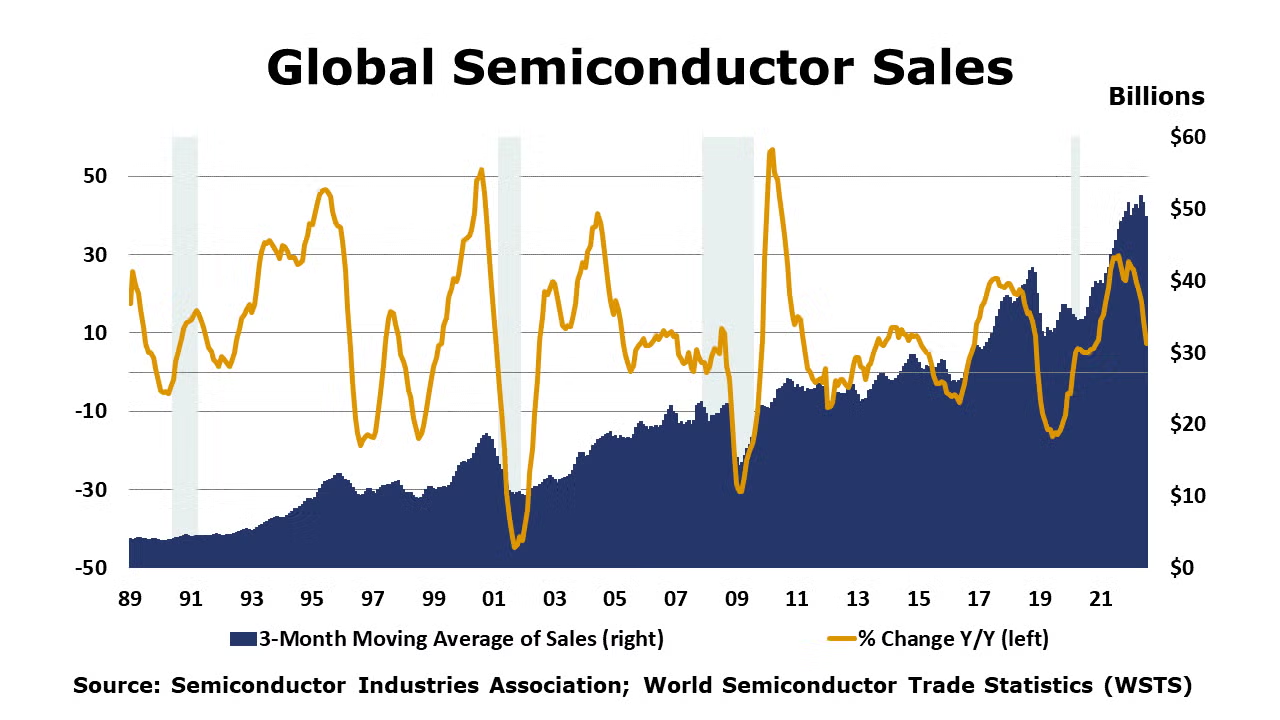
Global semiconductor sales fell 2.3% in July with declines in the Americas and Asia outpacing gains in Europe and Japan. Compared to a year ago, sales remained ahead by 7.3% with the largest Y/Y gain in the Americas region.
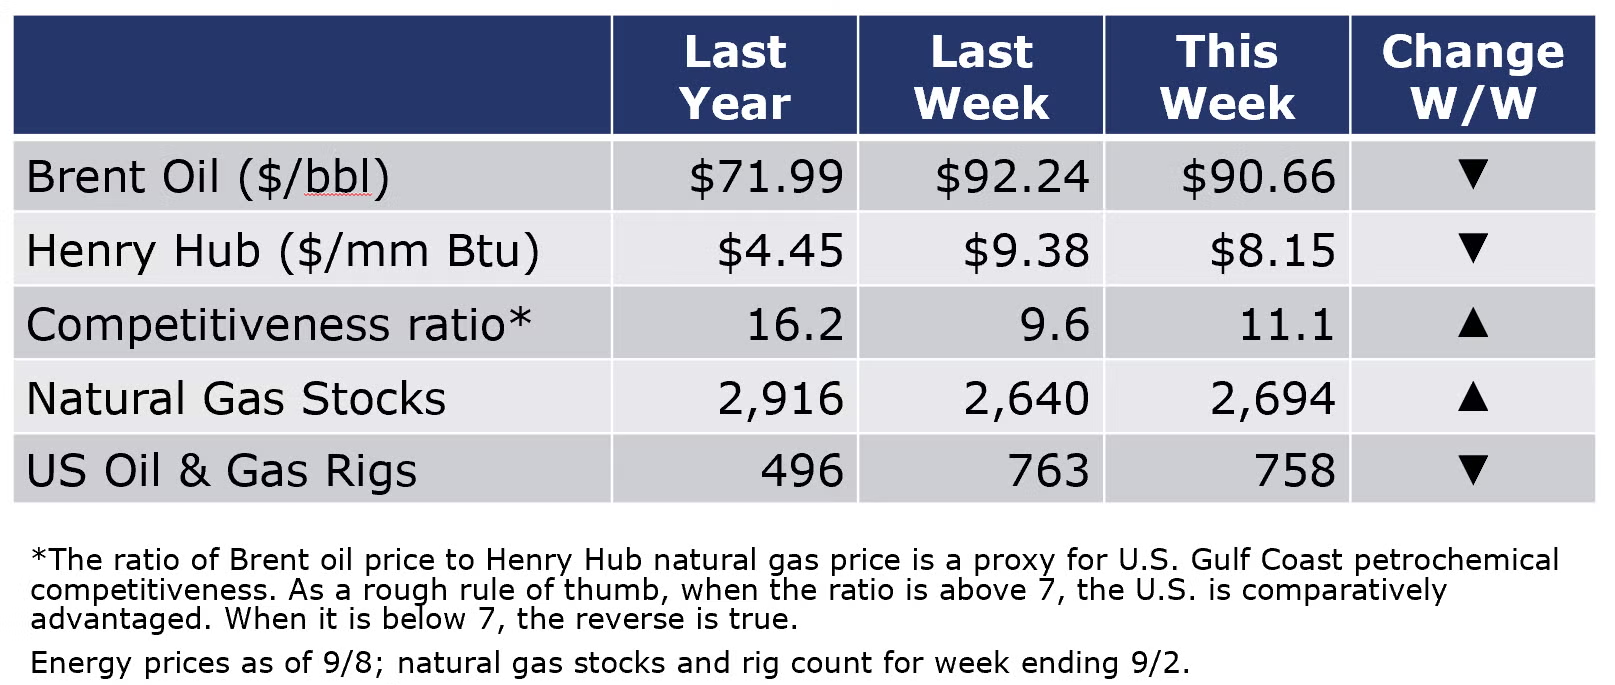
Oil prices slid to their lowest levels since Russia invaded Ukraine this week on poor economic data from China (the world’s largest oil importer). Natural gas prices were also lower. The combined oil and rig count fell by five to 758 during the week ending 9/2.
For the business of chemistry, the indicators still bring to mind a yellow banner for basic and specialty chemicals.
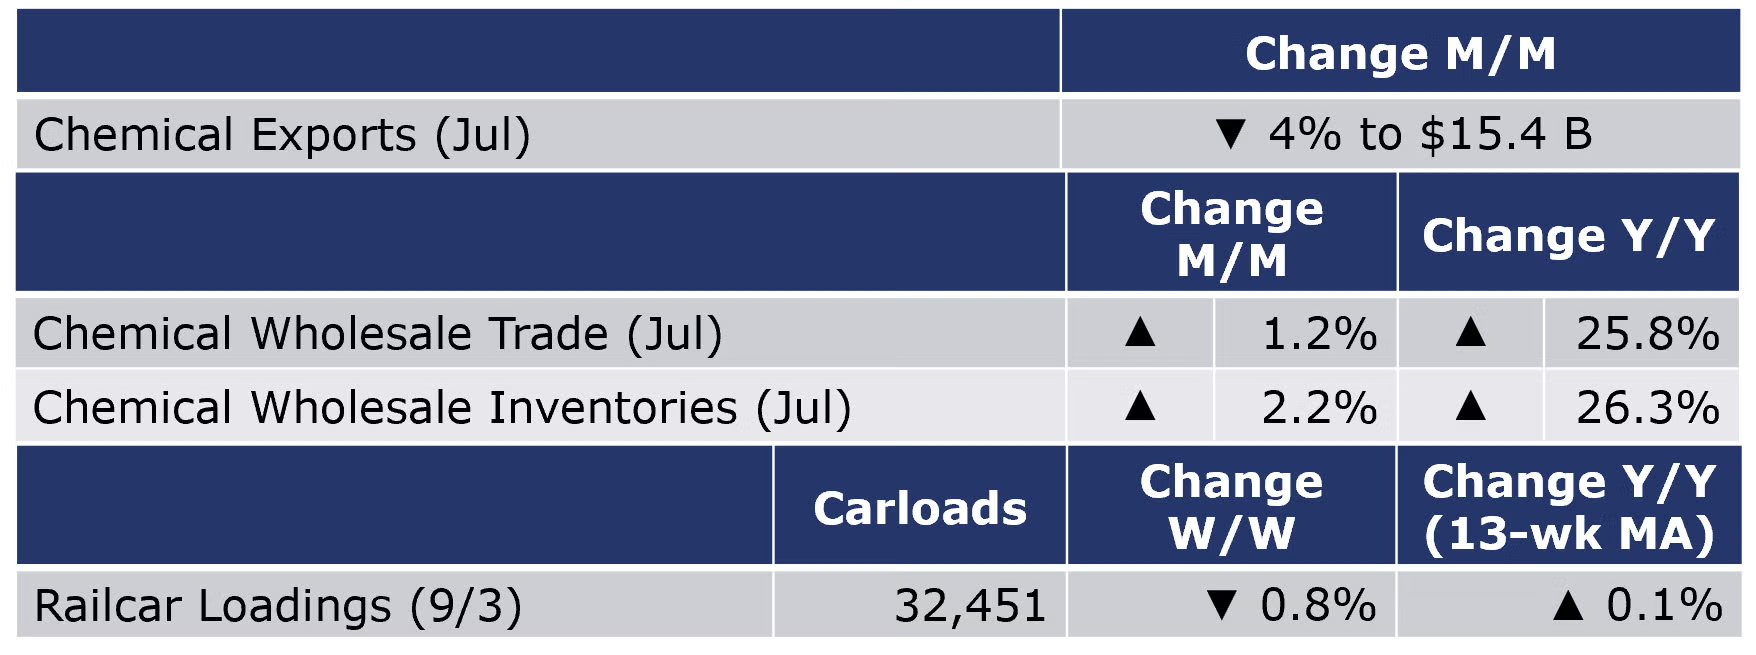
According to data released by the Association of American Railroads, chemical railcar loadings were down 0.8% to 32,451 during the week ending 3 September. After 7 weeks of declines, loadings were up 0.1% Y/Y (13-week MA). Loadings were up 3.6% YTD/YTD and have been on the rise for 7 of the last 13 weeks.
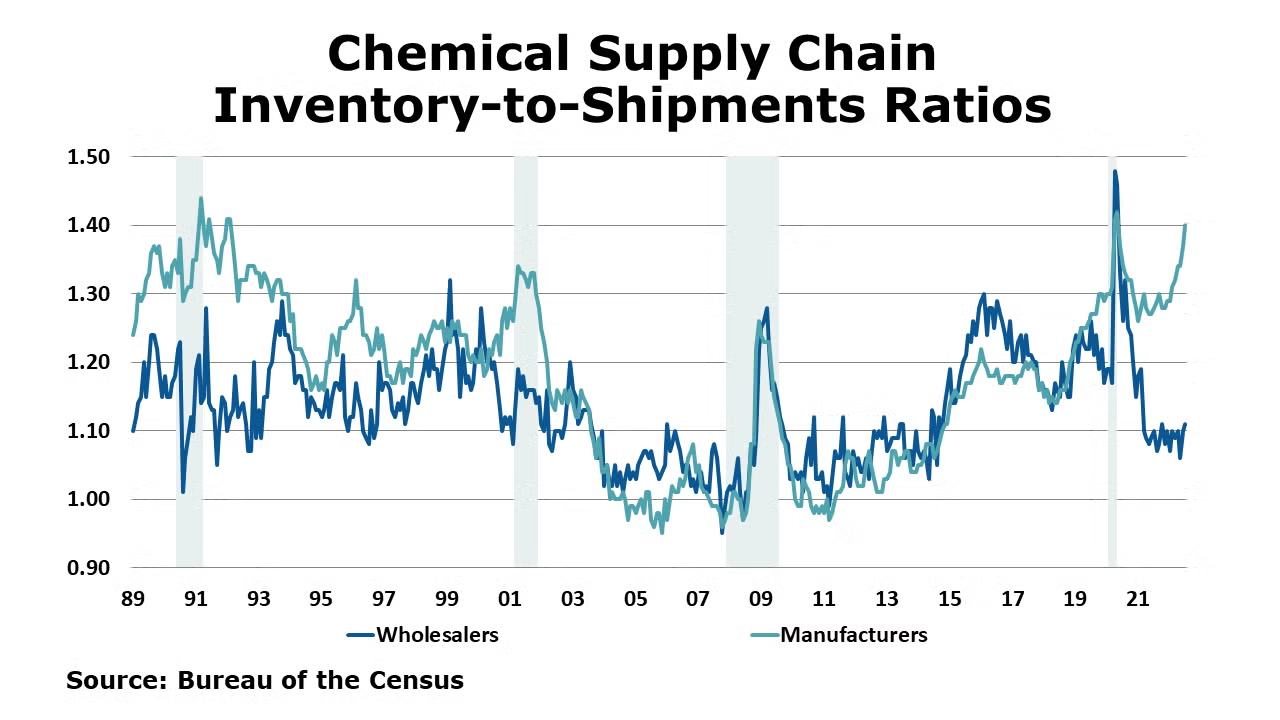
Following a 0.4% gain in June, wholesale sales of chemicals rose 1.2% in July. Chemical wholesale inventories also continued to climb, up 2.2%. Compared to last July, sales were up 25.8% while inventories were up 26.3%. The inventories-to-sales ratio for chemicals rose to 1.11 in July from 1.10 in June. A year earlier, the ratio was 1.11. At the wholesale level, inventories remained somewhat lean heading into Q3.
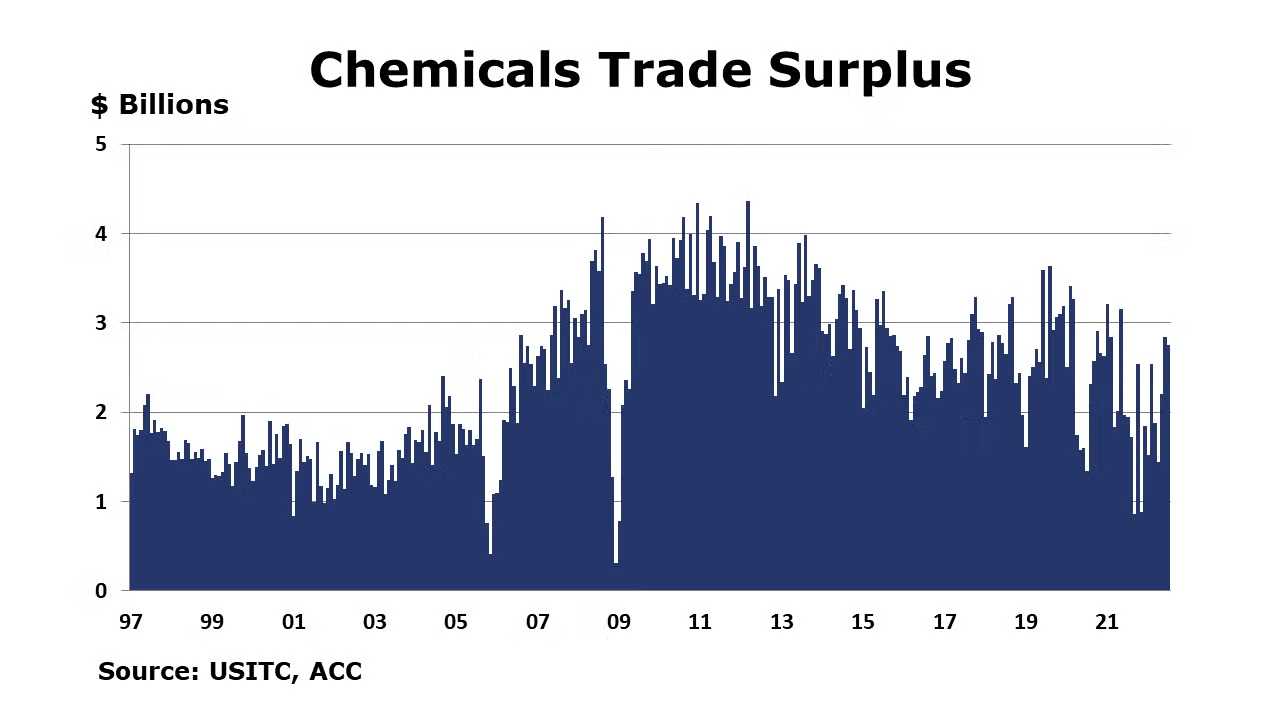
Total chemicals trade fell 4% in July to $28 billion. Compared to the same period last year (Jan-July), trade so far this year is 25% higher. Both imports and exports fell 4% in July. Chemical exports are up 18% Y/Y and up 22% YTD/YTD. Though there were declines across most sectors in July, all categories of chemical exports are higher compared to a year before. With exports of $15.4 billion and imports of $12.6 billion in July, the U.S. chemical trade balance was a surplus of $2.8 billion in July and was $15.2 billion YTD (as of July).
Note On the Color Codes
The banner colors represent observations about the current conditions in the overall economy and the business chemistry. For the overall economy we keep a running tab of 20 indicators. The banner color for the macroeconomic section is determined as follows:
Green – 13 or more positives
Yellow – between 8 and 12 positives
Red – 7 or fewer positives
For the chemical industry there are fewer indicators available. As a result we rely upon judgment whether production in the industry (defined as chemicals excluding pharmaceuticals) has increased or decreased three consecutive months.
For More Information
ACC members can access additional data, economic analyses, presentations, outlooks, and weekly economic updates through MemberExchange.
In addition to this weekly report, ACC offers numerous other economic data that cover worldwide production, trade, shipments, inventories, price indices, energy, employment, investment, R&D, EH&S, financial performance measures, macroeconomic data, plus much more. To order, visit http://store.americanchemistry.com/.
Every effort has been made in the preparation of this weekly report to provide the best available information and analysis. However, neither the American Chemistry Council, nor any of its employees, agents or other assigns makes any warranty, expressed or implied, or assumes any liability or responsibility for any use, or the results of such use, of any information or data disclosed in this material.
Contact us at ACC_EconomicsDepartment@americanchemistry.com

