Running tab of macro indicators: 10 out of 20
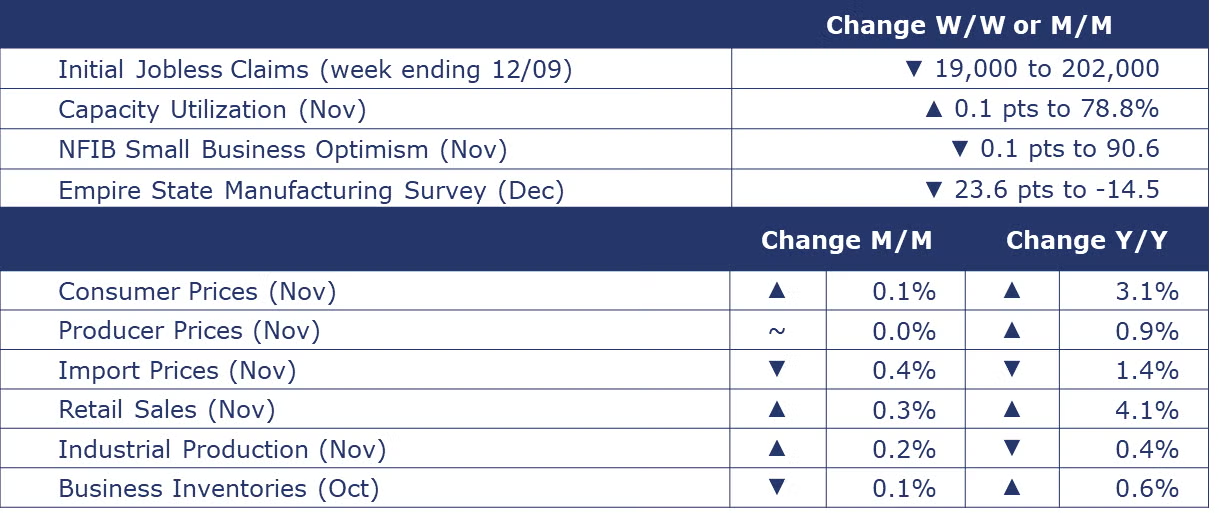
The number of new jobless claims fell by 19,000 to 202,000 during the week ending December 9th. Continuing claims increased by 291,769 to 1.871 million, and the insured unemployment rate for the week ending December 2nd was up 0.1 point to 1.3%.
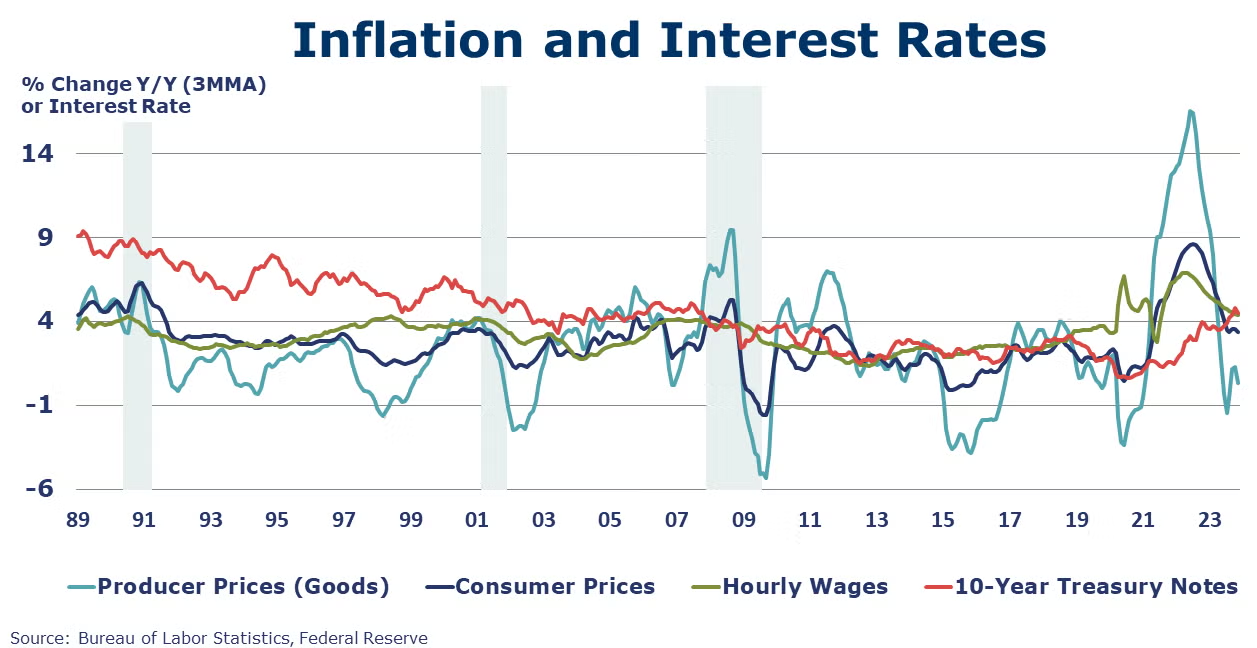
Overall inflation, measured by the Consumer Price Index (CPI), rose 0.1% in November and moderated to a 3.1% annual rate. The annual rate comparison has come down considerably from the 9% peak in June 2022 but has bounced stubbornly between 3-4% since June, well above the Fed’s 2% target. Core inflation, measured by the core CPI, which excludes changes in food and energy prices, rose 0.3% in November and rose at a 4.0% annual rate. Energy prices were down 2.3% in November and down 5.4% Y/Y. New vehicle prices softened slightly (-0.1%) while prices on used cars and trucks were up 1.6% following 5 straight months of decline. Grocery prices (food at home prices) rose 0.1% in November and were up 1.7% Y/Y. For the fourth straight month, rent rose another 0.5% and was up 6.9% Y/Y.
Producer prices held steady in November due to lower prices for energy, trade, and transportation and warehousing services which were offset by gains elsewhere (including foods). Core producer prices for goods edged slightly higher by 0.2%. Headline producer prices were up 0.9% Y/Y while core prices were up 2.5% Y/Y.
U.S. import prices declined 0.4% in November. The decline was driven by a 5.6% drop in imported fuel costs as lower petroleum prices more than offset higher natural gas prices. Prices for imported fuel declined 10.3% over the past year. The import price index has declined for ten months straight, falling 1.4% over the 12 months period ending November 2023. U.S. export prices fell 0.9% in November following a 0.9% decline in October. Export prices have declined 5.2% over the past year.
Retail sales rose 0.3% in November, following a downwardly revised 0.2% decrease in October. Compared to a year ago, sales were up 4.1%. The largest M/M increases were in food services & drinking places (up 1.6%); sporting goods, hobby, musical instrument, & bookstores (up 1.3%); and non-store retailers (up 1.0%). Gas stations (down 2.9%) and department stores (down 2.5%) saw the biggest declines. Compared to a year ago, several sectors saw double-digit growth, including electronics & appliance stores; health & personal care stores; non-store retailers; and food services & drinking places.
Combined business sales for manufacturers, retailers and wholesalers fell 1.0% in October. Sales were down 0.2% Y/Y. Business inventories were nearly the same level, down 0.1% over the month and 0.6% higher on a Y/Y basis. As a result, the business inventories-to-sales ratio was 1.37 in October, up slightly from 1.36 from the same time last year.
Following a 0.9% decline in October, industrial production rose 0.2% in November. A strong rebound in motor vehicle production (following the end of the 6-week UAW strike) and higher production in aerospace, computers & electronics and machinery offset weakness in other categories. The largest declines were in apparel, textiles, paper, wood products, and miscellaneous manufacturing. Compared to a year ago, overall industrial production was off by 0.4%. Capacity utilization tightened slightly from 78.7% in October to 78.8% in November. Last November, capacity utilization was 80.3%. Over the past year, industrial capacity has increased by 1.5%.
Small business optimism continues to fall. The NFIB’s Small Business Optimism Index declined 0.1 point to 90.6 in November, marking the 23rd consecutive month with a reading below its historical average. The most important problems for small business owners are inflation and quality of labor. Not being able to fill job openings is a challenge for 40% of owners and 93% of those trying to hire reported few or no qualified applicants for positions their open positions. Less owners report growing sales (nominal) and more owners report inventory gains. The outlook for six months ahead improved but remains negative.
SURVEY OF ECONOMIC FORECASTERS
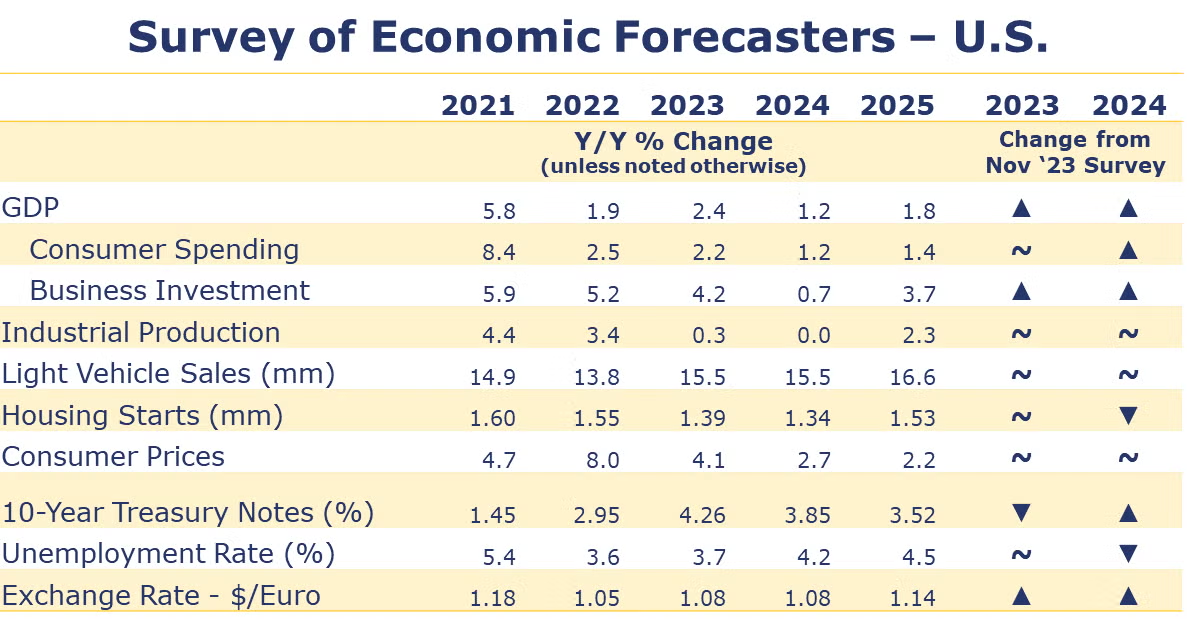
- Resilient consumer spending provided momentum in the U.S. economy in 2023, but signs of a slowing economy continue to emerge.
- U.S. GDP is expected to grow by 2.4% in 2023 and by 1.2% in 2024.
- Consumer spending growth is expected to downshift to a 2.2% Y/Y pace in 2023 (from 2.5% in 2022) and slow further to a 1.2% gain in 2024.
- Incentivized by recent legislation, but tempered by higher borrowing costs, growth in business investment is also expected to decelerate to a 4.2% pace in 2023 before slowing to a 0.7% gain in 2024.
- We look for industrial production to edge higher by 0.3% this year and hold steady (flat growth) in 2024.
- U.S. vehicle production continues to be a relatively bright spot in an otherwise lackluster outlook. As a result, sales of autos and light trucks are expected to grow to 15.5 million in both 2023 and 2024 (still below trend).
- Struggling with high prices, labor costs, and mortgage rates, new homebuilding has found some support from historically low inventories of existing homes. Housing starts are expected to come in at 1.39 million in 2023 before easing slightly to a 1.34 million pace in 2024.
- The unemployment rate is expected to move higher from 50-year lows to average 3.7% in 2023 and 4.2% in 2024.
- Recent data suggest inflation is slowing, though it remains above the Fed’s target. The Fed has announced it’s keeping the door open to future rate increases. Growth in consumer prices is expected to decelerate to a 4.1% pace in 2023 and 2.7% in 2024 (down from 8.0% in 2022).
- Expectations for interest rates (10-year Treasury) were higher for both 2023 and 2024, reflecting the expectation that interest rates will be “higher for longer”.
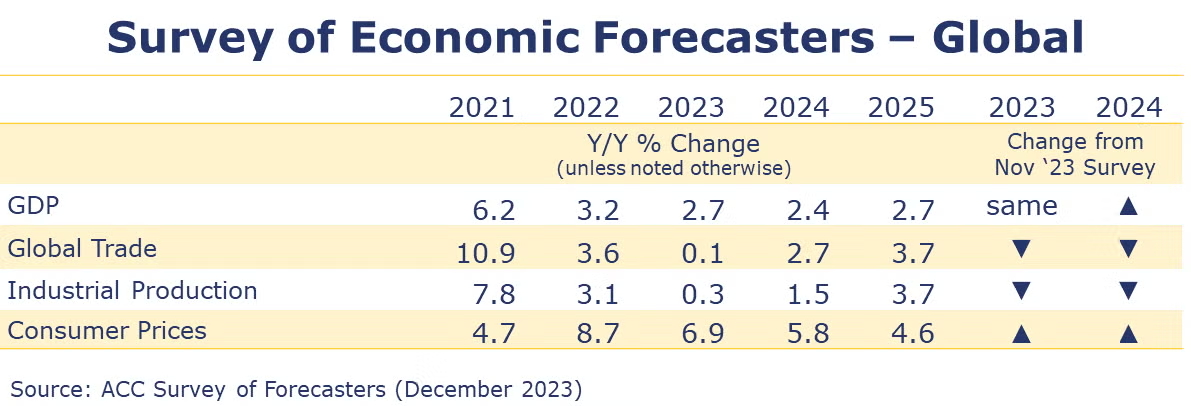
- Our Global GDP growth forecast for 2023 holds at 2.7%. The forecast for 2024 was revised upward to 2.4%. Global activity is forecast to expand at a 2.7% pace in 2025 and 2.7% in 2026.
- Global inflation will have increased 6.9% in 2023, a relief from 8.7% in 2022. Inflationary pressures will moderate over the forecast period with a 5.8% pace projected next year (2024) and a settling down toward an average 3.9% pace over the 2027-2031 period.
- Weakening demand for goods exports pulled global trade down this year. Forecasters estimate just 0.1% global trade growth in 2023. Trade volumes will pick up in 2024 and 2025.
- Growth in the industrial sector is forecast to dip to a 0.3% pace in 2023. Global manufacturing will begin to recover in 2024, growing 1.5% then 3.7% in 2025.

Oil prices moved higher during the week on the Fed’s expectations of rate cuts in 2024 and a weaker dollar. U.S. natural gas prices were up from a week ago. The combined oil and gas rig count was up for a fourth consecutive week (by one) to 622.
Indicators for the business of chemistry bring to mind a red banner.
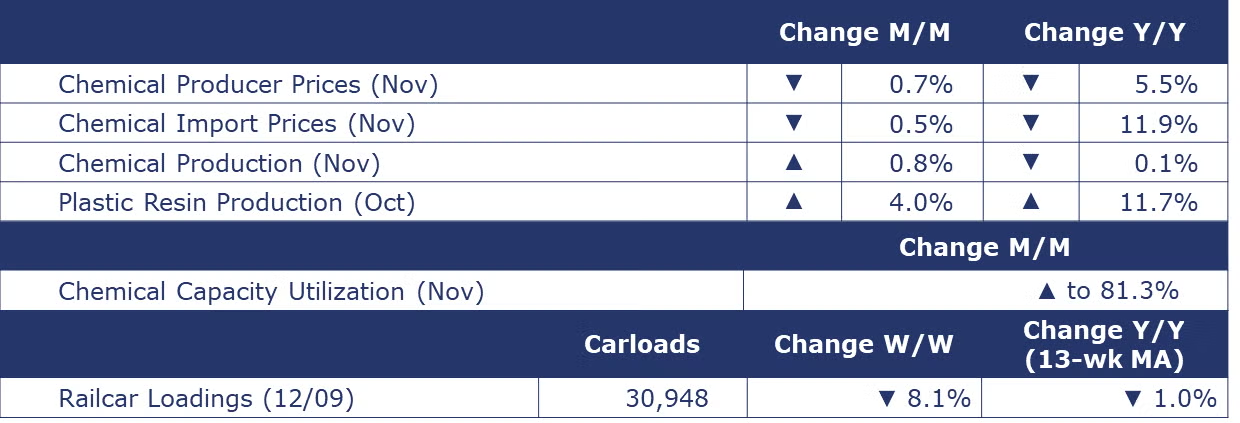
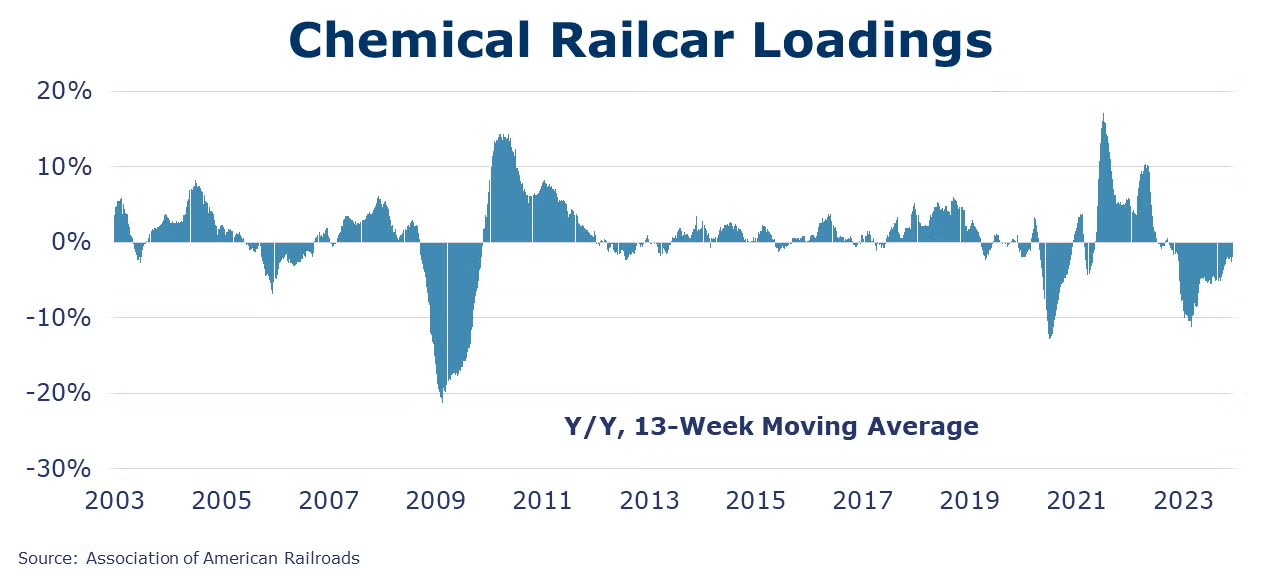
According to data released by the Association of American Railroads, chemical railcar loadings were down to 30,948 for the week ending December 9. Loadings were down 1.0% Y/Y (13-week MA), down 1.2% YTD/YTD. Loadings have been on the rise for 7 of the last 13 weeks.
U.S. production of major plastic resins totaled 8.2 billion pounds during October 2023, up 4.0% M/M and up 11.7% Y/Y, according to ACC statistics. Year-to-date production was 80.1 billion pounds, up 2.6% Y/Y. Sales and captive (internal) use of major plastic resins totaled 8.2 billion pounds, up 1.4% M/M and up 10.8% Y/Y. Year-to-date sales and captive use were 79.4 billion pounds, up 2.2% Y/Y.
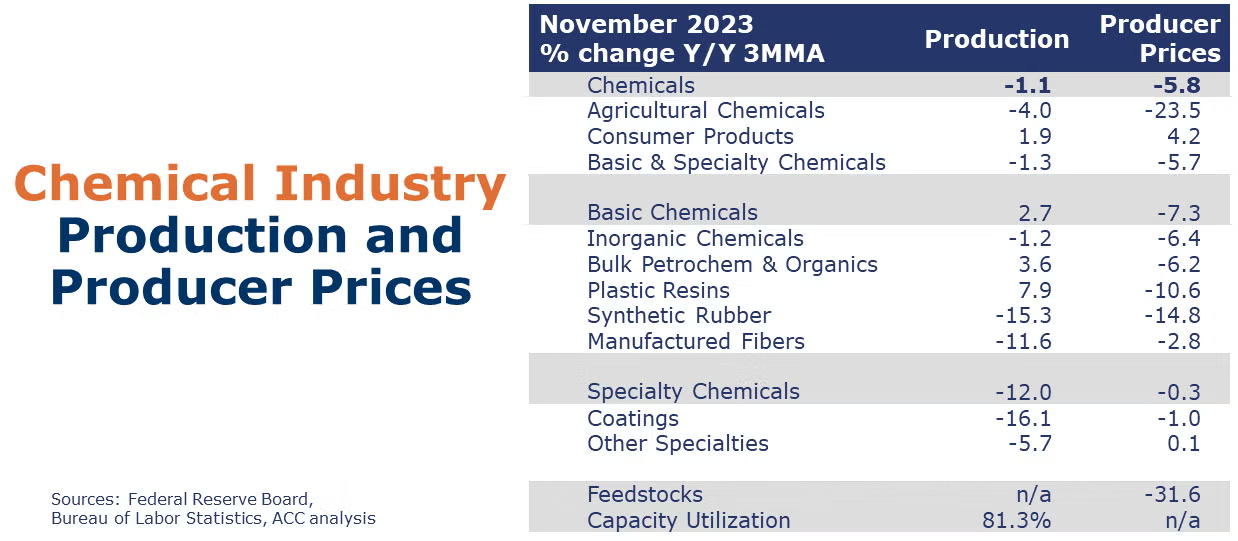
Chemical production rebounded in November, up 0.8% following a 1.2% decline in October. There were strong gains in the output of crop protection chemicals, coatings, synthetic rubber, and other specialty chemicals and smaller increases in the output of fertilizers, consumer products and manufactured fibers offset declines. These gains were partially offset by lower production of organic and inorganic chemicals, and plastic resins. Capacity utilization rose to 81.3% and was ahead of last November’s 78.9%.
Chemical producer prices declined 0.7% in November and were down 5.5% Y/Y. Producer prices fell in all categories except agricultural chemicals, plastic resins, and coatings.
Chemical import prices fell 0.5% in November following a 0.1% gain in October. Chemical export prices declined 0.1% following a 0.2% gain in October. On a Y/Y basis, import prices were down 11.9% and export prices were down 11.4%.
Note On the Color Codes
Banner colors reflect an assessment of the current conditions in the overall economy and the business chemistry of chemistry. For the overall economy we keep a running tab of 20 indicators. The banner color for the macroeconomic section is determined as follows:
Green – 13 or more positives
Yellow – between 8 and 12 positives
Red – 7 or fewer positives
There are fewer indicators available for the chemical industry. Our assessment on banner color largely relies upon how chemical industry production has changed over the most recent three months.
For More Information
ACC members can access additional data, economic analyses, presentations, outlooks, and weekly economic updates through ACCexchange.
In addition to this weekly report, ACC offers numerous other economic data that cover worldwide production, trade, shipments, inventories, price indices, energy, employment, investment, R&D, EH&S, financial performance measures, macroeconomic data, plus much more. To order, visit http://store.americanchemistry.com/.
Every effort has been made in the preparation of this weekly report to provide the best available information and analysis. However, neither the American Chemistry Council, nor any of its employees, agents or other assigns makes any warranty, expressed or implied, or assumes any liability or responsibility for any use, or the results of such use, of any information or data disclosed in this material.
Contact us at ACC_EconomicsDepartment@americanchemistry.com.

