Running tab of macro indicators: 13 out of 20
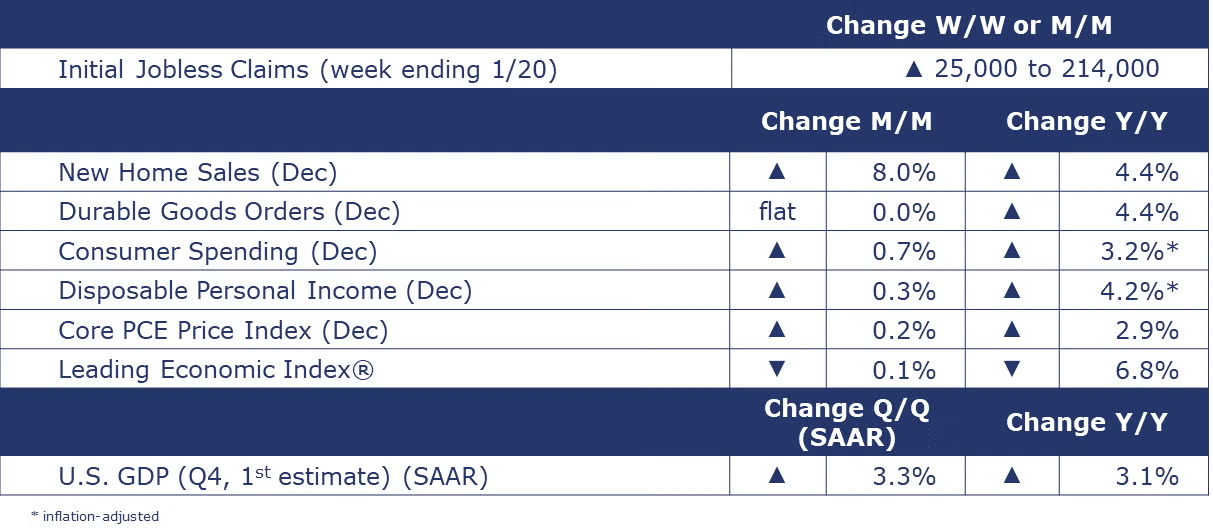
The number of new jobless claims rose by 25,000 to 214,000 during the week ending January 20. Continuing claims increased by 27,000 to 1.83 million, and the insured unemployment rate for the week ending January 13 was unchanged at 1.2%.
Consumer spending surged in the last month of the year, up by 0.7%. Within that spending, there was strong growth in goods. Aggregate personal income (the spending power of those consumers) rose 0.3%. The headline price index for personal consumption expenditures (PCE) rose 2.6% Y/Y, the same pace as in November. Excluding volatile food and energy, growth in the core PCE price index fell to a 2.9% Y/Y pace, getting closer to the Fed’s preferred target of 2%. This is the slowest growth in the core PCE in more than two and a half years and one step closer to a “soft landing.”

The first estimate of Q4 GDP came in well ahead of expectations. The U.S. economy grew by 3.3% on a seasonally adjusted annual rate (SAAR). The gain was led by the ongoing expansion of consumer spending (on both goods and services). There were also smaller contributions from government spending, business investment, net trade, inventory investment, and residential investment. Compared to a year ago, Q4 GDP was up 3.1% Y/Y. The price index for GDP was up 2.6% Y/Y (down from a 3.2% Y/Y pace in Q3). Excluding food and energy, the core price index was up 3.2% Y/Y (down from 3.8% Y/Y in Q3). Real GDP increased 2.5% in 2023, faster than the 1.9% pace in 2022.
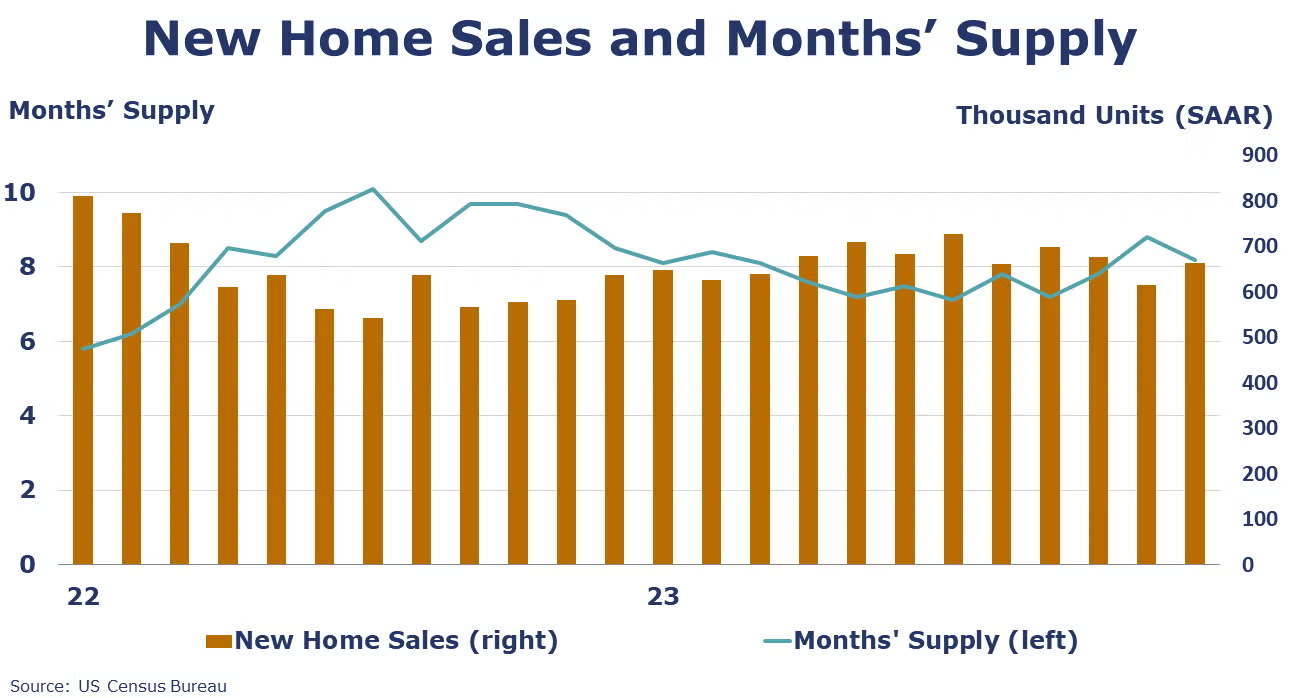
New home sales rose 8.0% in December to a SAAR of 664,000 (a level up 4.4% Y/Y). New home sales rose in all regions except the West. The months’ supply ratio tightened to 8.2 from 8.8 in November, which was the highest level in 2023.
Durable goods orders were flat in December following a 5.5% gain in November and were 4.4% higher Y/Y. Core business orders (nondefense capital goods excluding aircraft) were up 0.3% in December following a 1.0% drop in November. Core business orders were up 1.7% Y/Y. Orders for primary metals drove the gain. New orders for motor vehicles and parts rose 0.4% in December and were up 4.4% Y/Y.
The Conference Board’s Leading Economic Index® continued to edge down in December, lower by another 0.1%. It was the 22nd consecutive monthly decline. Despite positive contributions from six of 10 indicators, those gains were more than offset by strong negative contributions in several non-financial components. Compared to a year ago, the LEI was down 6.8% Y/Y. The Conference Board noted, “As the magnitude of monthly declines has lessened, the LEI’s six-month and twelve-month growth rates have turned upward but remain negative, continuing to signal the risk of recession ahead. Overall, we expect GDP growth to turn negative in Q2 and Q3 of 2024 but begin to recover late in the year.”
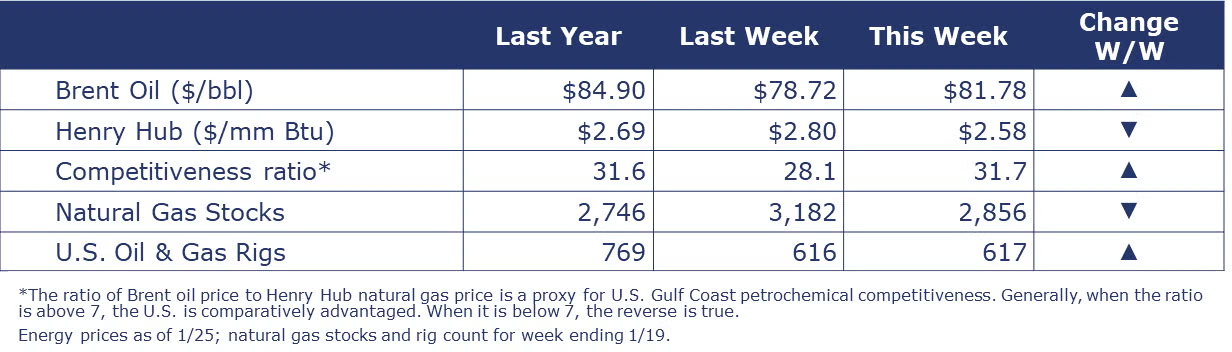
Oil prices were higher following production disruptions from last week’s winter storm and increasing tensions in the Red Sea. With last week’s deep chill across much of the U.S., there was a 326 BCF draw on natural gas inventories, the largest weekly withdrawal since the February 2021 freeze event. Due to robust natural gas production, prices remained below $3/mmbtu. New data from EIA showed that U.S. natural gas set a new production record in December, producing 105.5 BCF/day. The combined oil and gas rig count rose by 1 to 617 last week.
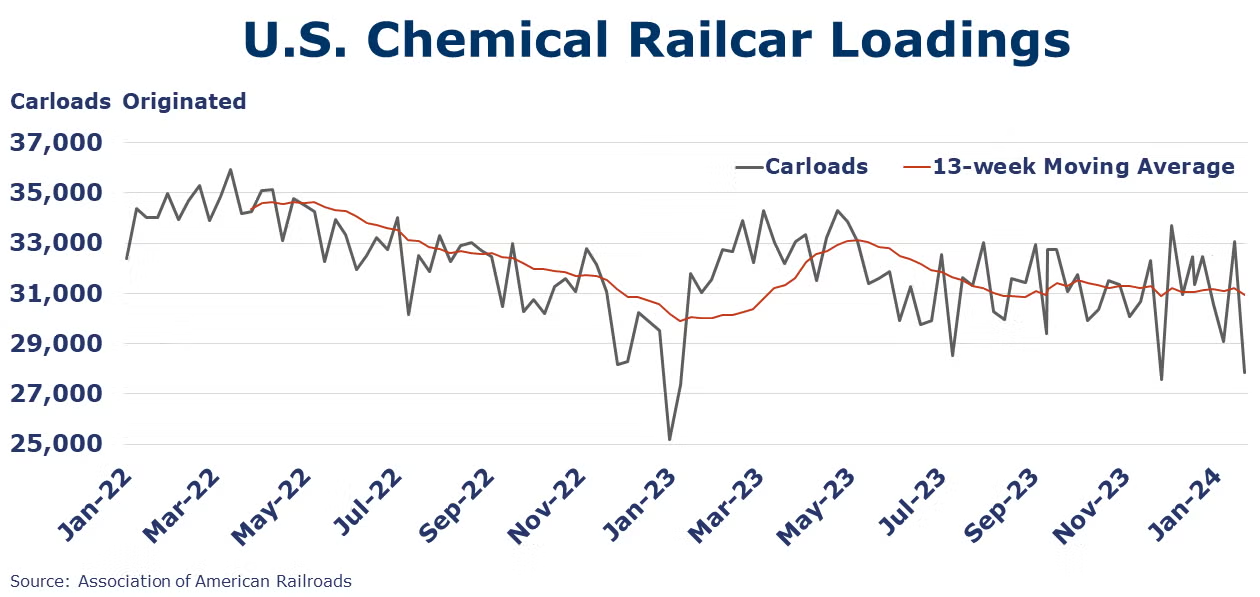
Indicators for the business of chemistry bring to mind a red banner.

According to data released by the Association of American Railroads, chemical railcar loadings were down to 27,844 for the week ending Jan 20. Loadings were up 2.9% Y/Y (13-week MA), up (4.3%) YTD/YTD and have been on the rise for 5 of the last 13 weeks.
Note On the Color Codes
Banner colors reflect an assessment of the current conditions in the overall economy and the business chemistry of chemistry. For the overall economy we keep a running tab of 20 indicators. The banner color for the macroeconomic section is determined as follows:
Green – 13 or more positives
Yellow – between 8 and 12 positives
Red – 7 or fewer positives
There are fewer indicators available for the chemical industry. Our assessment on banner color largely relies upon how chemical industry production has changed over the most recent three months.
For More Information
ACC members can access additional data, economic analyses, presentations, outlooks, and weekly economic updates through ACCexchange.
In addition to this weekly report, ACC offers numerous other economic data that cover worldwide production, trade, shipments, inventories, price indices, energy, employment, investment, R&D, EH&S, financial performance measures, macroeconomic data, plus much more. To order, visit http://store.americanchemistry.com/.
Every effort has been made in the preparation of this weekly report to provide the best available information and analysis. However, neither the American Chemistry Council, nor any of its employees, agents or other assigns makes any warranty, expressed or implied, or assumes any liability or responsibility for any use, or the results of such use, of any information or data disclosed in this material.
Contact us at ACC_EconomicsDepartment@americanchemistry.com.

