
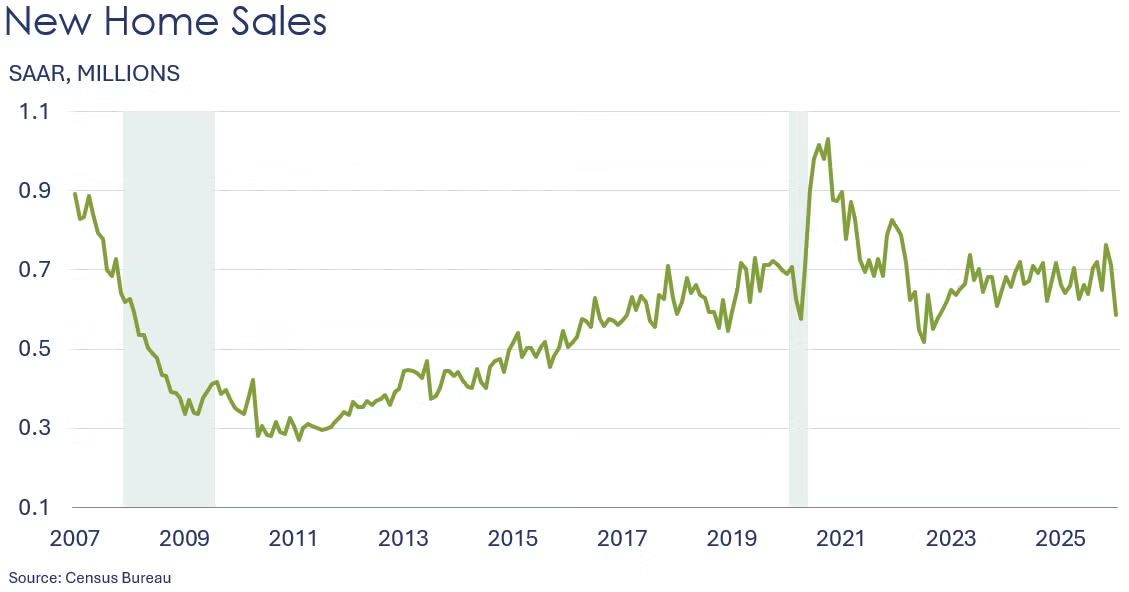
New home sales slumped 17.6% in January after losing 6.8% in December. Sales fell in all the regions, with the Northeast losing 44.7%, the Midwest down 33.9%, and the West and South declining 21.6% and 8.1%, respectively. Compared to a year ago, new home sales dropped 11.3%, the largest Y/Y drop since February 2023. Inventories rose slightly in January but fell from a year ago. At the current sales pace, inventories represent a 9.7-month supply, up from 8.0 months in December and 9.0 months a year earlier. The median sales price was $400,500, off 6.8% Y/Y and the lowest level since July of last year.
Industrial production expanded for a fourth straight month in February, up by 0.2% after gaining 0.7% in January. The February increase was supported by gains in mining and to a lesser extent manufacturing, which more than offset a decline in utilities. Within manufacturing, the largest gains were in motor vehicles & parts, electrical equipment, wood products, chemicals, plastics & rubber products, and paper. The largest declines were in textiles, petroleum and coal products, and machinery. Overall industrial production was up 1.4% Y/Y, with manufacturing output rising 1.3%. Capacity utilization was unchanged at 76.3%, still its highest reading since July of last year but below its long-term average of 79.5%.

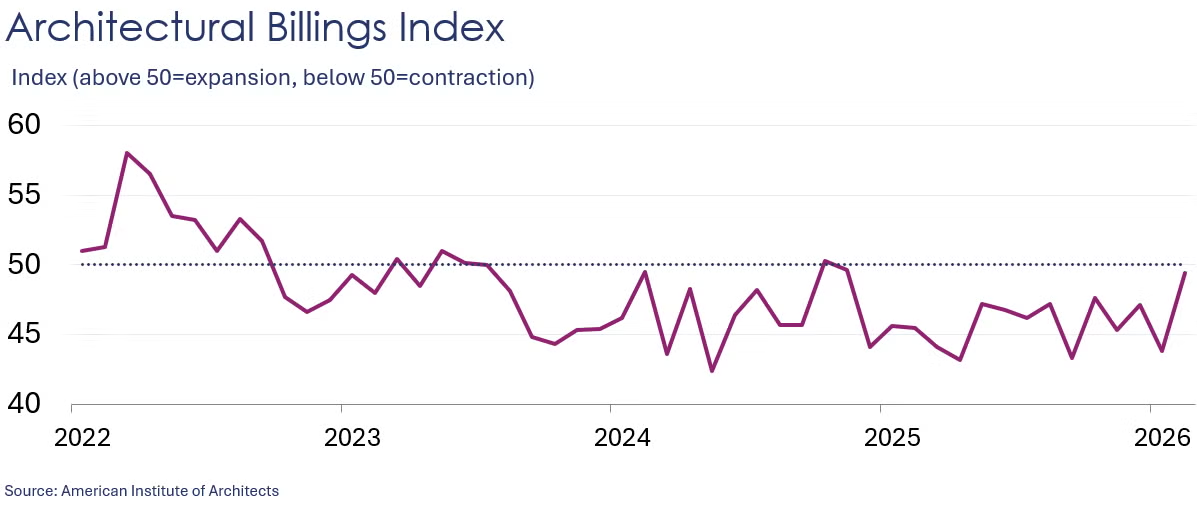
A leading indicator of nonresidential building activity, the AIA/Deltek Architectural Billings Index® gained 5.6 points in February to 49.4, the highest reading since November 2024. Newly signed design contracts declined at a much slower rate while inquiries about new projects rose into growth territory.
Factory orders inched up 0.1% in January after having lost 0.4% in December. Orders of computers & electronic products, primary & fabricated metals, and machinery increased while orders of electrical equipment & appliances and transportation equipment declined. The latter was pulled down by a steep drop (-23.8%) in defense aircraft orders. Nondurable goods orders gained 0.3%. Core business orders (nondefense capital goods excluding aircraft) added 0.1% on top of a 0.8% increase in December. Unfilled orders, a measure of the manufacturing pipeline, continued to expand, rising 0.8%. Manufacturing shipments were up 0.5% while inventories edged slightly higher, up 0.1%. The inventories-to-shipments ratio eased from 1.56 in December to 1.55 in January.
Wholesale inventories shrank by 0.5% in January, on top of a 0.1% loss in December. Durable goods inventories were flat while nondurable goods stocks dropped 1.5%, with the latter driven down by alcohol, pharmaceuticals, and farm products. Sales at the wholesale level rose 0.5% on the back of a 1.3% gain in December. The inventories to sales ratio edged lower from 1.26 in December to 1.25. Compared to a year ago, sales were up 7.5% Y/Y while inventories were ahead by 1.0% Y/Y.
Manufacturing activity in the Philadelphia region expanded in March, according to the Philadelphia Fed’s Manufacturing Outlook Survey. The general activity index increased for the third straight month, gaining 1.8 points to 18.1. The new orders index dipped but stayed in growth territory as the shipments index rose. The employment index moved into positive territory, with prices increasing faster after decelerating last month.

Producer prices rose 0.7% in February after gaining 0.5% in January. The February increase was propelled by higher prices for final demand services, which advanced 0.5%, while prices for final demand goods rose 1.1%, the largest increase since August 2023 and driven by food and energy, specifically diesel and jet fuel prices. The core PPI, which excludes food, energy and trade services, moved up 0.5%. Compared to a year ago, headline producer prices were up 3.4% Y/Y, the largest Y/Y increase since February 2025, while the core PPI gained 3.5% Y/Y.
The Federal Open Market Committee (FOMC) maintained the federal funds rate at the 3.5%–3.75% range. One Fed governor dissented, favoring a 25-basis-point cut. The committee noted that economic growth remains robust; however, inflation has exceeded expectations and uncertainty regarding the economic outlook has intensified due to the war in Iran and its impact on energy prices. One rate cut is still likely for the remainder of 2026.
Job openings rose slightly in January to 6.9 million from 6.6 million in December. Back in January 2025, job openings totaled 7.4 million. Both layoffs and quits (a measure of workers’ willingness to leave a job) declined slightly in December and were nearly unchanged from a year ago, a sign of the persistence of a “low-hire/low-fire” job market.
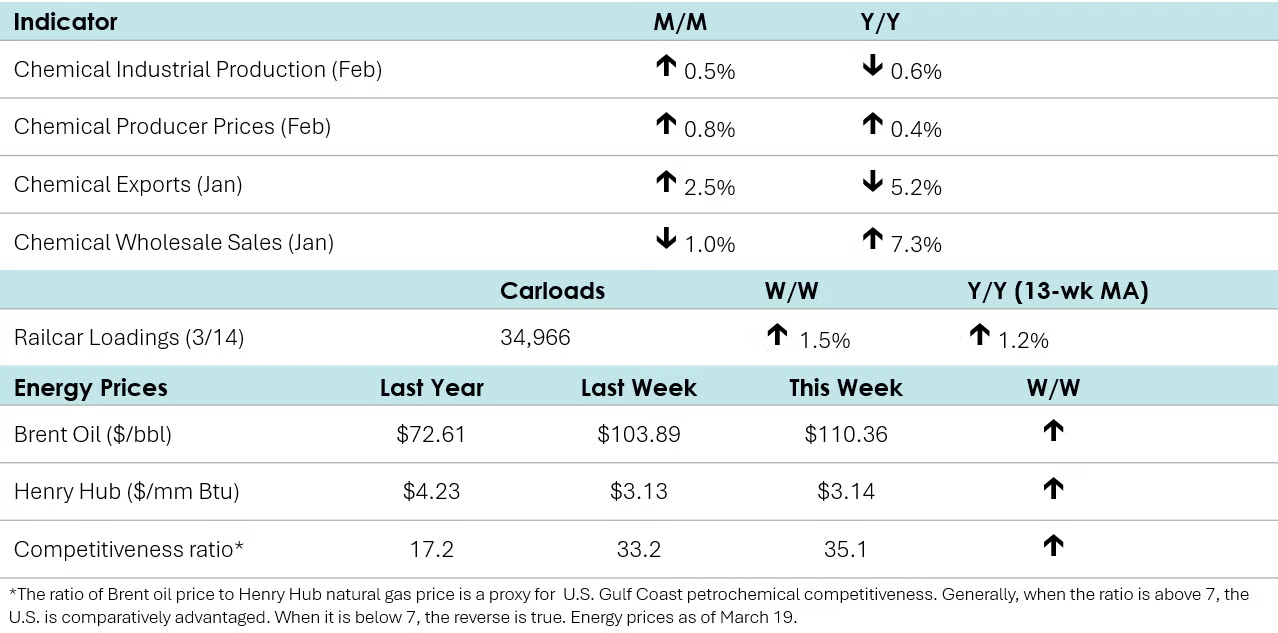
According to data released by the Association of American Railroads, chemical railcar loadings rose to 34,966 for the week ending March 14. Loadings were up 1.2% Y/Y (13-week MA) and up 3.3% YTD.
Chemical production grew 0.5% in February, down from a 1.4% increase in January. The segments that witnessed the largest increases were other specialties, consumer products, synthetic dye and pigment, organic chemicals, industrial gas, basic industrial chemicals, and basic inorganic chemicals (all up more than 1.0%). Other categories saw smaller increases: other inorganics, basic chemicals, plastic material & resin, basic & specialty chemicals, and plastic resin & synthetic rubber. By contrast, paints & coatings; paints, coatings & adhesives; adhesives; and synthetic rubber saw the biggest declines (all down between 2.9% and 3.4%). Compared to a year ago, chemical production was down 0.6% Y/Y, the fifth Y/Y drop in a row. Nevertheless, chemical capacity utilization tightened in February to 80.5%, the highest reading since September of last year.
Chemical shipments inched up 0.1% in January, with gains in agricultural chemicals and coatings & adhesives more than offsetting a slight loss in all other chemicals. Chemical inventories moved slightly lower, down by 0.1%. The inventories-to-shipments ratio remained stable at 1.23. Compared to a year ago, chemical shipments were up 1.1% Y/Y while inventories were down 0.3% Y/Y.
Chemicals sales at the wholesale level lost 1.0% in January while inventories were down by 0.7%. Sales were up 7.3% Y/Y while inventories were off by 2.3% Y/Y. The inventories-to-sales ratio was unchanged at 1.05. As in December, that was the lowest ratio since May 2014 and suggests inventories are comparatively lean at the wholesale level.

Chemical producer prices rose 0.8% in February after adding 0.5% in January. The February increase was the second straight rise in chemical producer prices after four consecutive months of declines. Prices advanced for synthetic rubber, manufactured fibers, bulk petrochemicals & organics, basic chemicals, coatings, basic & specialty chemicals, plastic resins, inorganic chemicals, agricultural and specialty chemicals. On the other hand, prices for other specialties declined while prices for consumer products were flat. Chemical prices remained ahead compared to a year ago, up by 0.4% Y/Y, decelerating from a 0.6% Y/Y rise in December and the lowest Y/Y decline since December 2024.

U.S. chemical exports began the year with a 2.5% increase, driven in large part by an 8.3% rise in specialty chemicals. Agricultural chemicals also posted solid growth of 7.0%, while basic chemicals increased modestly by 2.4%. In contrast, consumer chemicals fell sharply by 11.9%. On a year-over-year basis, chemical exports were down 5.2%.
U.S. chemical imports increased 1.7% in January 2026, driven by a 44.8% surge in agricultural chemicals. Consumer chemicals declined 8.8%, while both basic and specialty chemicals fell slightly, by 1.0% and 0.8%, respectively. On a year-over-year basis, chemical imports were down 20.8%. With exports rising faster than imports, the U.S. chemical trade balance improved from $3.0 billion in December to $3.2 billion in January.

On a volume basis, U.S. plastic resin exports declined in January 2026, falling 3.1% month over month and 7.5% year over year.

Energy Wrap-Up
• Oil prices surged on new attacks on oil fields and facilities; Brent briefly rose above $119 on Thursday.
• U.S. natural gas prices remained near $3/mmbtu, but European natural gas prices surged to the equivalent of around $21/mmbtu following an Iranian strike against Qatari LNG export facilities that resulted in “extensive damage.”
• The combined oil & gas rig count rose by two to 545.
For More Information
ACC members can access additional data, economic analyses, presentations, outlooks, and weekly economic updates through ACCexchange: https://accexchange.sharepoint.com/Economics/SitePages/Home.aspx
In addition to this weekly report, ACC offers numerous other economic data that cover worldwide production, trade, shipments, inventories, price indices, energy, employment, investment, R&D, EH&S, financial performance measures, macroeconomic data, plus much more. To order, visit http://store.americanchemistry.com/.
Every effort has been made in the preparation of this weekly report to provide the best available information and analysis. However, neither the American Chemistry Council, nor any of its employees, agents or other assigns makes any warranty, expressed or implied, or assumes any liability or responsibility for any use, or the results of such use, of any information or data disclosed in this material.
Contact us at ACC_EconomicsDepartment@americanchemistry.com.

