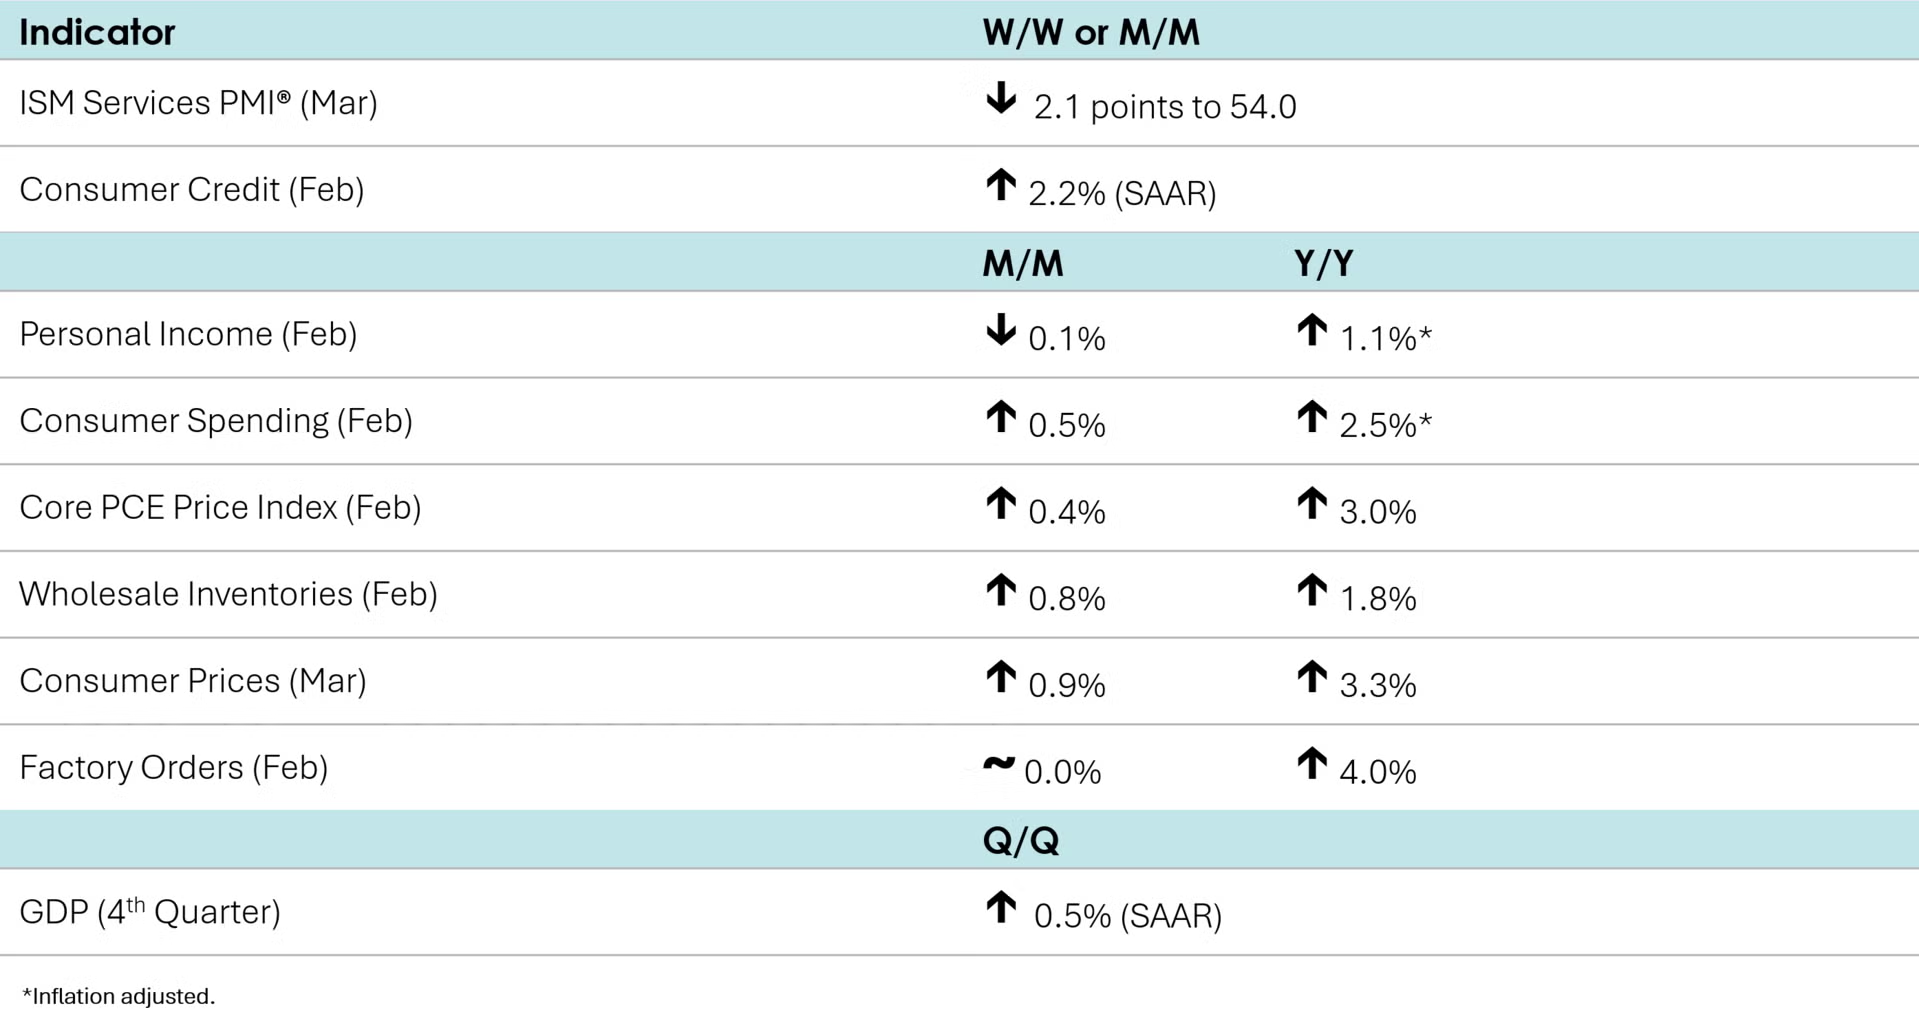
Consumer prices leaped 0.9% in March after adding 0.3% the previous month. The March increase was the largest monthly gain since June 2022. Energy was up 10.9% as gasoline prices jumped 21.2% and fuel oil zoomed 30.7%. Shelter also contributed to the monthly rise by increasing 0.3%. Transportation services and apparel prices also rose. Food prices were unchanged while used cars and trucks prices slid. Core prices, which exclude food and energy, advanced 0.2%, the same increase witnessed in February. Compared to a year ago, the headline CPI was up 3.3% Y/Y, the highest Y/Y increase since April 2024. Core prices rose 2.6% Y/Y, up slightly from a 2.5% rise in February.
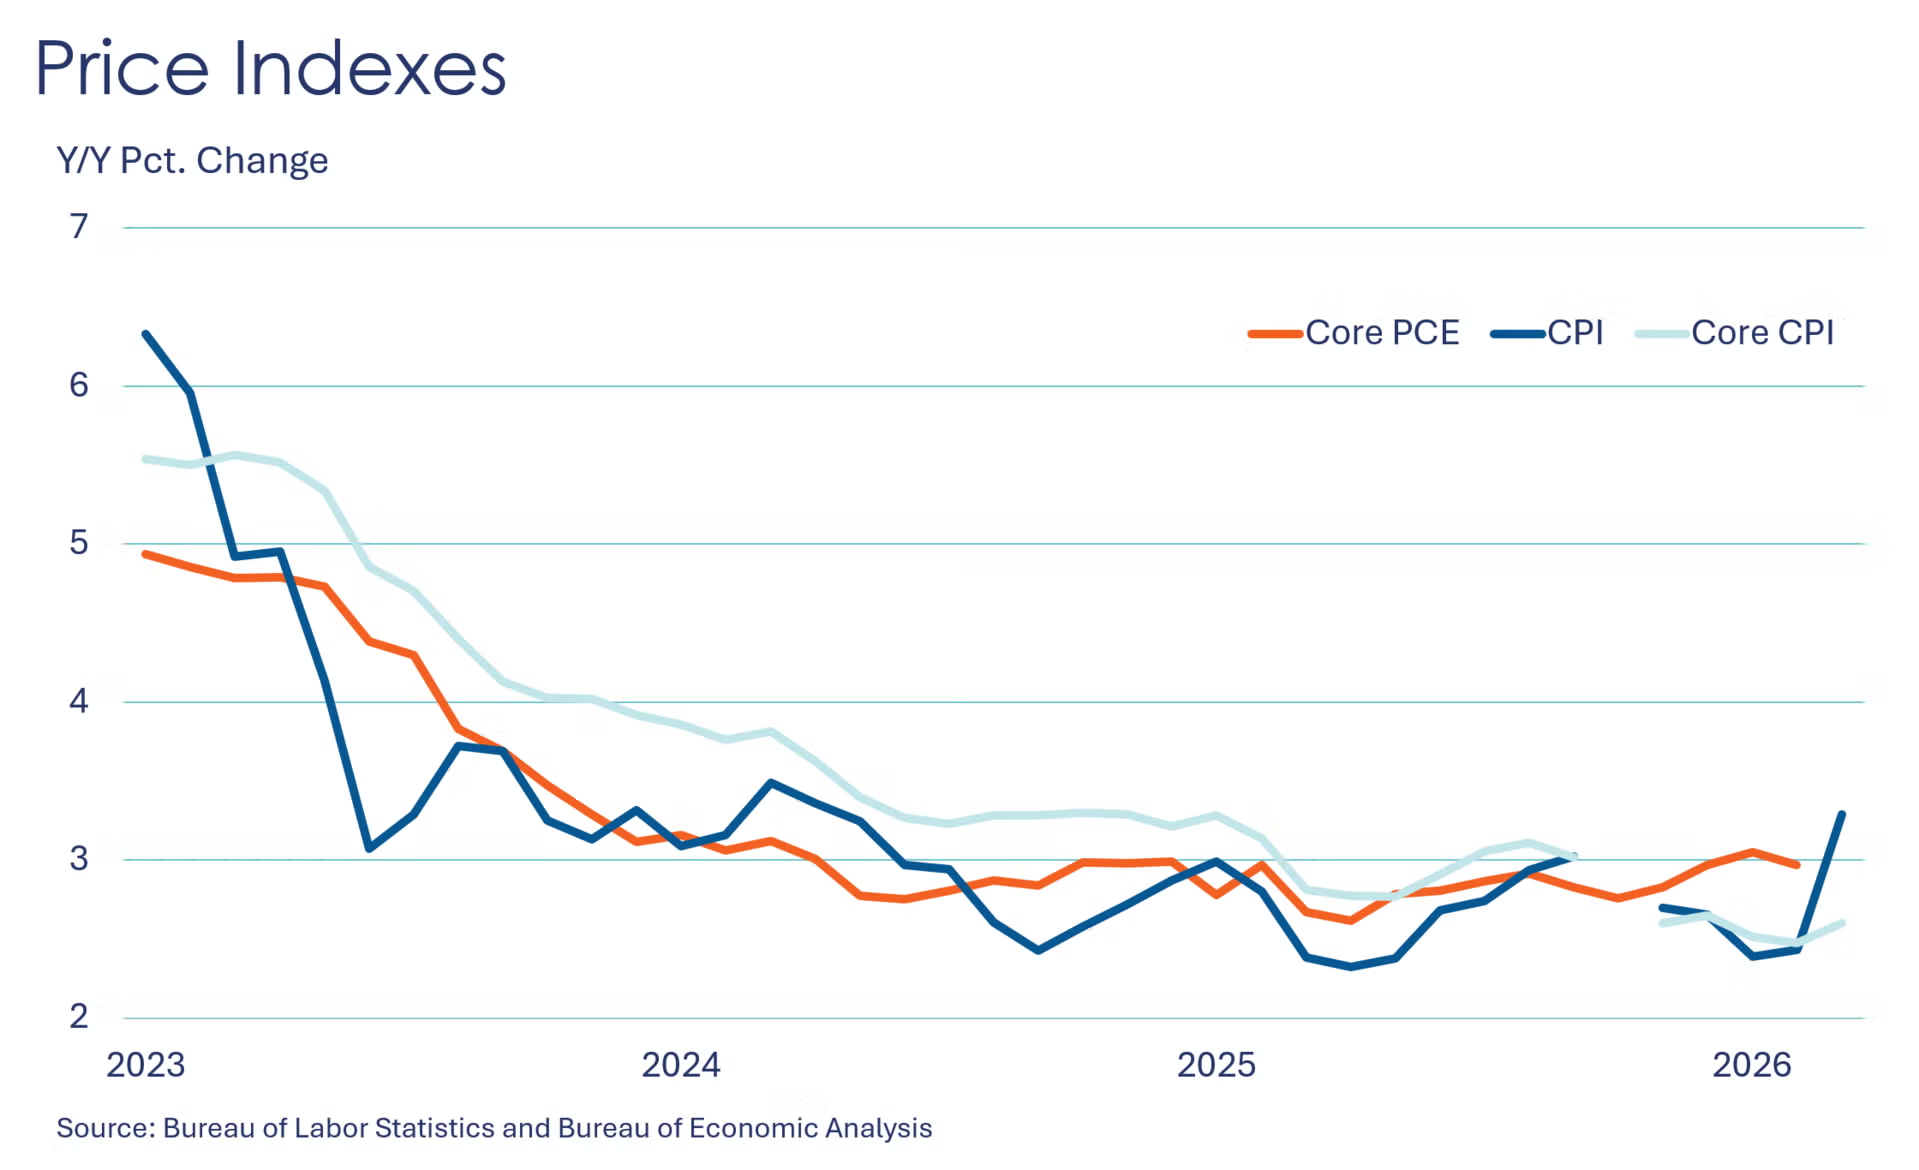
Consumer spending expanded by 0.5% in February, up from a 0.3% increase in January. February’s gain was led by spending on motor vehicles & parts, health care, financial services & insurance, and transportation services. On the flip side, spending on recreational services and food & beverages declined. After adjusting for inflation, real consumer spending was up 2.5% from a year ago, up from a 2.2% Y/Y increase in January. Real disposable personal income grew 1.1% Y/Y in February, matching the increase seen in December, which was the lowest Y/Y change since December 2022. The Fed’s preferred inflation measure, the price index for personal consumption expenditures (PCE) was up 2.8% Y/Y, the same reading witnessed in January. Excluding food and energy, the core PCE price index was up 3.0% Y/Y, down slightly from a 3.1% Y/Y increase in January, which itself was the largest advance since March 2024.

Borrowing rose in February as consumer debt grew at a 2.2% seasonally adjusted annual rate, up from a revised gain of 1.8% in January. Credit card balances inched up 0.6% after rising 2.3% the prior month, while balances on nonrevolving debt, such as student loans and car loans, advanced 2.8% on top of a 1.6% rise in January.
The ISM Services PMI® dropped 2.1 points to 54.0 in March, signaling a slight deceleration in the service industry but marking the 21st straight month of expansion. Business activity/production, inventories, order backlogs, and new export orders grew at a slower pace, while employment switched from growth to contraction. On the flip side, new orders, imports, and prices grew faster, while supplier deliveries slowed further.
Headline factory orders were flat in February for a second straight month. Gains in orders for computers, motor vehicles & parts, IT equipment, construction materials and consumer goods were offset by lower orders for civilian aircraft and defense equipment. New orders for core business goods (nondefense capital goods, excluding aircraft) rose 0.7% following a small decline in January. Headline orders were up 4.0% Y/Y while core business orders were ahead by 5.8% from a year ago. Manufacturing shipments rose 1.4% while inventories edged higher by 0.1%. As a result, the inventories-to-shipments ratio moved lower from 1.55 in January to 1.53 in February, its lowest since 2022.
Wholesale inventories were up 0.8% in February (the largest gain in more than a year) while sales advanced by 2.7% during the month. Compared to a year ago, inventories were up 1.8% while sales were ahead by 8.8%. The inventories-sales-ratio at the wholesale level fell from 1.25 in January to 1.22 in February. A year ago, the ratio stood at 1.31.
In its third and final estimate, BEA reported that real Q4 GDP rose at a 0.5% seasonally adjusted annual rate (SAAR). This was lower than previous estimates that were made using preliminary data. The downward revision primarily reflected a downward revision to investment.
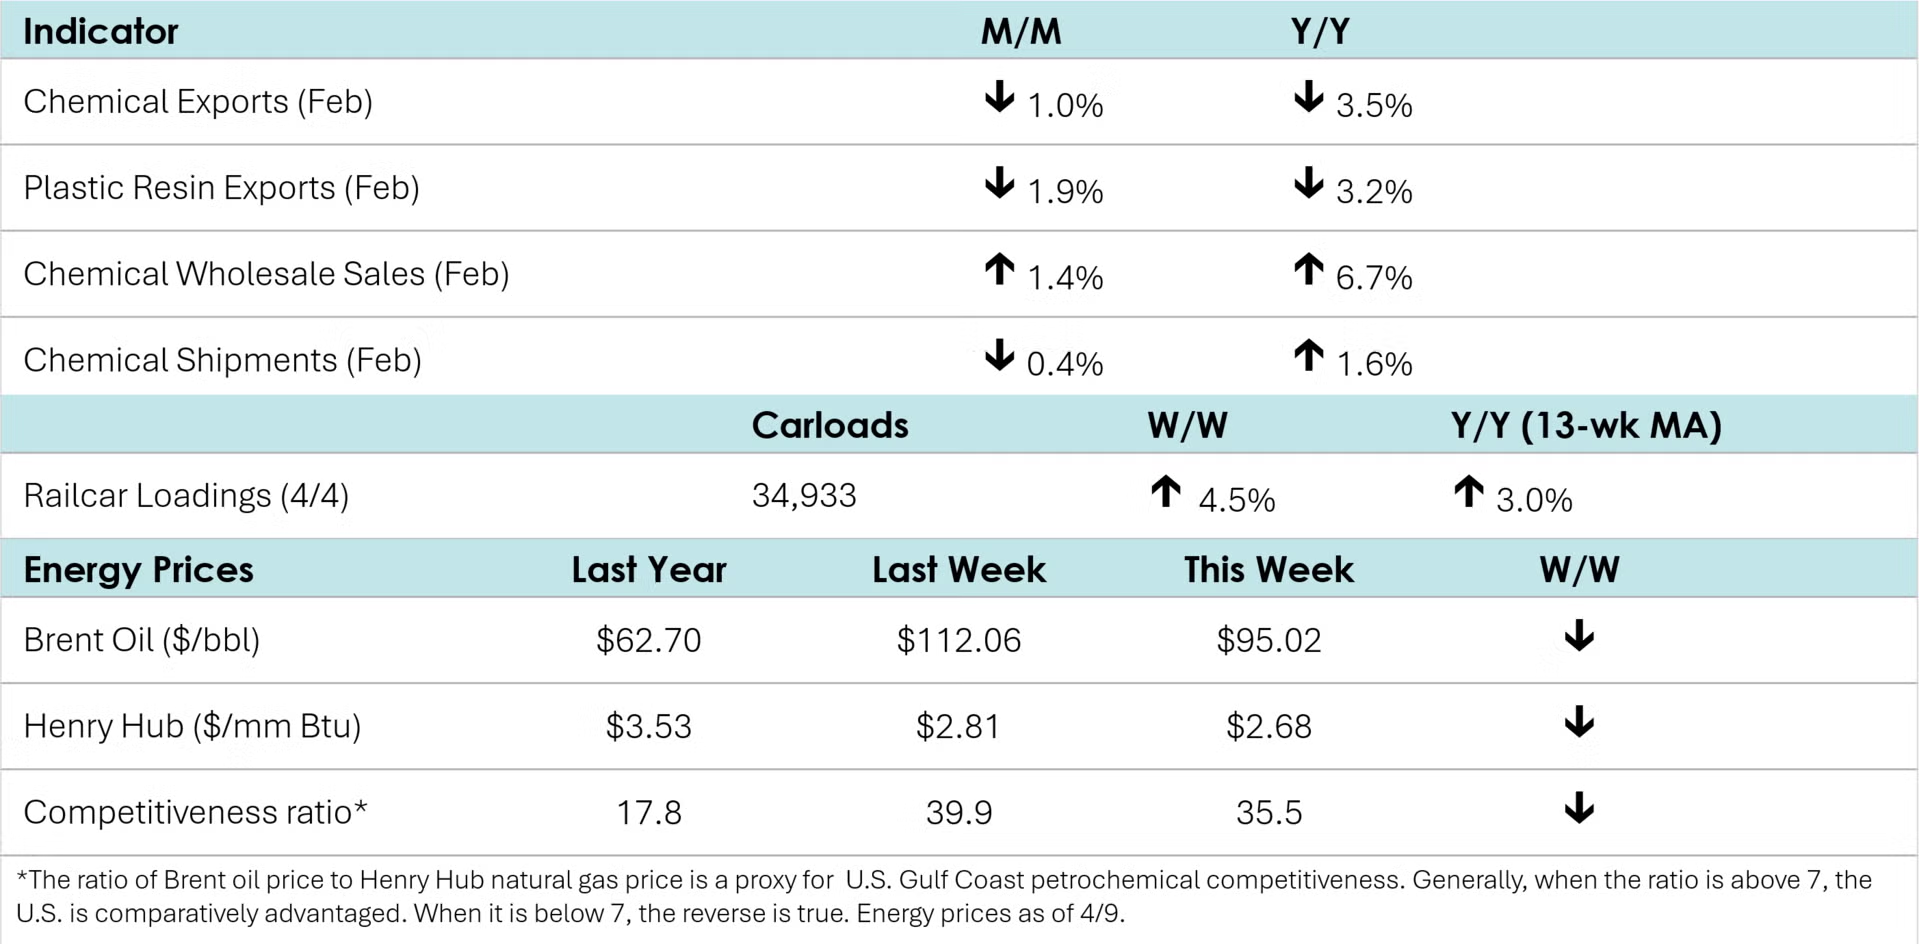
According to data released by the Association of American Railroads, chemical railcar loadings fell to 34,933 for the week ending April 4th. Loadings were up 3.0% Y/Y (13-week MA) and up 3.8% YTD.
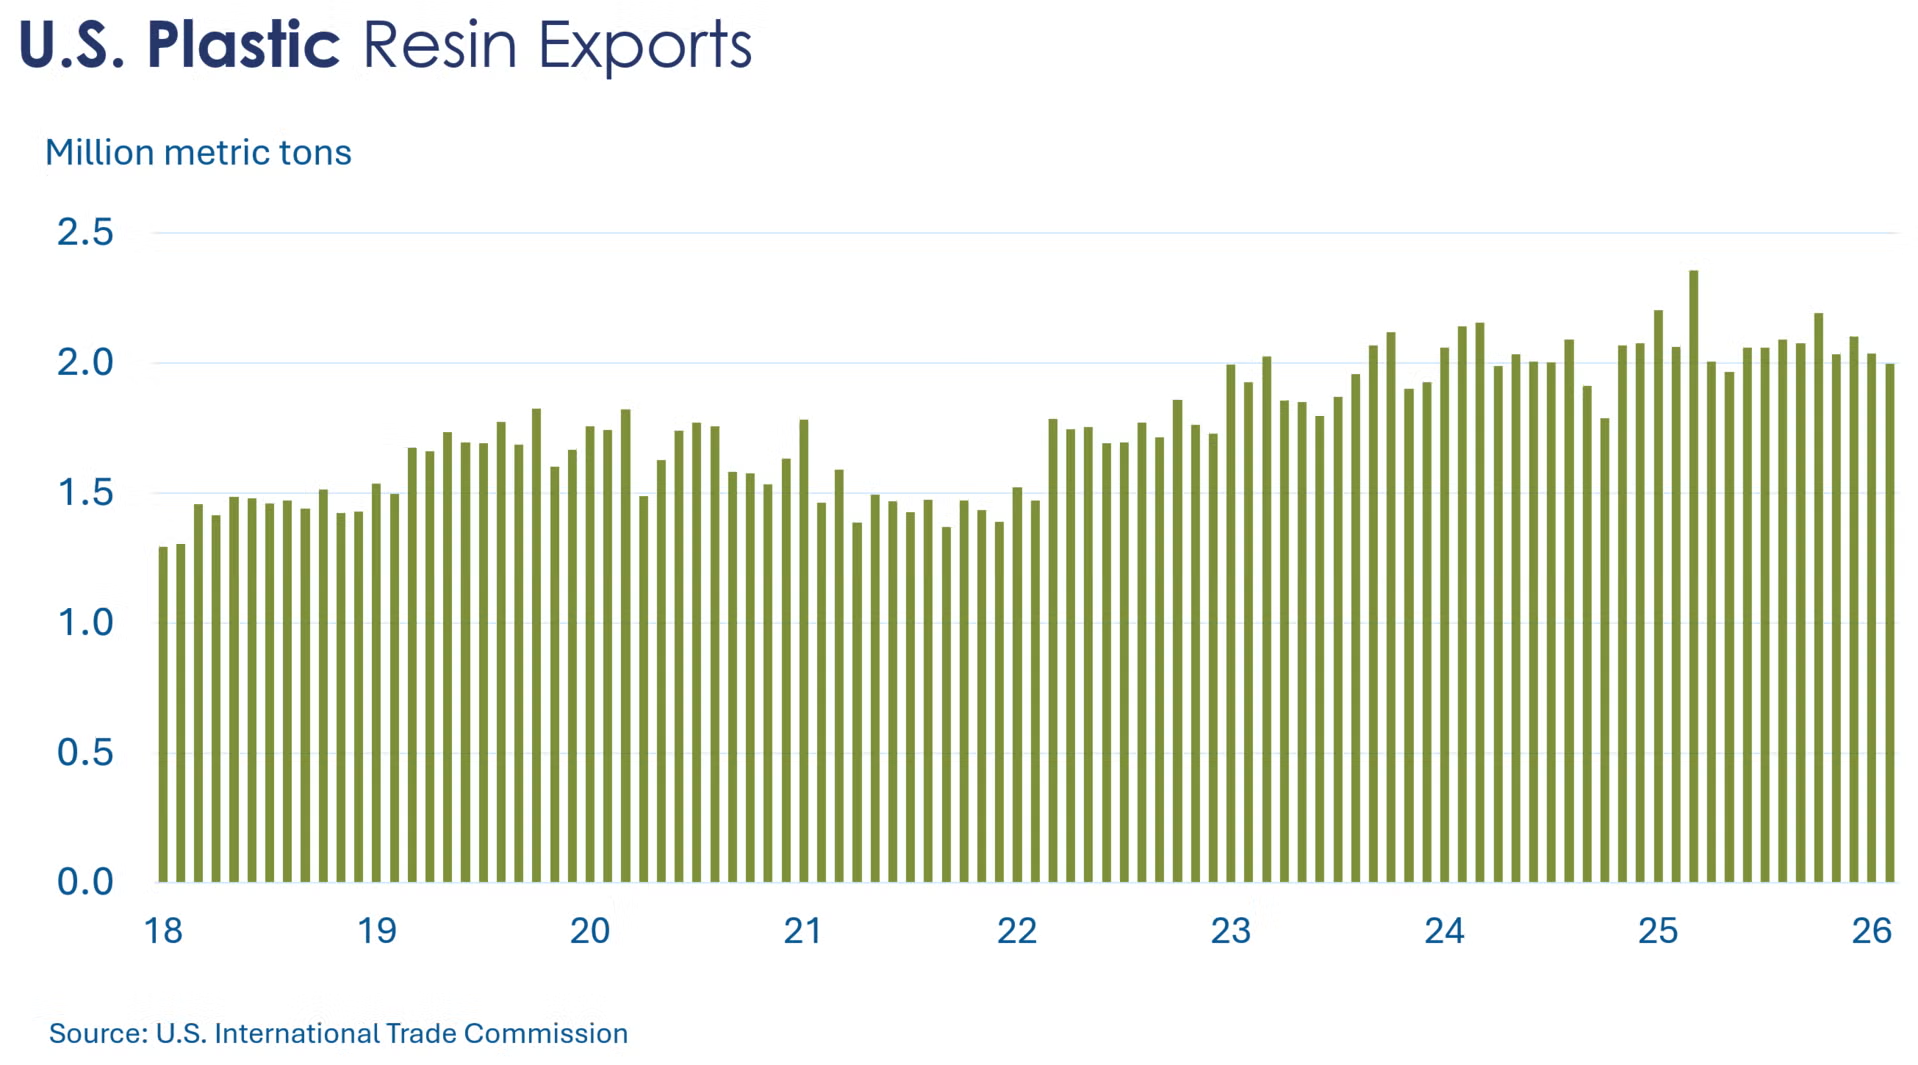
Chemical exports fell 1.0% in February, down to $12 billion. Chemical imports also declined, down 0.2% to $9 billion. Because exports fell faster than imports, the trade surplus in chemicals fell to $3 billion.
Chemical shipments fell 0.4% following a 0.2% decline in January. Higher shipments of agricultural chemicals were offset by lower shipments of coatings, adhesives, and other chemicals. Chemical inventories were flat following a 0.2% gain the previous month. Compared to a year ago, chemical shipments were up 1.6% Y/Y while inventories were 0.9% lower. The inventories-to-shipments ratio remained stable at 1.22.
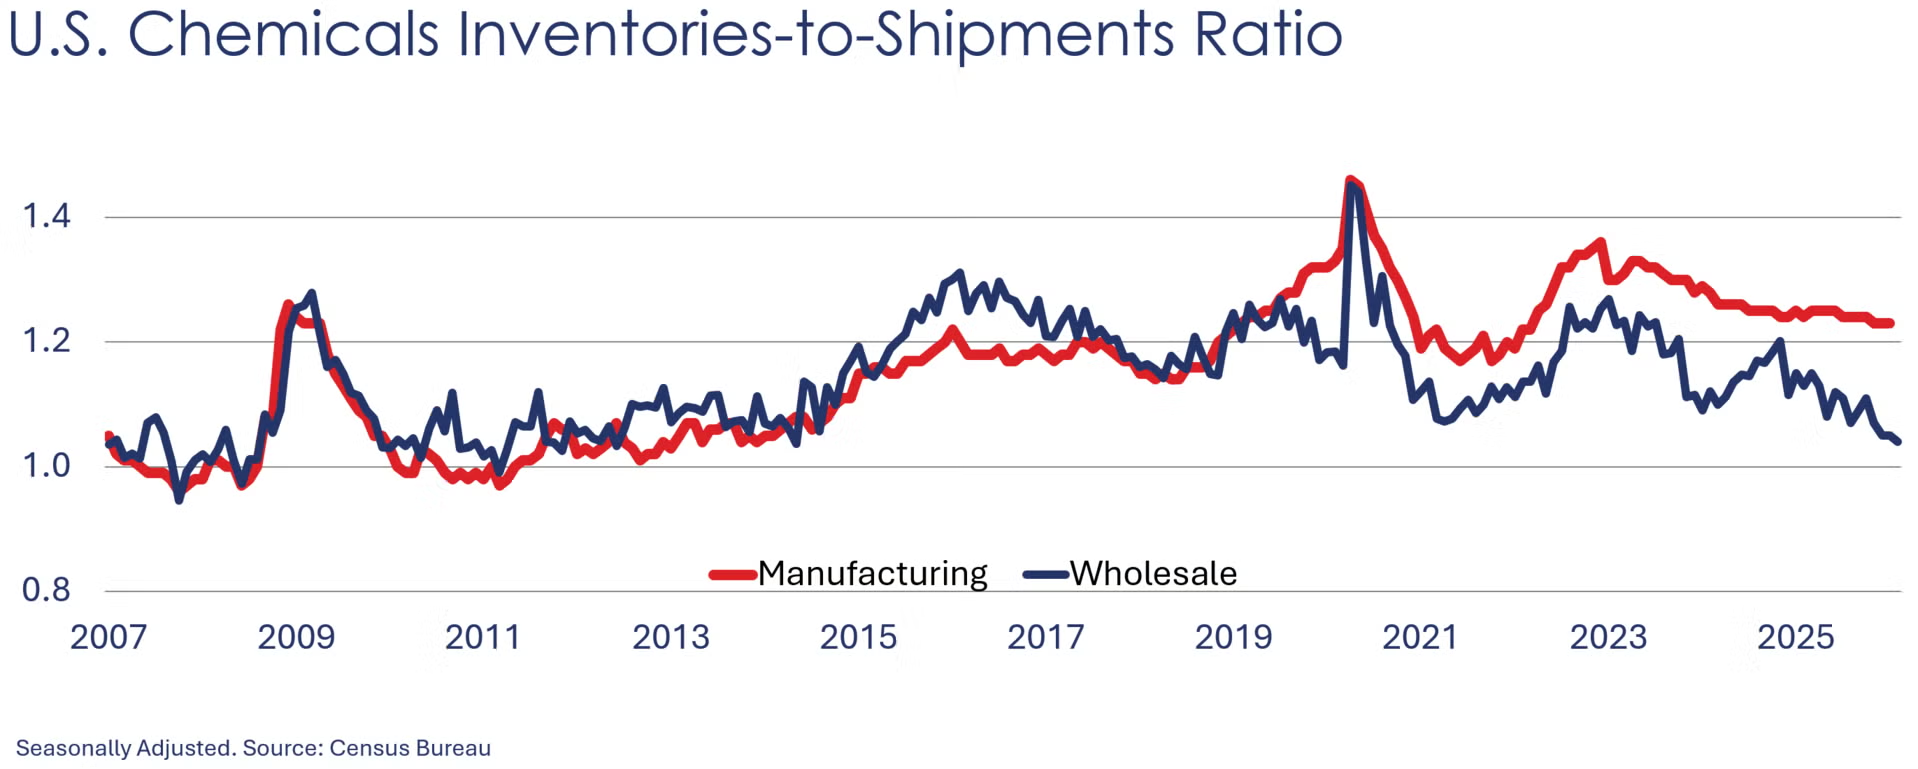
Sales of chemicals at the wholesale level rose 1.4% in February and were 6.7% higher than a year ago. Inventories also rose, up 0.5%, but were 1.8% lower than a year ago. The inventories-to-sales ratio ticked lower to 1.04, the lowest since 2014. A year ago, the ratio was 1.13.
Energy Wrap-Up
• Oil prices were back below $100/bbl following a temporary ceasefire in Iran.
• U.S. natural gas prices were near their lowest in more than a year as the storage rebuild season gets underway.
• The combined oil & gas rig count rose by 5 to 541during the week ending April 2nd.
For More Information
ACC members can access additional data, economic analyses, presentations, outlooks, and weekly economic updates through ACCexchange: https://accexchange.sharepoint.com/Economics/SitePages/Home.aspx
In addition to this weekly report, ACC offers numerous other economic data that cover worldwide production, trade, shipments, inventories, price indices, energy, employment, investment, R&D, EH&S, financial performance measures, macroeconomic data, plus much more. To order, visit http://store.americanchemistry.com/.
Every effort has been made in the preparation of this weekly report to provide the best available information and analysis. However, neither the American Chemistry Council, nor any of its employees, agents or other assigns makes any warranty, expressed or implied, or assumes any liability or responsibility for any use, or the results of such use, of any information or data disclosed in this material.
Contact us at ACC_EconomicsDepartment@americanchemistry.com.