MACROECONOMY & END-USE MARKETS

Nonfarm payrolls rebounded in March, up by 178,000, the largest monthly gain since December 2024. The gain follows a downwardly revised decline of 133,000 in February. Gains in March were broad-based across sectors, though driven largely by gains in services. Manufacturing employment rose by 15,000. Average hourly earnings for all employees rose at a 3.5% pace.
According to the separate household survey, employment fell by 64,000. It is not unusual for the establishment and household surveys to produce directionally opposite estimates, especially around turning points. The civilian labor force also shrank, by an even larger amount. As a result, the unemployment rate ticked lower to 4.3%.
According to payroll processor ADP, private sector payrolls expanded by 62,000 in March. Small business drove the gain in job growth for a second month in a row. Large and mid-sized employers shed jobs. Hiring in manufacturing, trade, transportation and utilities continued to decline, while employment in services (especially education and health services) rose.
Layoffs accelerated in March, according to outplacement firm Challenger, Gray & Christmas. U.S.-based employers announced 60,620 job cuts in March, up 25% from 48,307 cuts announced in February, with the largest cuts among technology firms.
Following a gain in January, the number of job openings retreated in February, down to 6.9 million. The hire rate fell to its lowest level since April 2020. Separations (including voluntary quits and nonvoluntary layoffs and discharges) remained little changed.

Light vehicle sales rose at their fastest pace since last September, up to a 16.3 million seasonally adjusted annual rate (SAAR). There were gains in the sales of both passenger vehicles and light trucks (a category that includes minivans, SUVs and crossovers). While higher gasoline prices may incentivize more electric drive or hybrid vehicles, historically it has taken several months of higher gasoline prices to impact new vehicle sales.
U.S. manufacturing continued to expand in March according to the ISM Manufacturing PMI®. The headline index rose 0.3 points to 52.7. It was the third consecutive increase and signaled the fastest expansion since August 2022. A reading over 50 indicates expansion and a reading below 50 indicates contraction. Production, new orders, order backlogs and imports expanded while new export orders and employment eased. Supplier deliveries continued to slow and inventories continued to contract for an 11th straight month. Thirteen manufacturing industries reported expansion in March, including chemical products. Three industries reported contraction, including plastics & rubber products.
Manufacturing production in Texas continued to expand in March, albeit at a softer pace, according to the Dallas Fed’s Manufacturing Outlook Survey. The production index lost six points to 6.8, still above zero but corresponding to a below-average pace of growth. Capacity utilization, new orders, and shipments witnessed a similar performance. The general business activity index dipped right under zero while the company outlook fell more into negative territory. Despite this and the outlook uncertainty index rising to its highest level since April 2025, expectations remain positive for increased manufacturing activity six months ahead.
Consumer confidence rose 0.8 points to 91.0 in March as an improvement in consumers’ views of current conditions more than offset declining expectations for the future. Inflation expectations rose to their highest level in six months. Consumers’ plans to buy big-ticket items over the next six months shifted from “yes” and “maybe” in February, to “no” in March. Plans for buying autos improved, but there was a clear preference for used vs. new. Homebuying expectations eased.
Retail and food service sales rose 0.6% in February. The largest gains were in sales at motor vehicle & parts dealers, health & personal care stores, clothing & accessory stores, and sporting goods & hobby stores. Bar and restaurant sales also rose. Compared to a year ago, retail sales were up 3.7% Y/Y.
Combined business inventories (manufacturing, wholesale, and retail) eased by 0.1% in January, as a decline in wholesale inventories offset gains in retail and manufacturing inventories. Combined business sales rose 0.3% as gains in manufacturing and wholesale sales more than offset a small decline in retail sales in January. Compared to a year ago, inventories were up 1.0% Y/Y while sales were ahead by 4.5%. The inventories-to-sales ratio ticked down from 1.36 in December to 1.35 in January.
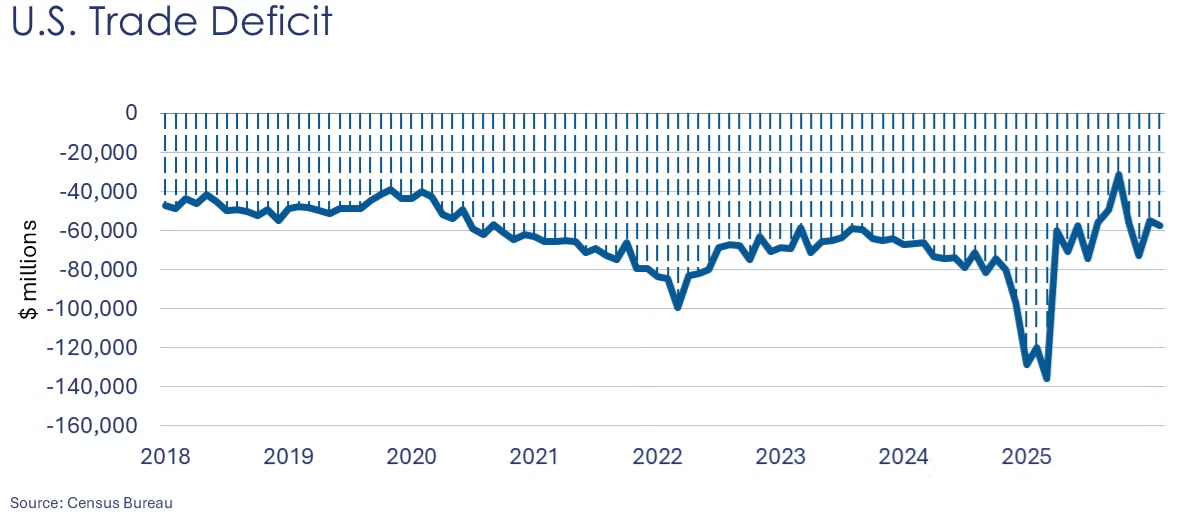
The U.S. trade deficit expanded in February, up by $2.6 billion to $57.3 billion. The deficit rose imports rose faster than exports. The gain in exports was driven by higher exports of nonmonetary gold, natural gas, and services. The increase in imports was driven by higher imports of capital goods (including semiconductors and computers), industrial supplies and materials (including crude oil) and consumer goods (pharmaceuticals), and autos & parts.
CHEMICALS
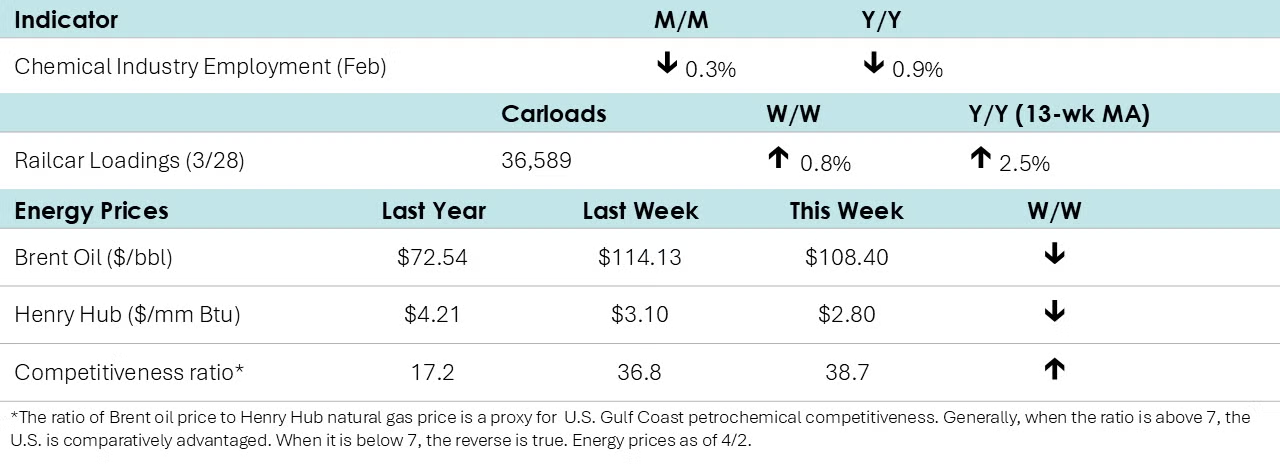
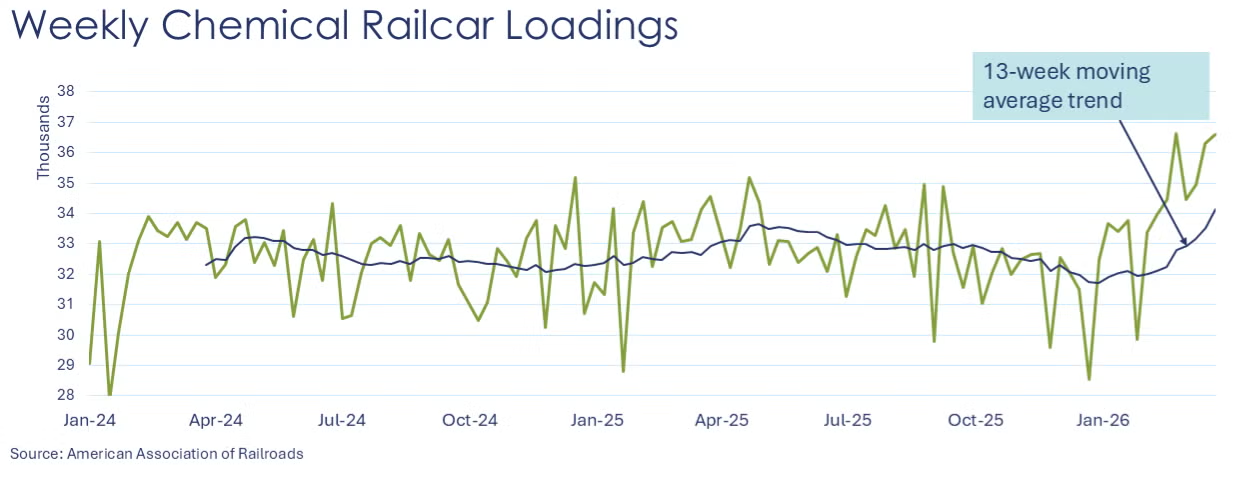
According to data released by the Association of American Railroads, chemical railcar loadings (which include fuel ethanol) rose to 36,589 for the week ending March 28th. Loadings were up 2.5% Y/Y (13-week MA) and up 3.8% YTD.
Chemical industry employment fell by 1,800 (0.3%) to 540,700 in February. Employment in plastic resin manufacturing edged higher by 300 to 59,600. Data for detailed industry segments is lagged by one month.
Employment in the combined chemical and pharmaceutical industry fell in March, lower by 5,200 to 893,100. Employment fell for both production workers and supervisory and non-production workers. Average hourly earnings for production workers rose 2.4% Y/Y. The average workweek was steady at 42.2 hours, suggesting a lower labor input into chemical manufacturing. This contradicts the ISM report that suggested an expansion in chemical products in March.
Within the details of the ISM Manufacturing PMI®, the chemical industry expanded for a third month. New orders, production, new export orders, and imports increased. Inventories were reported to be lower and customers’ inventories were assessed as “too low”. Supplier deliveries were reported to be slower.
One chemical industry respondent to the Dallas Fed’s Texas Manufacturing Outlook Survey noted, “The Iran war and bottleneck in the Strait of Hormuz has caused significant supply chain disruption from China, allowing the U.S. chemicals sector to benefit from the supply bottleneck. We believe this to be short-lived and the situation to return to the lower demand levels in the latter half of 2026.”
Energy Wrap-Up
- Oil prices moved lower compared to a week ago, but remained elevated on concerns about escalation of the conflict in the Middle East.
- The combined oil & gas rig count fell by nine to 536 during the week ending March 27th.
For More Information
ACC members can access additional data, economic analyses, presentations, outlooks, and weekly economic updates through ACCexchange.
In addition to this weekly report, ACC offers numerous other economic data that cover worldwide production, trade, shipments, inventories, price indices, energy, employment, investment, R&D, EH&S, financial performance measures, macroeconomic data, plus much more. To order, visit the ACC Store.
Every effort has been made in the preparation of this weekly report to provide the best available information and analysis. However, neither the American Chemistry Council, nor any of its employees, agents or other assigns makes any warranty, expressed or implied, or assumes any liability or responsibility for any use, or the results of such use, of any information or data disclosed in this material.
Contact us via email.


