Running tab of macro indicators: 8 out of 20
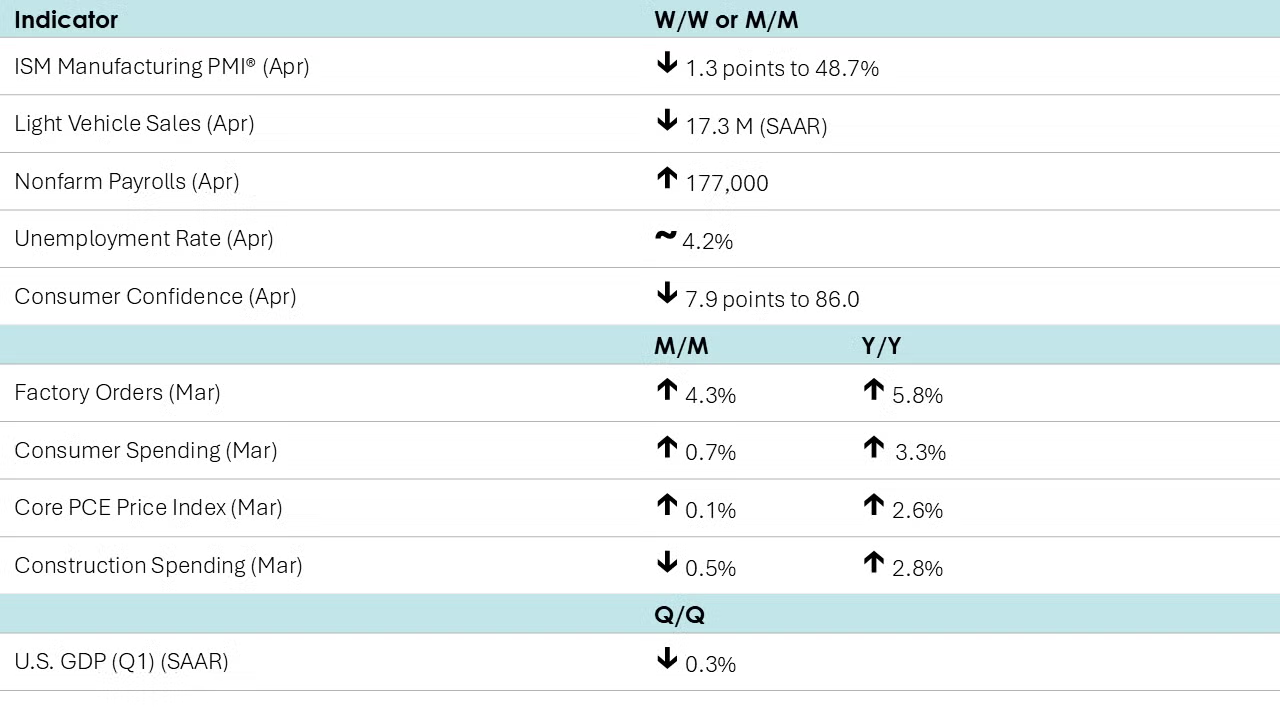
Nonfarm payrolls expanded by 177,000 in April despite market turmoil and uncertainty about the economy. Manufacturing employment edged lower by 1,000 with a 4,700 decline in motor vehicle and parts employment. Employment in transportation and warehousing jumped by 29,000. While federal government employment fell by 9,000, employment in state & local government increased. Growth in average hourly earnings was steady at 3.8% Y/Y. The unemployment rate remained steady at 4.2%. Alternative measures of unemployment also remained essentially steady.
Job openings eased for a second straight month in March, down 288,000 to 7.2 million. The number of quits was unchanged and the number of economy-wide layoffs edged down despite DOGE cuts to the federal workforce. The job market was relatively stable in March, but a lot has happened since then.
Light vehicle sales fell back from their near-four year high in April to a 17.3 million seasonally adjusted annual rate (SAAR). It would have been another four-year high if not for March’s blistering 17.8 million pace. Sales of light trucks and passenger cars both eased.
Consumer spending jumped by 0.7% in March as consumers stocked up ahead of tariffs. The gain was led by a strong (3.2%) increase in spending on durable goods. Personal income (the ability to spend) rose 0.5%. Compared to a year ago, real (inflation-adjusted) consumer spending was up 3.3% Y/Y while real disposable personal income was up 1.7% Y/Y. The price index for personal consumption expenditures (PCE) rose 2.3% Y/Y while the core PCE price index (which excludes food and energy) rose 2.6% Y/Y. The report suggest that spending was strong and inflation moderating going into the end of Q1.

U.S. manufacturing activity contracted for a second month in a row in April, according to the ISM Manufacturing PMI® which fell to 48.7%. Nearly every subcomponent was in contraction territory; an exception was inventories which expanded for a second month. The production index fell to its lowest level since 2020 and the monthly decline in new export orders component was the largest since April 2020.
The general business activity index of the Texas Manufacturing Outlook Survey fell 19.5 points in April to -35.8, its lowest reading since May 2020. While production continued to move higher, orders and the growth rate of orders fell sharply. Shipments, employment, and unfilled orders were also lower. Inventories continued to rise, however. Looking six months ahead, expectations for general business activity worsened compared to March.
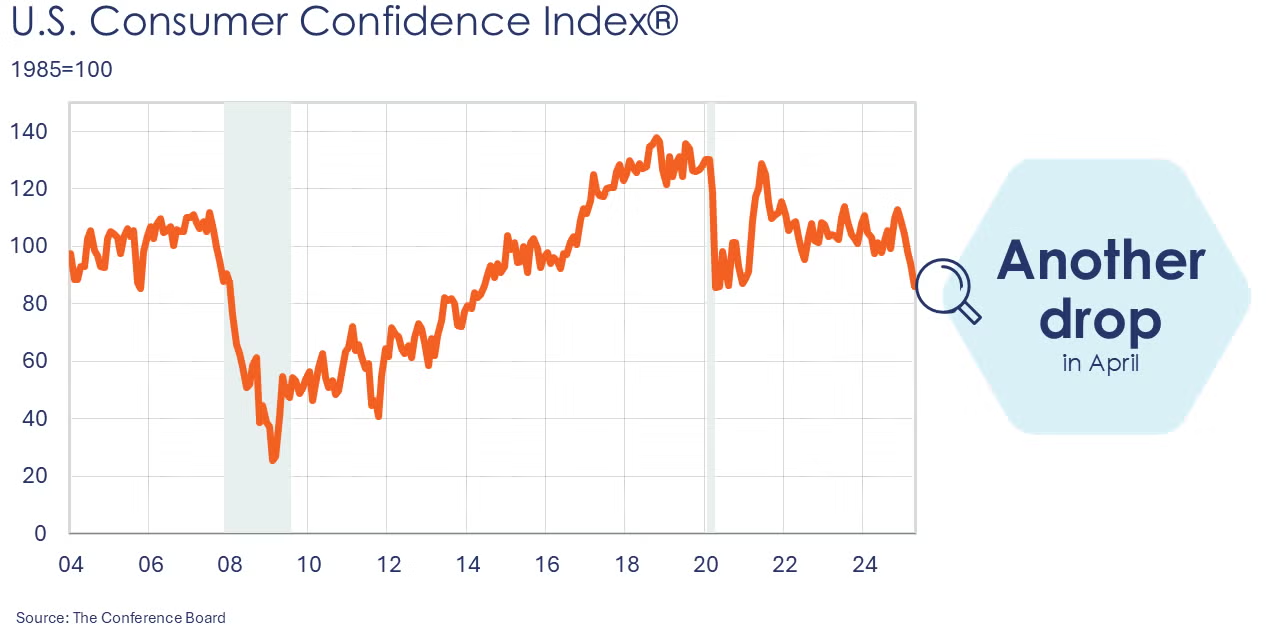
Consumer confidence fell for a fifth consecutive month in April, down 7.9 points to 86.0. Consumer’s assessment of current business and labor market conditions continued to decline. Based on consumers’ short-term outlook for income, business, and labor market conditions, the Expectations Index dropped to its lowest level since October 2011 and was well below the threshold of 80 that usually signals a recession ahead. Inflation expectations were also sharply higher. Consumers’ plans to purchase big-ticket items pulled back and were lower for all service categories.
Headline factory orders surged by 4.3% in March, but the gain was almost entirely in civilian aircraft and motor vehicles. Core business orders edged higher by 0.1%. compared to a year ago, headline orders were up 5.8% Y/Y. Unfilled orders (a measure of the manufacturing pipeline) rose by 2.0%, the largest monthly increase since 2013. Manufacturing shipments eased, down 0.1% and inventories edged higher by 0.1%. The inventories-to-shipments ratio was stable at 1.45.
U.S. GDP contracted at a 0.3% seasonally adjusted annual rate during Q1, according the first of three estimates from the Bureau of Economic Analysis. The contraction primarily reflected an increase in imports and a decrease in government spending that were partly offset by increases in inventory investment, nonresidential fixed investment, consumer spending, and exports.
Construction spending pulled back in March, down 0.5%. Spending was lower across a wide range of segments, including residential improvements, manufacturing, commercial, lodging, office, healthcare, and education. Compared to a year ago, however, spending remained ahead by 2.8% Y/Y.
Indicators for the business of chemistry suggest a yellow banner.
The chemical industry expanded in April according to the details of the ISM Manufacturing PMI® report. New orders and inventories expanded while new export orders, production, employment, order backlogs, and imports were lower. The chemical industry reported slower supplier deliveries and deemed customer inventories to be “too low”. The report noted that plastic resin was reported to be in short supply during April. Among the comments, one chemical products producer noted that “Uncertainty over tariffs is providing a big challenge…”
Within the comments of the Texas Manufacturing Survey, there were several comments from chemical manufacturers, including:
- “It is a very dynamic time. I agree with the approach and need to bring manufacturing back to the U.S. so that we have the internal capability for national security interests. The ability to forecast and to understand consumer confidence drivers to the basic materials, construction, automotive markets, etc., are the most difficult we have seen since the COVID era."
- "Tariff uncertainty and actual impact is likely to be significant for the business and ongoing projects.”
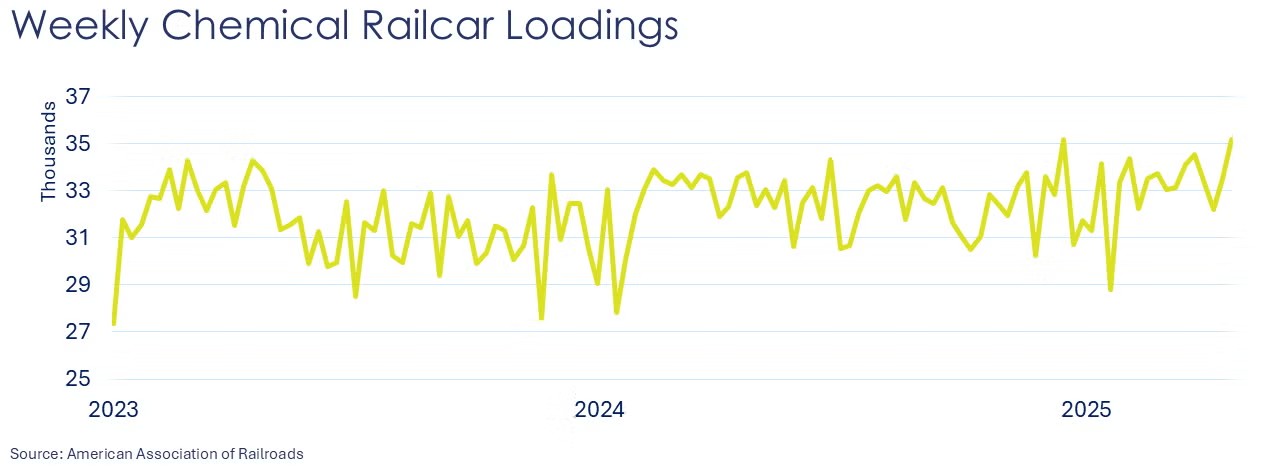
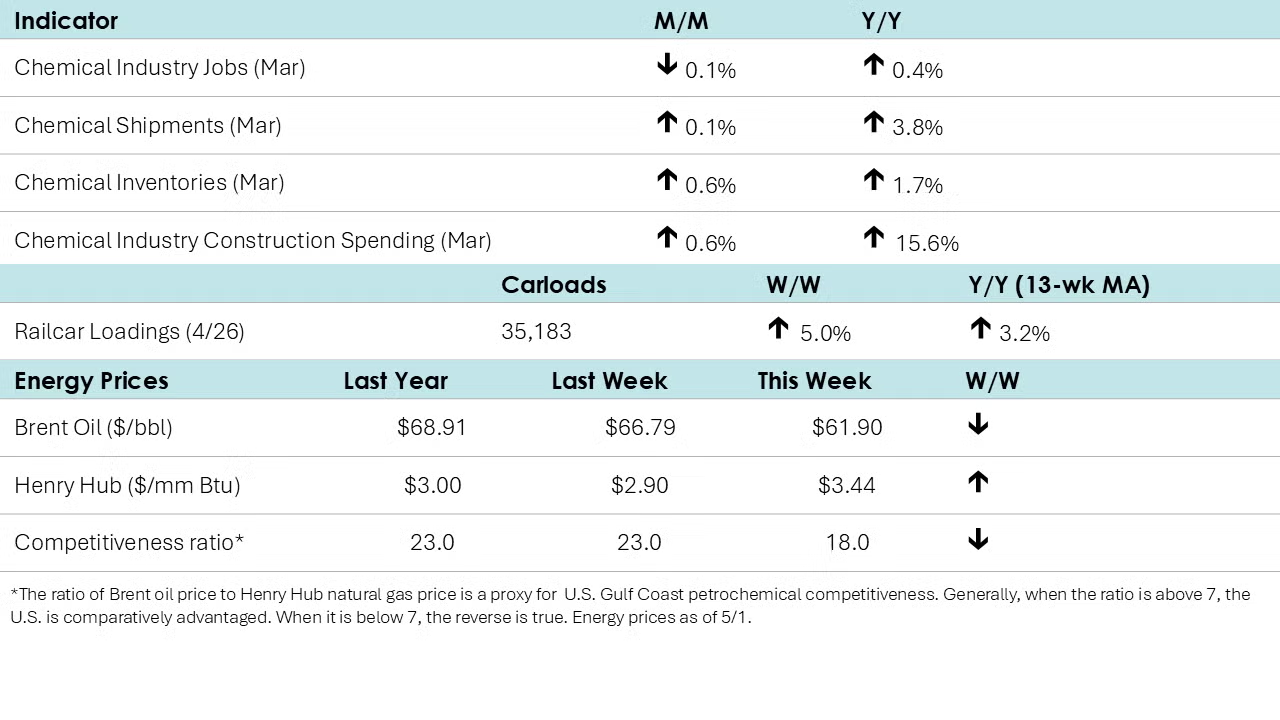
According to data released by the Association of American Railroads, chemical railcar loadings were up to 35,183 for the week ending April 26th. Loadings were up 3.2% Y/Y (13-week MA), up (2.0%) YTD/YTD and have been on the rise for nine of the last 13 weeks. It was the highest level since March 2022.
Chemical shipments edged higher by 0.1% (up 3.8% Y/Y). It was the sixth consecutive increase with gains across all major segments. Chemical inventories rose 0.6% in March, the third consecutive monthly increase, and were up 1.7% Y/Y.
Chemical industry jobs fell by 0.1% in March to 548,900 (up 0.4% Y/Y). Employment in plastic resin manufacturing also fell, down by 0.6% to 61,200, a level 0.5% higher than last March. (Note that data at the detailed industry level are lagged one month behind the headline jobs report.)
In April, combined chemical and pharmaceutical jobs rose by 100 to 902,000, a level up 0.6% Y/Y. A decline in the number of production workers was more than offset a gain in supervisory & non-production workers. Average hourly earnings for production workers rose 4.1% Y/Y to $31.69. The average workweek edged higher from 41.9 hours to 42.0 hours in April.
Chemical industry construction spending continued to move higher in March, up by 0.6% to a $41.9 billion seasonally adjusted annual rate. The chemical industry represented 18% of total manufacturing construction spending. Compared to a year ago, spending was up 15.6% Y/Y.
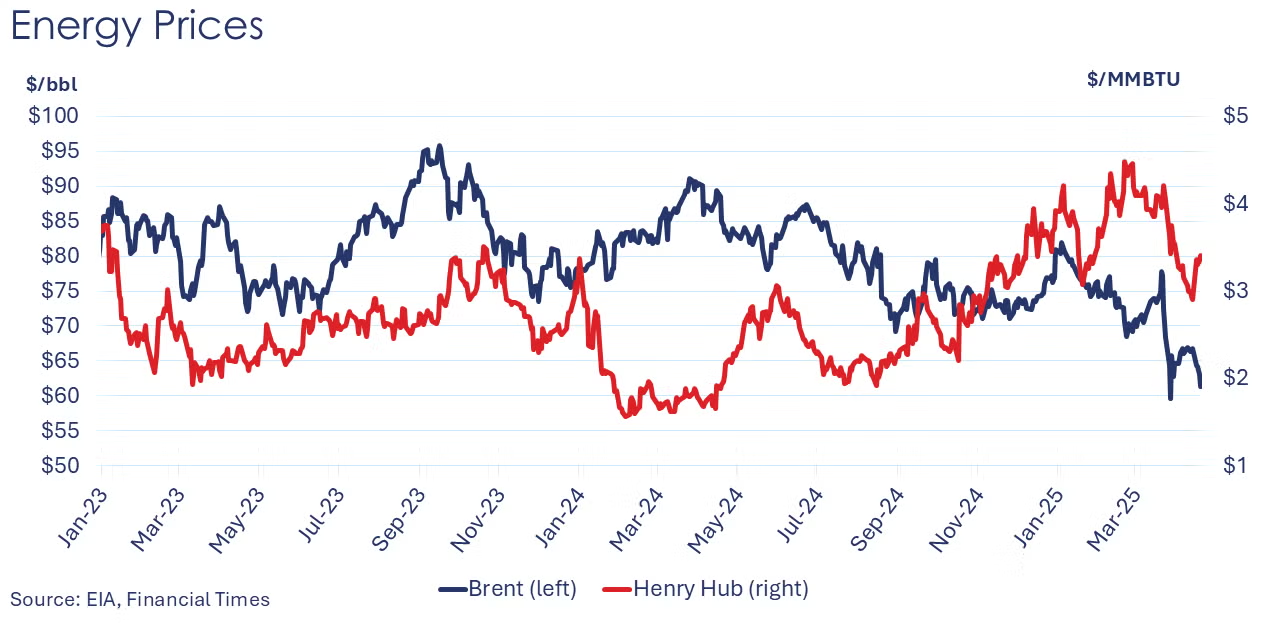
Energy Wrap Up
Oil prices trended lower this week on lower demand expectations due to the trade war.
- U.S. natural gas futures jumped as the front month rolled to June.
- Natural gas inventories posted their seventh consecutive build, up by 107 BCF.
- The combined oil & gas rig count rose by three to 582.
Note On the Color Codes
Banner colors reflect an assessment of the current conditions in the overall economy and the business chemistry of chemistry. For the overall economy we keep a running tab of 20 indicators. The banner color for the macroeconomic section is determined as follows:
Green – 13 or more positives
Yellow – between 8 and 12 positives
Red – 7 or fewer positives
There are fewer indicators available for the chemical industry. Our assessment on banner color largely relies upon how chemical industry production has changed over the most recent three months.
For More Information
ACC members can access additional data, economic analyses, presentations, outlooks, and weekly economic updates through ACCexchange.
In addition to this weekly report, ACC offers numerous other economic data that cover worldwide production, trade, shipments, inventories, price indices, energy, employment, investment, R&D, EH&S, financial performance measures, macroeconomic data, plus much more. To order, visit the ACC Store.
Every effort has been made in the preparation of this weekly report to provide the best available information and analysis. However, neither the American Chemistry Council, nor any of its employees, agents or other assigns makes any warranty, expressed or implied, or assumes any liability or responsibility for any use, or the results of such use, of any information or data disclosed in this material.
Contact ACC's Economics & Data Analytics department via email.