Running tab of macro indicators: 15 out of 20
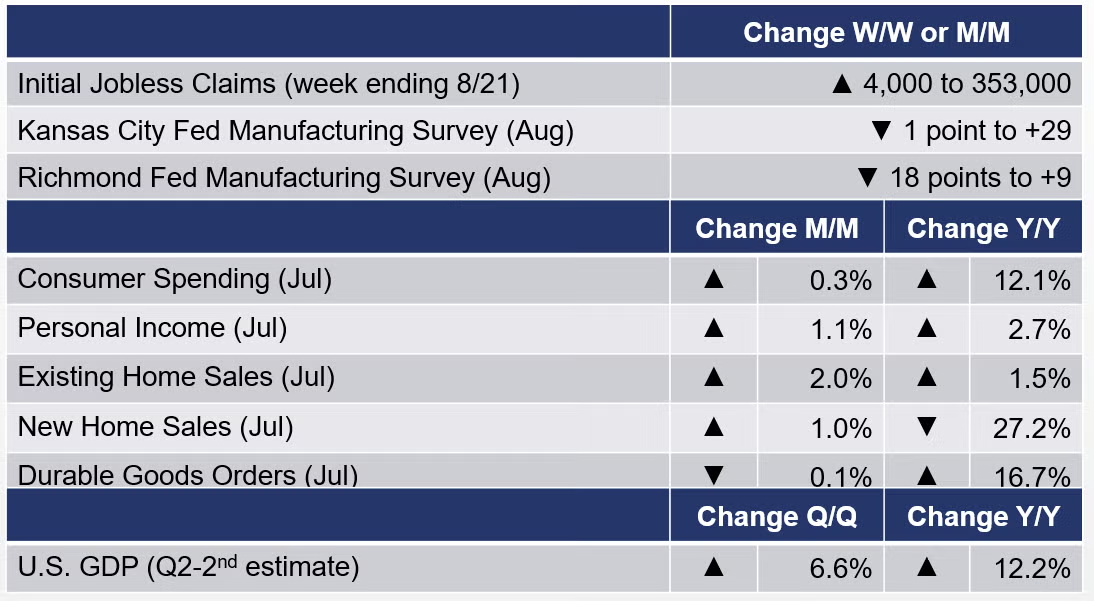
The number of new jobless claims rose by 4,000 to 353,000 during the week ending 20 August. Continuing claims declined by 3,000 to 2.862 million and the insured unemployment rate for the week ending 14 August was stable at 2.1%.
The BEA reported that real gross domestic product (GDP) increased at a slightly higher annual rate of 6.6% in the 2nd quarter according to the "second" estimate. In the 1st quarter, real GDP increased at a 6.3% annual pace. This latest GDP estimate is based on more complete source data than were available for the "advance" estimate issued last month. The update reflects upward revisions to business investment and exports that were partly offset by downward revisions to inventory accumulation, residential fixed investment, and state and local government spending. Imports, which are a subtraction in the calculation of GDP, were revised down.
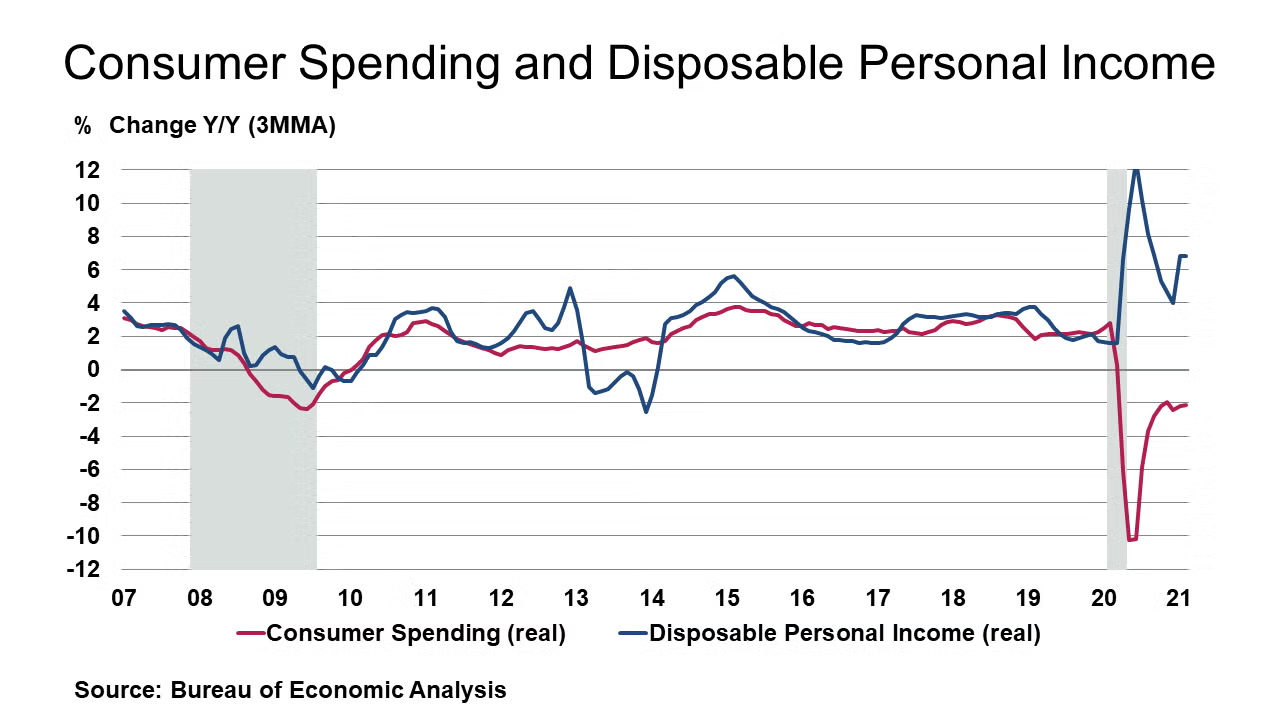
Led by gains in compensation as well as transfer payments, personal income increased $225.9 billion (1.1%) in July. Disposable personal income (DPI) increased $198.0 billion (1.1%) at the same time. Consumer spending rose only 0.3% with softness in spending for durable goods offset by gains in spending for services. The PCE price index increased 0.4% in July and excluding food and energy the so-called core PCE price index increased 0.3%, leaving headline prices up 4.2% Y/Y and core prices up 3.6% Y/Y, the highest pace since the early-1990s and well above the Fed’s targeted rate. As a result, real DPI increased 0.7% in July and real consumer spending decreased 0.1%.
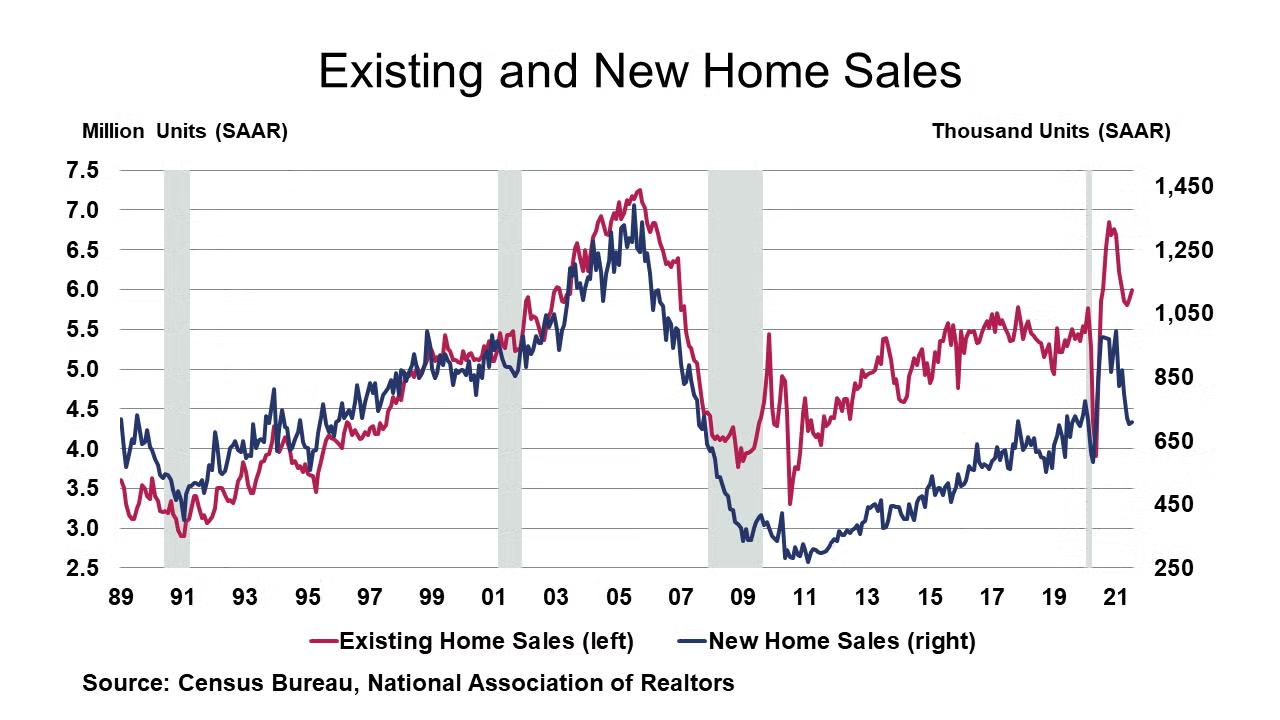
Existing home sales rose a larger-than-expected 2.0% to a 5.99-million-unit pace in July. The Northeast was flat but all other regions experienced gains. This was the second monthly gain, and left sales up 1.5% Y/Y. Inventories of homes for sale, however, rose 7.3% to 1.32 million at the end of July, a 2.6-month supply. Supply is still very lean as a year ago, months’ supply was 3.1 months and inventories were off 12.0% Y/Y. That said, months’ supply has risen from 1.9 months at the start of the year as higher prices push some potential homebuyers out of the market. Median sales prices of $359,900 were up 17.8% Y/Y. New home sales rose 1.0% to an annual pace of 708,000 in July, partially offsetting two weak months. Combined revisions to prior months were upwards. July sales fell sharply in the Northeast and Midwest but rose elsewhere. New houses for sale at the end of July was 367,000, up 5.5% from June and up 26.1% Y/Y. This pushed the inventory-to-sales ratio up to a 6.2 months’ supply, which was 3.6 months a year ago. The median sales price of new houses sold in July was $390,500, up 18.4% Y/Y.
“Headline” durable goods orders for July eased 0.1% as there was a large drop in orders for civilian aircraft. Orders for non-defense capital goods excluding aircraft (a proxy for business investment) was flat. This is a notoriously volatile report subject to large revisions. Orders for primary metals, fabricated metal products, and computers all advanced.
The Richmond Fed reported that Fifth District manufacturing activity improved in August. The composite index declined from 27 in July to 9 in August but remained in expansionary territory, as all three component indexes -- shipments, new orders, and employment -- decreased but remained positive. Several manufacturers, however, reported deteriorating local business conditions. Survey contacts also noted that lead times continued to increase, and inventories remained low. Overall, they were optimistic that conditions would improve in the next six months. The Kansas City Fed reported that Tenth District manufacturing activity continued at a strong pace, and expectations for future activity remained solid. The take on prices paid for raw materials continued to increase for most firms in August and prices received for finished goods rose to a new survey high. Prices vs. a year ago expanded near record levels. Moving forward, district manufacturing firms expected materials prices and finished goods prices to continue to rise over the next six months.
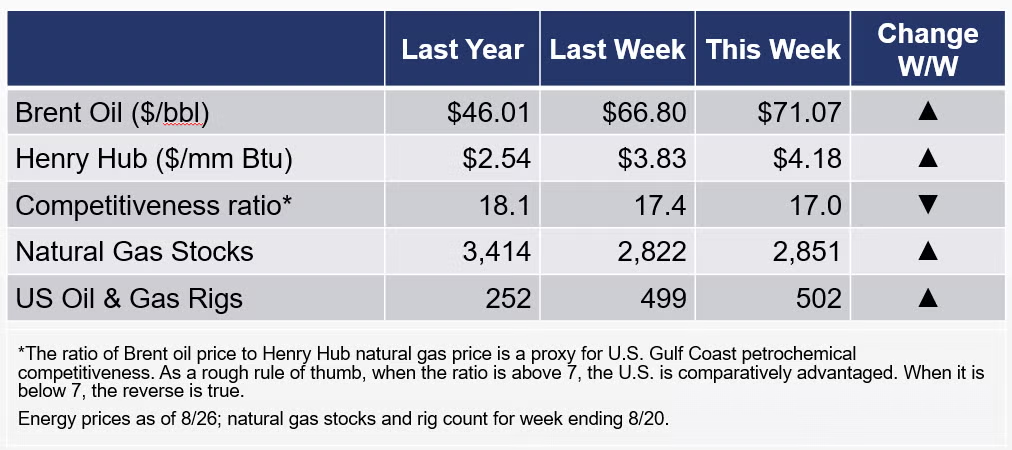
The rig count rose by three to 502 rigs during the week ending 20 August. The gains in natural gas stocks continue to fall short, and there has been some upward pressure on gas prices.
For the business of chemistry, the indicators still bring to mind a green banner for basic and specialty chemicals.
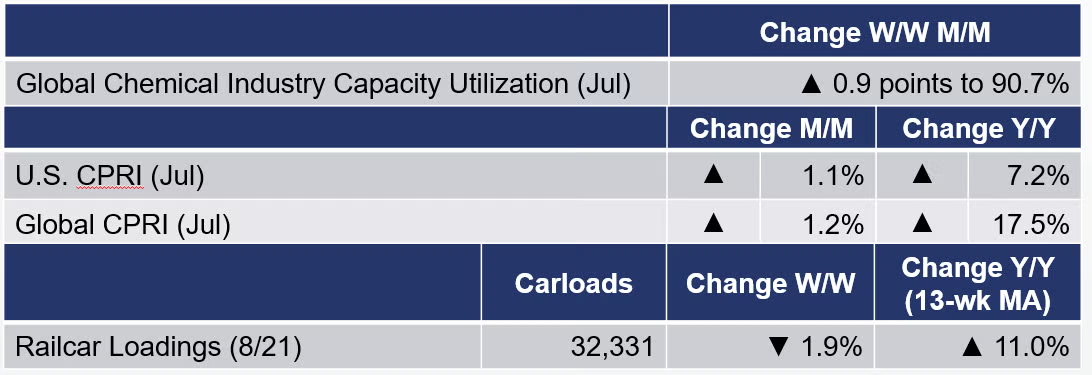
According to data released by the Association of American Railroads, chemical railcar loadings, the best ‘real time’ indicator of chemical industry activity, fell by 1.9% to 32,331 railcars during the week ending 21 August (week 33). Loadings were up 2.9% Y/Y and up 5.9% YTD/YTD. The 13-week moving average, which is used to smooth out volatility, was up 11.0%.
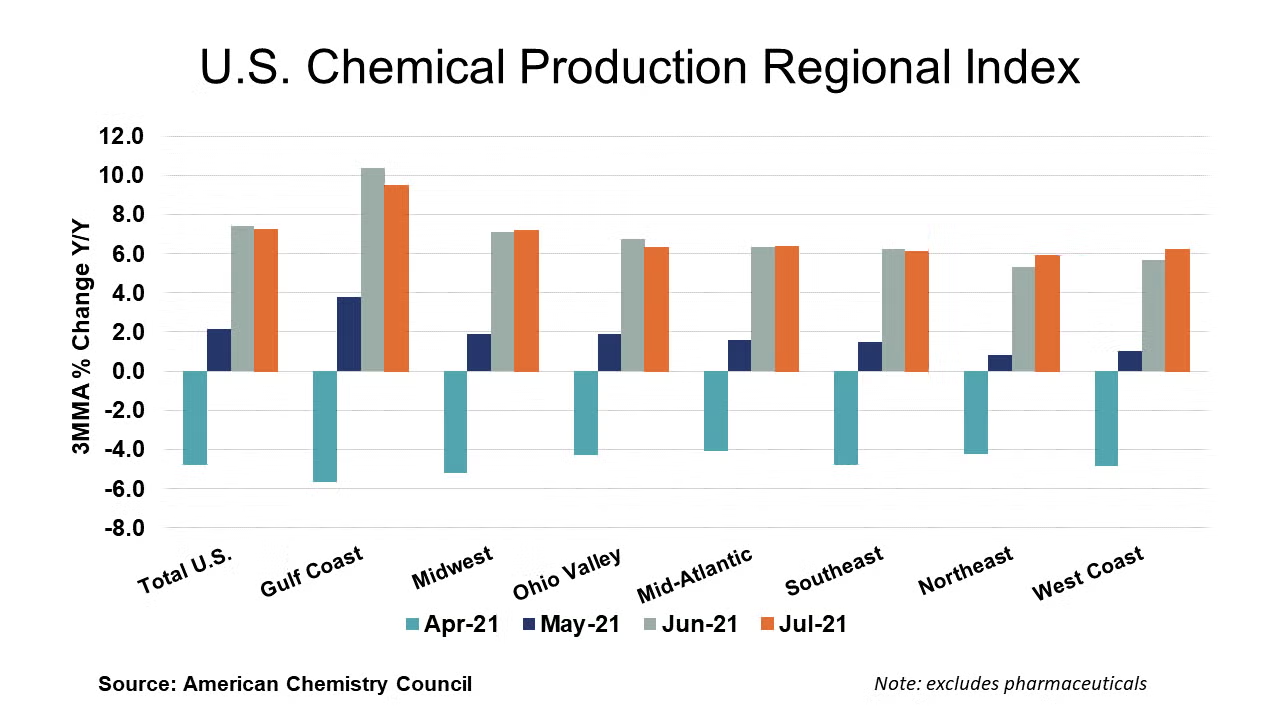
The U.S. Chemical Production Regional Index (U.S. CPRI), which is measured as a three-month moving average (3MMA), rose by 1.1% in July following a 3.5% gain in June and a 5.5% rebound in May. During July, chemical output rose in all regions, reflecting continued demand for chemistry products. Compared with July 2020, U.S. chemical production rose 7.2%, a sharply higher comparison. Chemical production was higher than a year ago in all regions.
Chemical production was mixed in July with an improving trend in the production of organic chemicals, fertilizers, adhesives, coatings, chlor-alkali, crop protection chemicals, synthetic rubber, other specialty chemicals, and miscellaneous inorganic chemicals. These gains were offset, however, by weakness in manufactured fibers and consumer products.
As nearly all manufactured goods are produced using chemistry in some form, manufacturing activity is an important indicator for chemical demand. Following a 0.2% gain in June, manufacturing output continued to expand in July, by 0.7%. The 3MMA trend in manufacturing production was mixed with gains in the output of motor vehicles & parts, aerospace, machinery, computers, semiconductors, iron & steel products, foundries, refining, oil & gas extraction, plastic products, rubber products, tires, printing, apparel, and furniture.
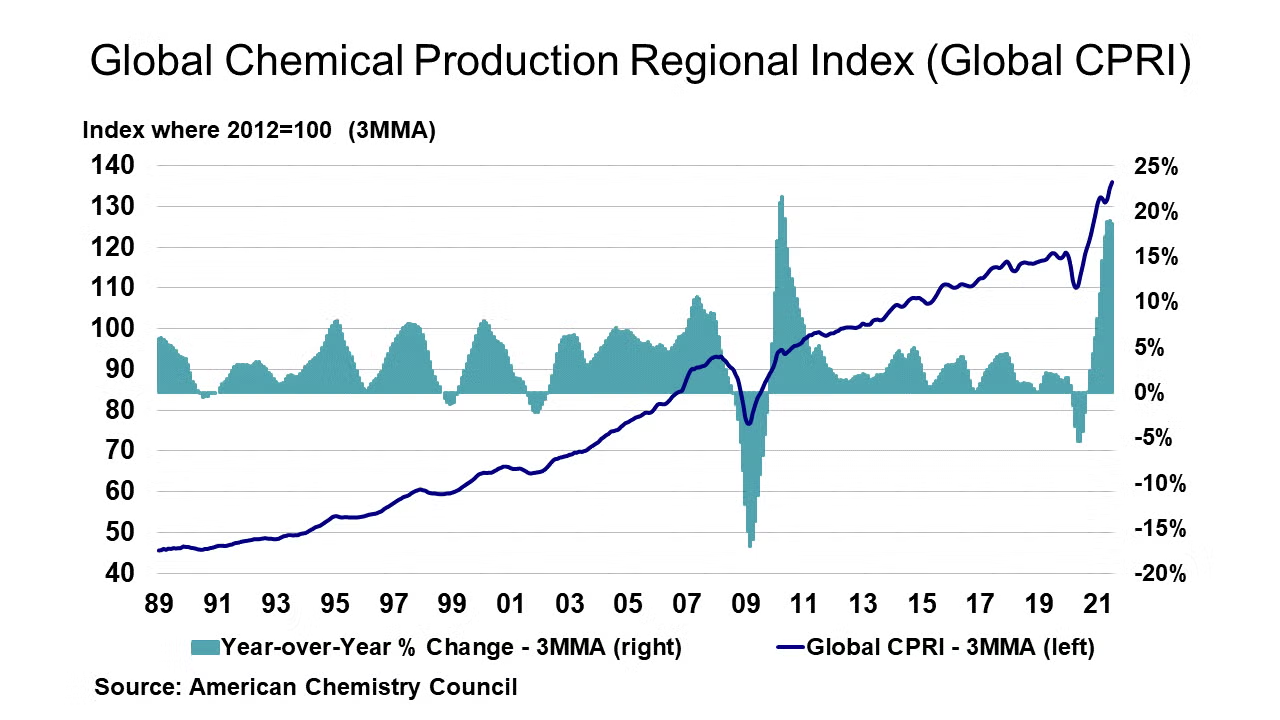
After a couple soft months in the spring, rising activity across many nations and regions caused global chemicals production to further progress, rising 1.2% in July. During July, chemical output increased in all regions except Latin America. Headline global production was up 17.5% Y/Y on a 3MMA basis. Keep in mind that output a year ago was off due to the Covid-19 pandemic. Global production stood at 136.0% of its average 2012 levels and continues to reach new levels.
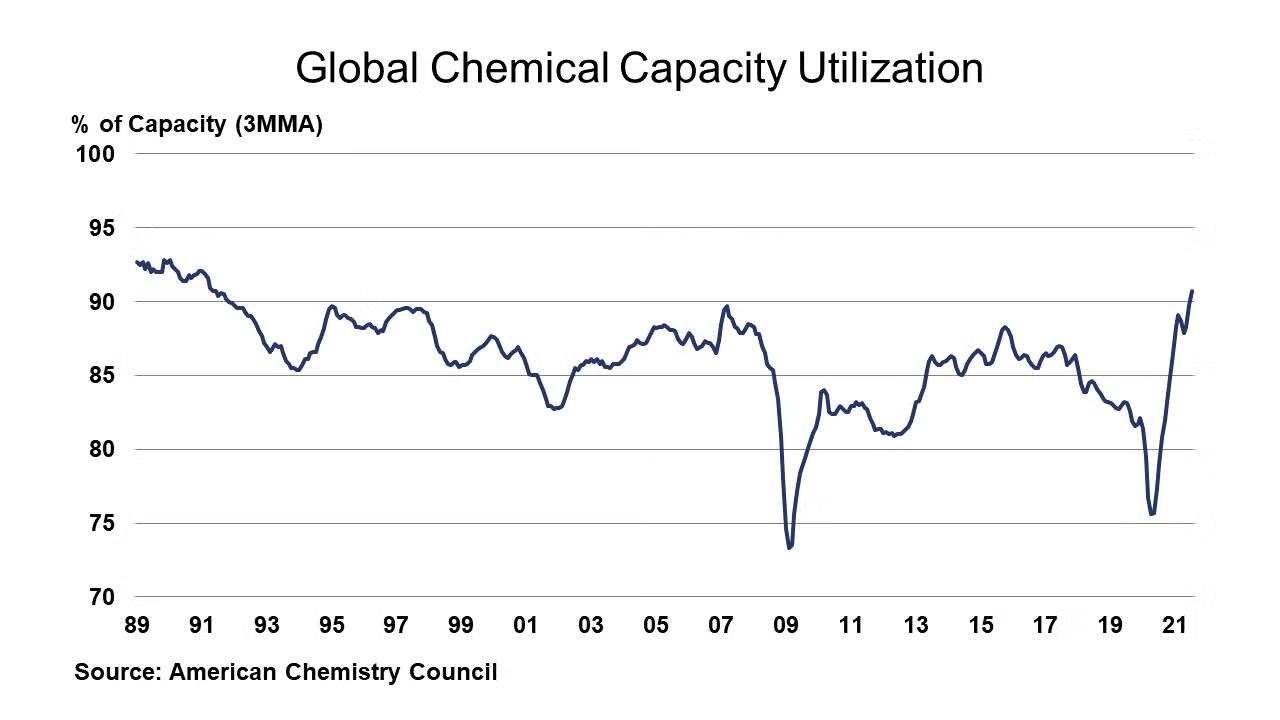
During July, global capacity rose 0.2% and was up 2.3% Y/Y. As a result, with rising output, capacity utilization in the global chemical industry turned up 0.9 percentage points to 90.7%. This is well above 79.0% last July and above the long-term (1987-2019) average of 86.4%. It is the first time in three decades that capacity utilization has been above 90%. Among chemical industry segments, July results were positive across segments. Considering year-earlier comparisons, production gains occurred in all segments.
Note On the Color Codes
The banner colors represent observations about the current conditions in the overall economy and the business chemistry. For the overall economy we keep a running tab of 20 indicators. The banner color for the macroeconomic section is determined as follows:
Green – 13 or more positives
Yellow – between 8 and 12 positives
Red – 7 or fewer positives
For the chemical industry there are fewer indicators available. As a result we rely upon judgment whether production in the industry (defined as chemicals excluding pharmaceuticals) has increased or decreased three consecutive months.
For More Information
ACC members can access additional data, economic analyses, presentations, outlooks, and weekly economic updates through MemberExchange.
In addition to this weekly report, ACC offers numerous other economic data that cover worldwide production, trade, shipments, inventories, price indices, energy, employment, investment, R&D, EH&S, financial performance measures, macroeconomic data, plus much more. To order, visit https://store.americanchemistry.com/.
Every effort has been made in the preparation of this weekly report to provide the best available information and analysis. However, neither the American Chemistry Council, nor any of its employees, agents or other assigns makes any warranty, expressed or implied, or assumes any liability or responsibility for any use, or the results of such use, of any information or data disclosed in this material.
Contact us at ACC_EconomicsDepartment@americanchemistry.com
Upcoming Events of Interest
“Challenges and Opportunities: API Supply Chain and Structural Developments” Webinar
William DuBay, Global Head of R&D, SK pharmteco and Andrew J. Carpenter, EVP, Manufacturing, Science & Technology, Phlow Corporation
12:30 – 2:00 pm | 8 September 2021
Société de Chimie Industrielle
www.societe.org
“Specialty & Agro Chemicals America”
8-10 September 2021
Belmond Place | Charleston, SC
Chemicals America, Inc.
https://charleston.chemicalsamerica.com/
“Americas Chemicals and Polymers Conference” Virtual Event
14-15 September 2021
Wood Mackenzie
www.woodmac.com/events/americas-chemicals-and-polymers-conference
Hydrocarbon Processing IRPC Operations Virtual Event
Hydrocarbon Processing/Gulf Energy Information
21-22 September 2021
https://web.cvent.com/event/ec87ac54-5d81-48f7-a4db-c7f82f1c4e73/summary
“Economic, Energy and Chemical Industry Trends and Outlook” Webinar
Dr. Kevin Swift, Chief Economist | American Chemistry Council
12:00 – 2:00 pm | 22 September 2021
Société de Chimie Industrielle
www.societe.org

