Running tab of macro indicators: 16 out of 20
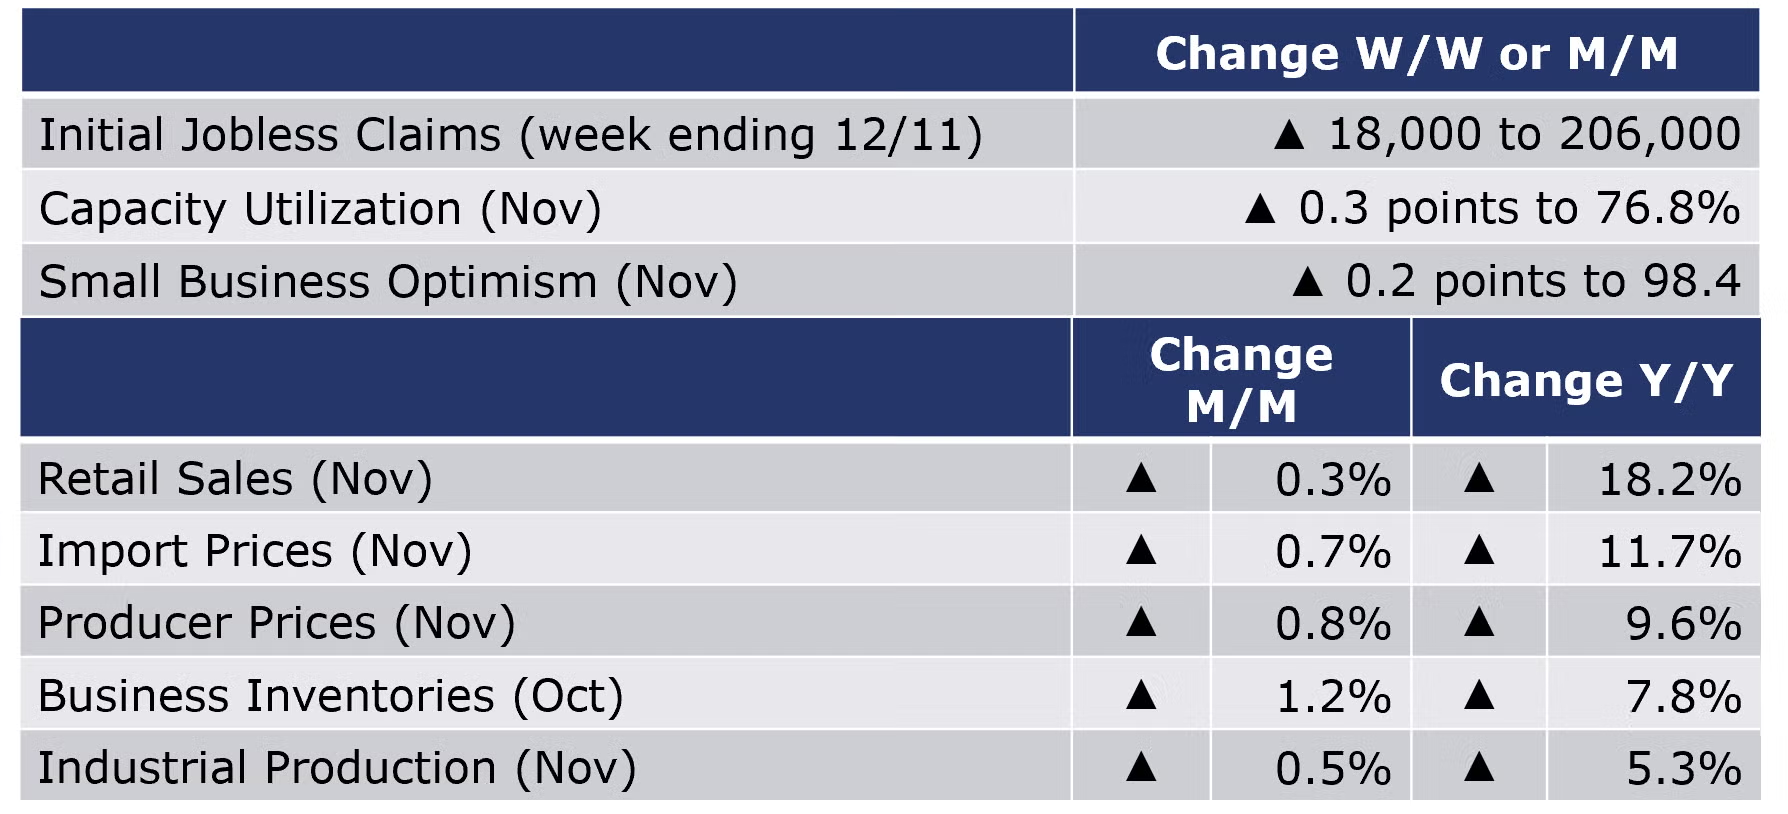
The number of new jobless claims rose by 18,000 to 206,000 during the week ending 11 December. Continuing claims decreased by 154,000 to 1.845 million, and the insured unemployment rate for the week ending 4 December decreased by 0.1% points to 1.4%.
Following three months of strong gains, retail sales went up in November 0.3%. Among major categories, sales were mixed. The strongest gains were in miscellaneous retail stores, furniture, and restaurants. There were declines in electronics & appliance stores and general merchandise (especially department) stores. Compared to a year ago, retail sales were up 18.2%.
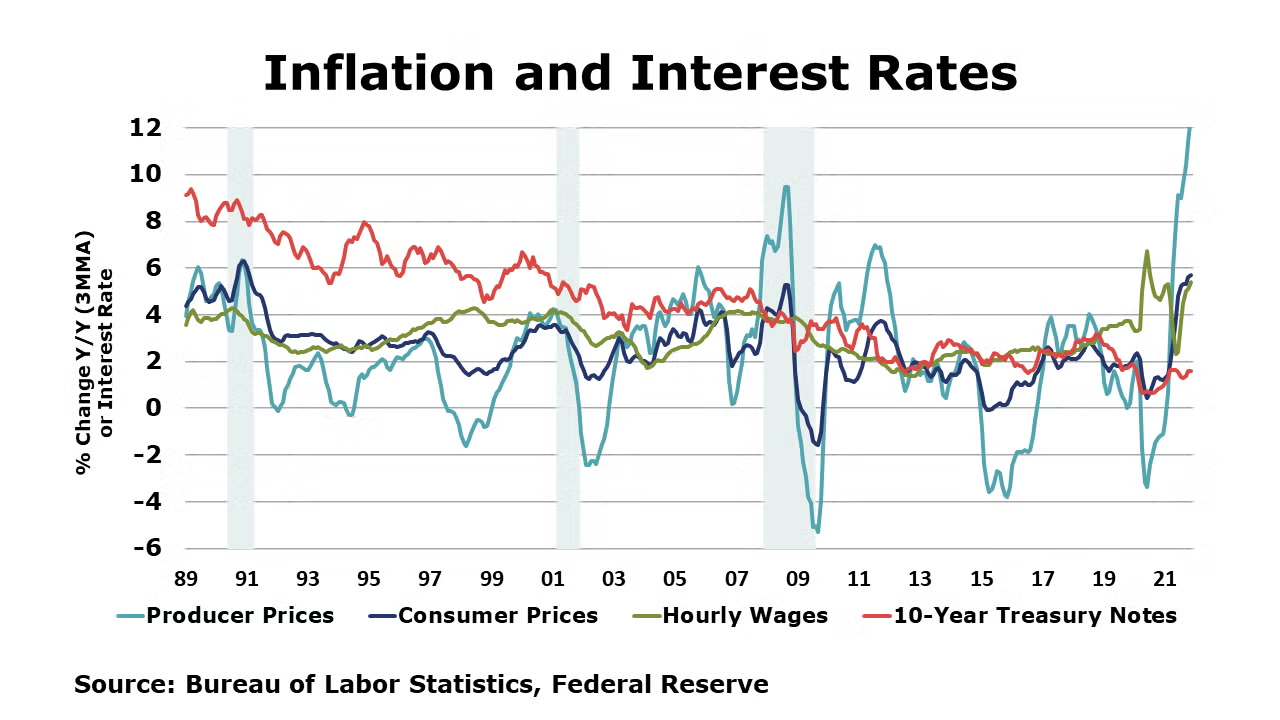
Producer prices continued to surge in November, up by 0.8%. November’s gain follows increases of 0.6% the previous three months. As with consumer prices which came out last week, the largest gains were in prices for goods, including iron & steel scrap, gasoline, fresh fruits, vegetables, industrial chemicals, and jet fuel. Excluding the volatile food and energy components, core producer prices were up by 0.7%. Compared to a year ago, headline consumer prices were up 9.6% Y/Y while core prices were up 6.9% Y/Y.
Import prices rose by 0.7% in November, following a 1.5% gain in October. The gain was due to both fuel and non-fuel prices. Import prices rose 11.7% over the last 12 months, the highest level since 2011. Export prices rose 1% following a 1.6% rise in October. Compared to a year ago, export prices were up 18.2% Y/Y; the largest jump since the series was first published in 1984.
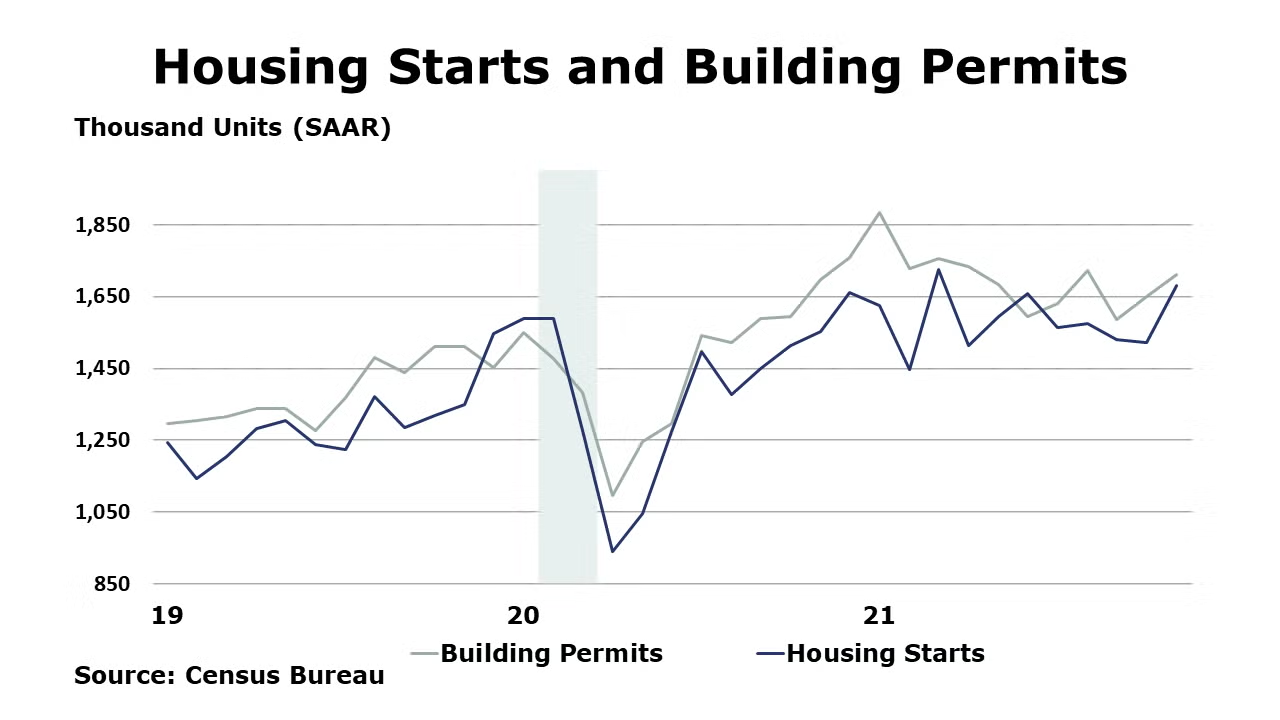
Despite ongoing labor and material shortages, housing starts rose 11.8% from November and 8.3% higher than November 2020. Forward-looking building permits rose by 3.6% compared to October, and 0.9% above November 2020. Separately, homebuilder sentiment edged higher in December (the fourth straight month) on strong consumer demand, as measured by the NAHB/Wells Fargo Housing Market Index (HMI).
Led by a second large gain in wholesale inventories, combined business inventories rose 1.2% in October, following a 0.8% increase in September. Combined business sales also rose strongly with increasing sales along all three main channels. Compared to a year ago, sales were up 16.7% Y/Y while inventories were up by 7.8% Y/Y. With sales growth outpacing inventory growth, the inventories-to-shipments ratio moved lower from 1.26 in September to 1.24 in October, the lowest in more than 10 years.
Industrial production rose by 0.5% in November, following a 1.7% gain in October. Manufacturing output expanded by 0.7%, following a 1.4% rebound in October. The largest gains were in motor vehicles, nonmetallic mineral products, paper, and plastics and rubber products. Compared to a year ago, industrial production was up 5.3% Y/Y. Capacity utilization tightened by 0.3 points to 76.8%, higher than a year ago when it was at 73.3%.
Small business optimism edged slightly higher in November up by 0.2 points to 98.4. Of the 10 components used to construct the index, four improved, four declined, and two remained unchanged. Small business owners expecting better business conditions six months from now continued to decline and tied for a 48-year record low reading.
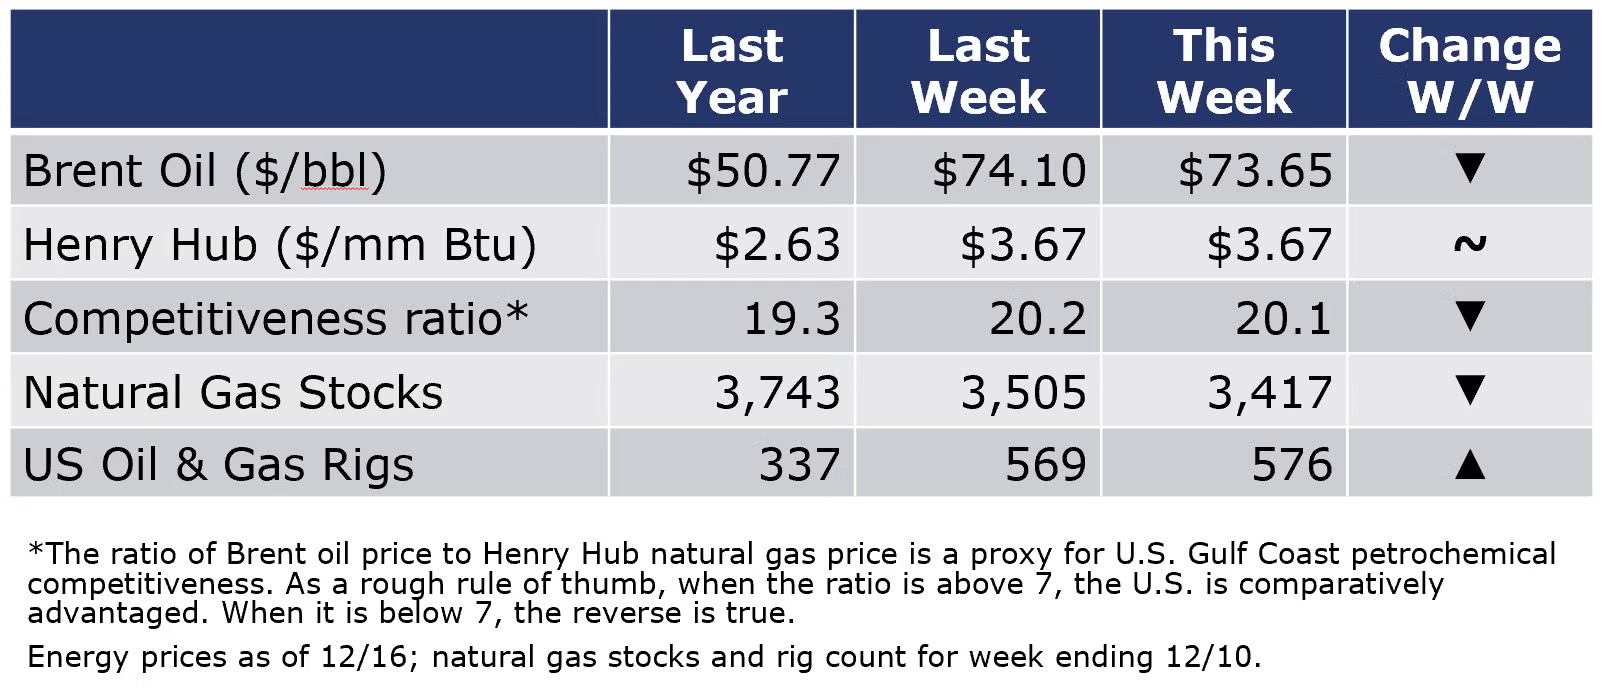
The combined oil and gas rig count rose by seven to 576 during the week ending 10 December. Natural gas inventories fell by 88 BCF and remain just below the five-year historic average. Oil prices moved higher this week as higher demand expectations and the Fed announcement offset concerns about Omicron.
For the business of chemistry, the indicators still bring to mind a green banner for basic and specialty chemicals.
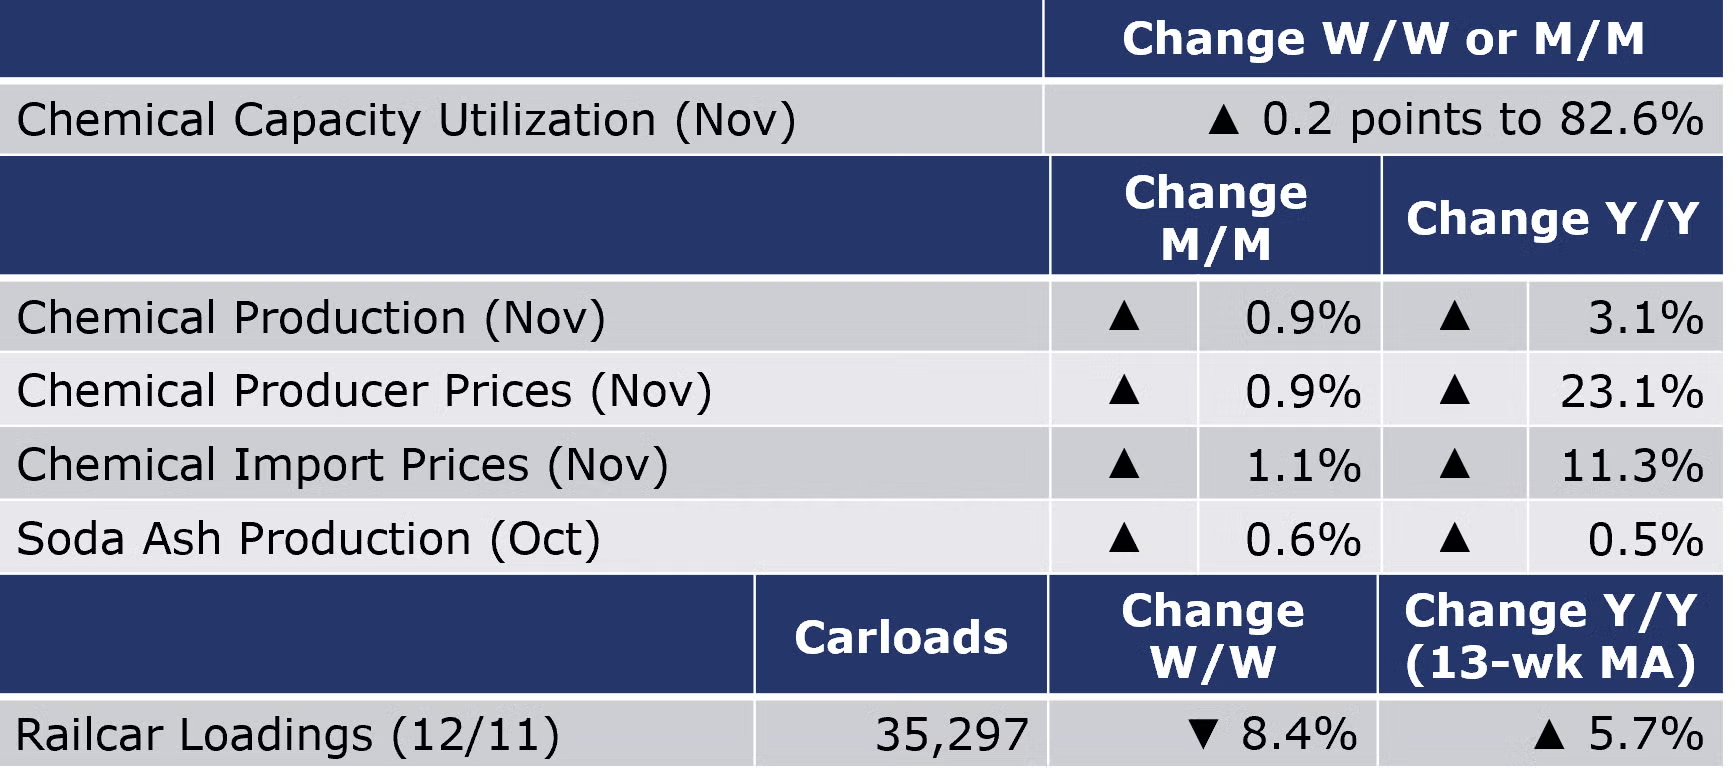
According to data released by the Association of American Railroads, chemical railcar loadings fell by 3,226 carloads to 35,297 for the week ending 11 December. Loadings were up 8.3% Y/Y, up 5.7% YTD/YTD and have been on the rise for 8 of the last 13 weeks.
The U.S. Geological Survey reported that monthly production of soda ash in October was 942 thousand tons, up slightly (0.6%) compared to September, which was revised downward. On a Y/Y basis, production was up 0.5%. Stocks rose 28.8% M/M to 268 thousand tons at the end of the month, a 9-day supply. Ending stocks were down 8.5% Y/Y.

Chemical production rose by 0.9% in November, following an upwardly revised 4.0% rebound in October. Chemical production was higher across most categories except synthetic dyes & pigments, plastic resins, synthetic rubber, and manufactured fibers. The strongest sequential gains were in fertilizers, crop protection, and coatings. Chemical production was 3.1% Y/Y. Chemical capacity utilization also rose, by 0.2 points to 82.6%. This was slightly ahead of the 82.5% capacity utilization a year ago.
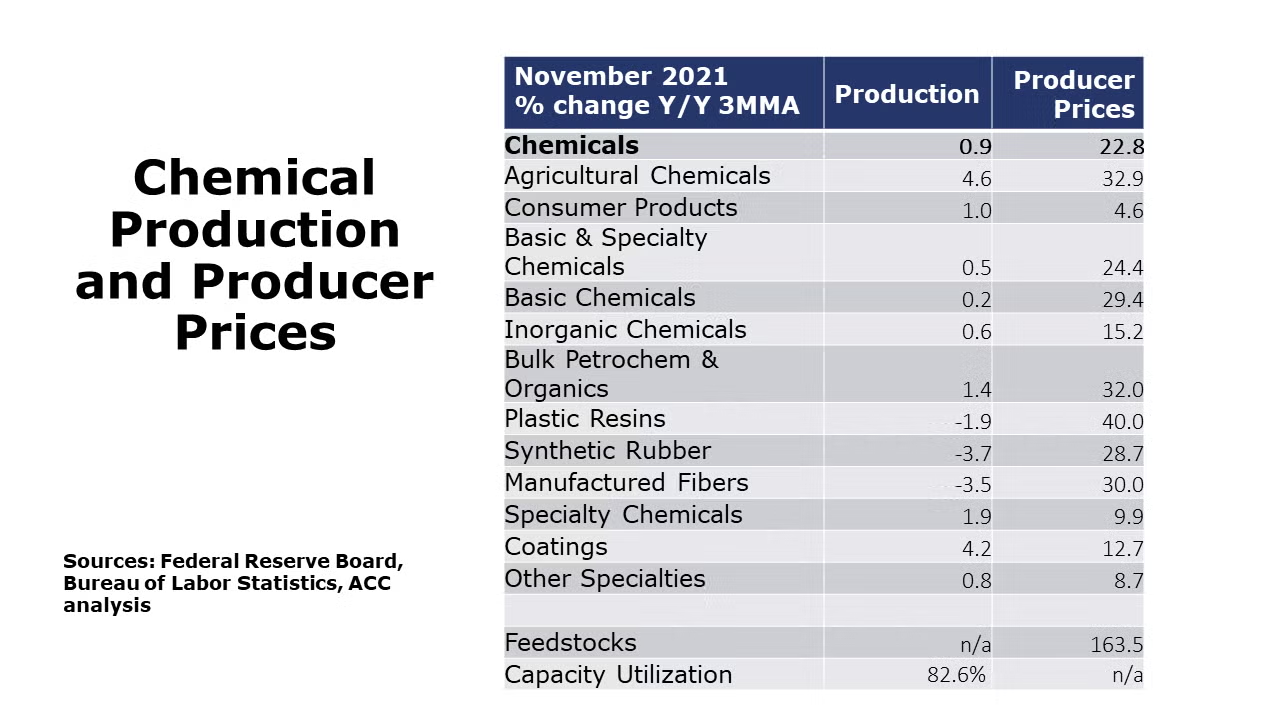
Chemical producer prices continued to increase for an 18th consecutive month in November, up by 0.9%. There were sequential gains across nearly all segments except plastic resins and synthetic rubber. The largest gains were in agricultural chemicals and bulk petrochemicals and organic intermediates. Compared to last November, chemical producer prices were up 23.1% Y/Y. Import prices for chemicals rose 1.1% in November and are up 11.3% Y/Y. Export prices for chemicals rose 1.2% in November and are up 13.2% Y/Y.
Note On the Color Codes
The banner colors represent observations about the current conditions in the overall economy and the business chemistry. For the overall economy we keep a running tab of 20 indicators. The banner color for the macroeconomic section is determined as follows:
Green – 13 or more positives
Yellow – between 8 and 12 positives
Red – 7 or fewer positives
For the chemical industry there are fewer indicators available. As a result we rely upon judgment whether production in the industry (defined as chemicals excluding pharmaceuticals) has increased or decreased three consecutive months.
For More Information
ACC members can access additional data, economic analyses, presentations, outlooks, and weekly economic updates through MemberExchange.
In addition to this weekly report, ACC offers numerous other economic data that cover worldwide production, trade, shipments, inventories, price indices, energy, employment, investment, R&D, EH&S, financial performance measures, macroeconomic data, plus much more. To order, visit http://store.americanchemistry.com/.
Every effort has been made in the preparation of this weekly report to provide the best available information and analysis. However, neither the American Chemistry Council, nor any of its employees, agents or other assigns makes any warranty, expressed or implied, or assumes any liability or responsibility for any use, or the results of such use, of any information or data disclosed in this material.
Contact us at ACC_EconomicsDepartment@americanchemistry.com

