Running tab of macro indicators: 18 out of 20
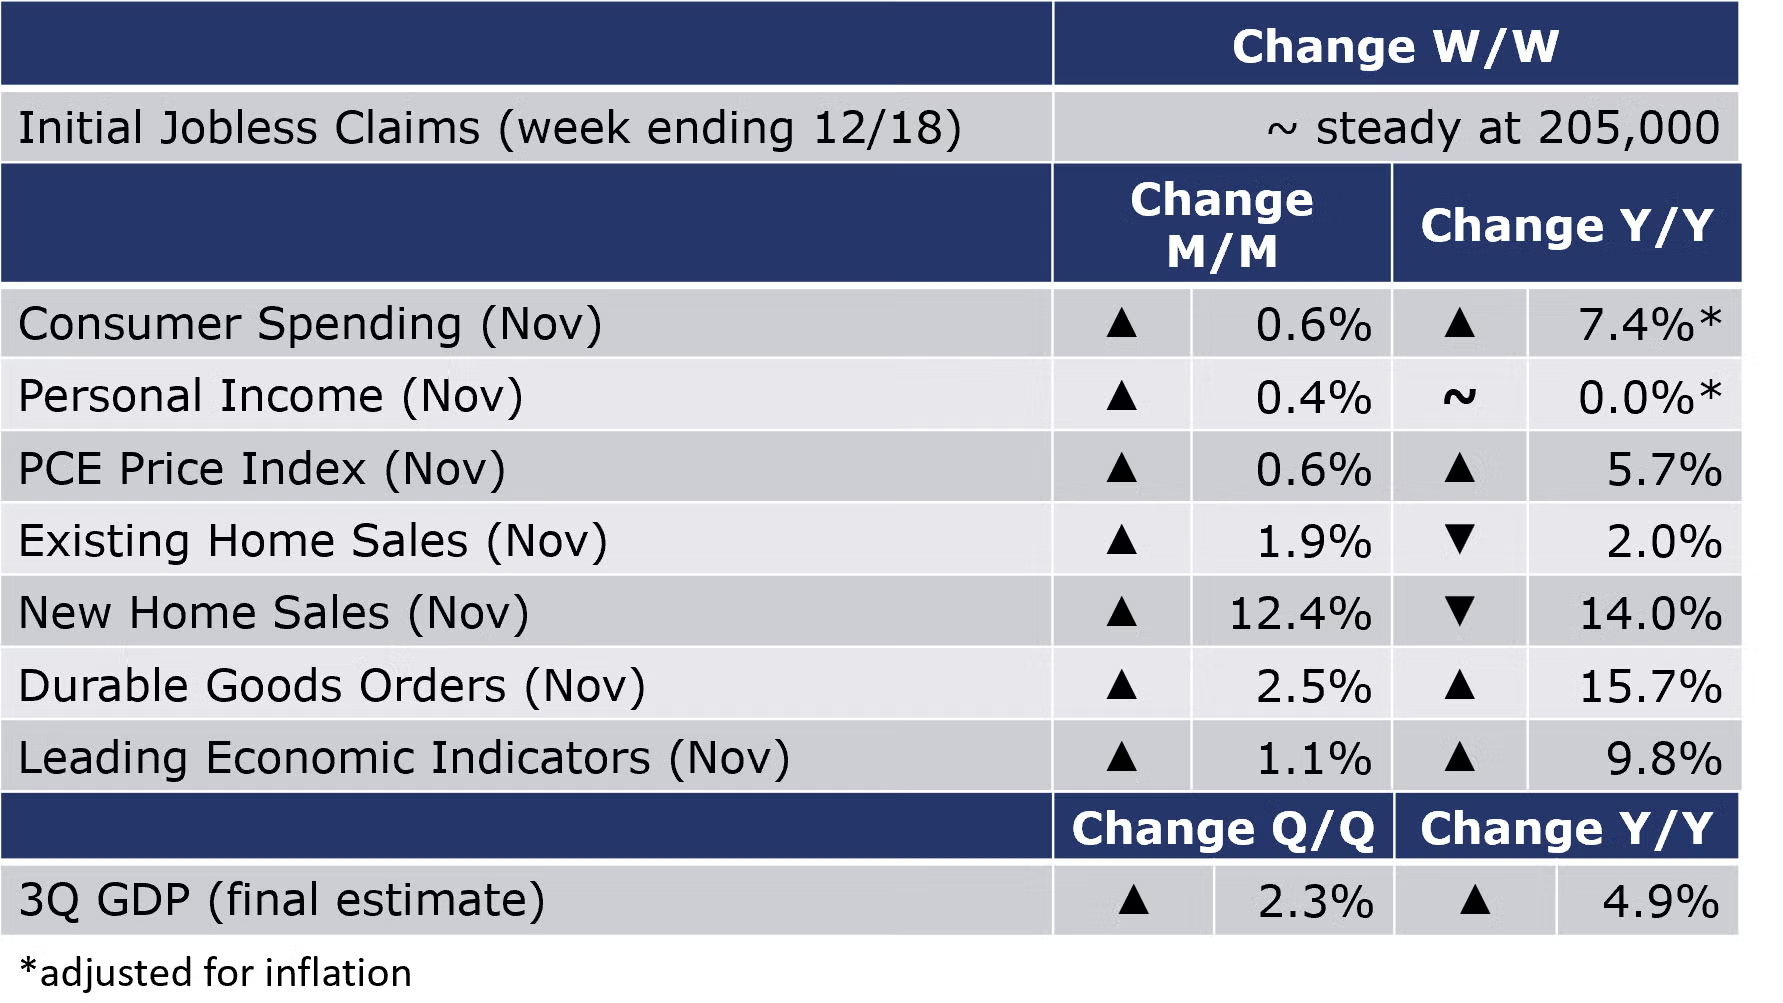
The number of new jobless claims was steady at 205,000 (the previous week’s claims were downwardly revised) during the week ending 18 December. Continuing claims decreased by 8,000 to 1.859 million, and the insured unemployment rate for the week ending 11 December was unchanged at 1.4%.
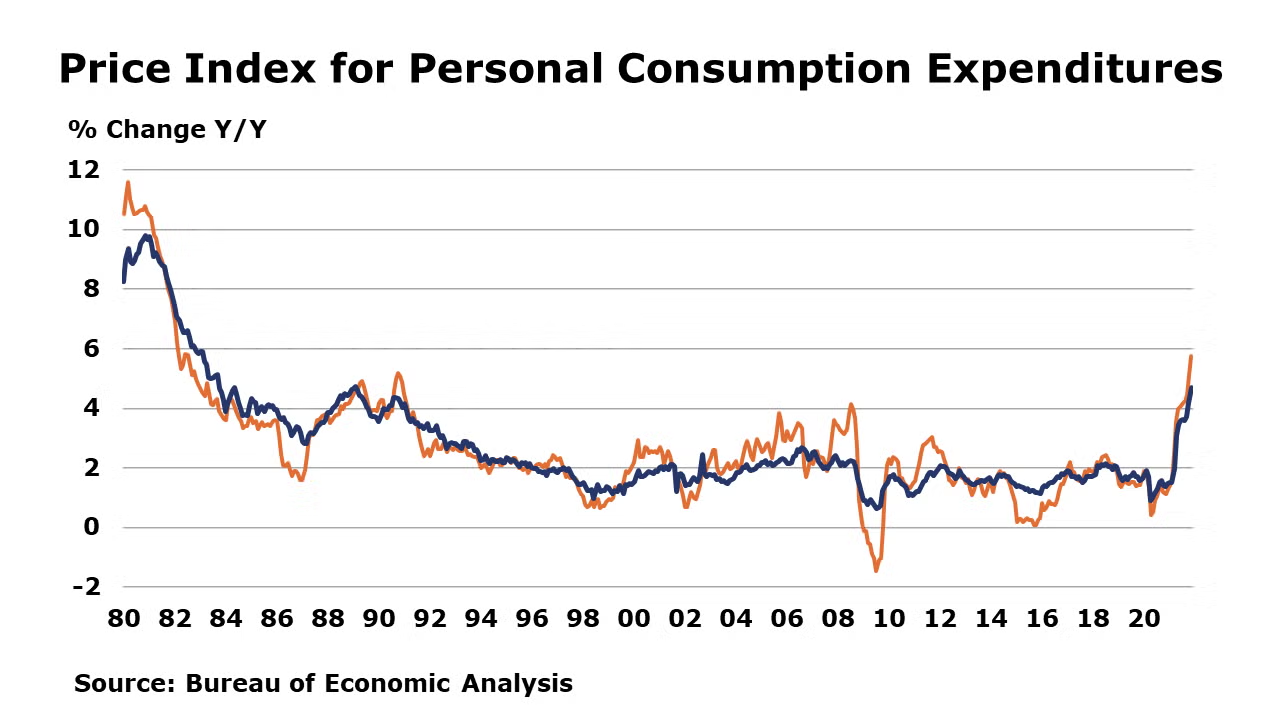
As expected, the pace of consumer spending slowed in November, up by 0.6% (compared to a 1.4% gain in October). Gains in spending on services and nondurable goods offset a decline in spending on durable goods (e.g., cars, appliances, etc.). Personal income rose by 0.4%. Compared to a year ago, inflation-adjusted consumer spending was up 7.4% while real after-tax personal income was flat. The price index for personal consumption expenditures (PCE) rose 0.6% and was up 5.7% Y/Y, higher than expected and the fastest increase since 1982. Excluding food & energy prices, the core PCE price index accelerated to a 4.7% Y/Y pace, the fastest since 1989.
Existing home sales jumped in November, up by 1.9% to a 6.46-million-unit annual pace. It was the third consecutive gain (and largest since January), but sales were off 2.0% Y/Y. Inventories at the end of the month were off 9.8% from October (down 13.3% Y/Y) to a record low and represented a very lean 2.1-month supply at the current sales pace. The median sales price for existing homes was up 13.9% Y/Y. New home sales also surged in November, up 12.4% to the highest level since April. Sales were higher across all regions except the Midwest. Compared to a year ago, new home sales were off 14.0%. Inventories of unsold homes rose 2.6% (+38.6% Y/Y) to their highest level since 2008. As sales growth outpaced inventory growth, the months’ supply fell from 7.1 months in October to 6.5 months in November. The median sales price was up 18.8% Y/Y.
Citing more complete source data, the BEA released its third and final estimate of 3Q GDP which shows that the U.S. economy grew at a 2.3% annual rate between July and September when worker shortages and supply chain disruptions curbed growth. U.S. GDP grew at a 6.3% pace in Q1 and a 6.7% pace in Q2. Compared to a year ago, GDP was up 4.9%.
Led by a rebound in aircraft orders, durable goods orders rose by 2.5% in November, ahead of expectations for a smaller gain. New orders were also higher for many other durable categories including primary metals, metal products, communications equipment, and motor vehicles. Orders were lower for machinery, computers and related products, and electrical equipment, appliances, and components. Orders for core business goods edged down by 0.1%, the first decline since February. Compared to a year ago, core orders were up 12.8% while headline durable orders were up by 15.7% Y/Y.
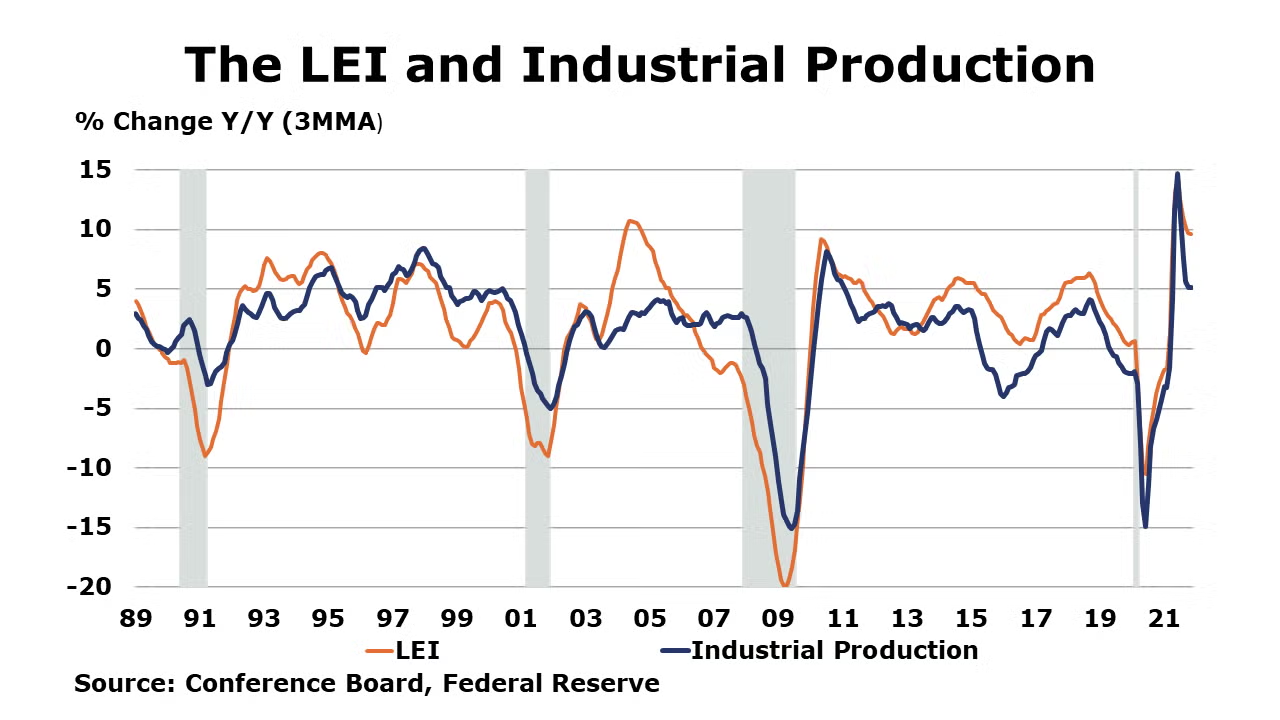
The Conference Board Leading Economic Index® (LEI) continued to rise (for a ninth consecutive month), up by 1.1% in November and following a 0.9% gain in October. Eight of the 10 components were positive. Despite the risk posed by the resurgence of Covid (Delta) and supply chain constraints, the data suggest that the expansion is set to continue into the first half of 2022.This latest reading does not reflect the emergence of the new Omicron variant, however, nor does it reflect any negative impact from the failure to pass Biden’s Build Back Better plan.
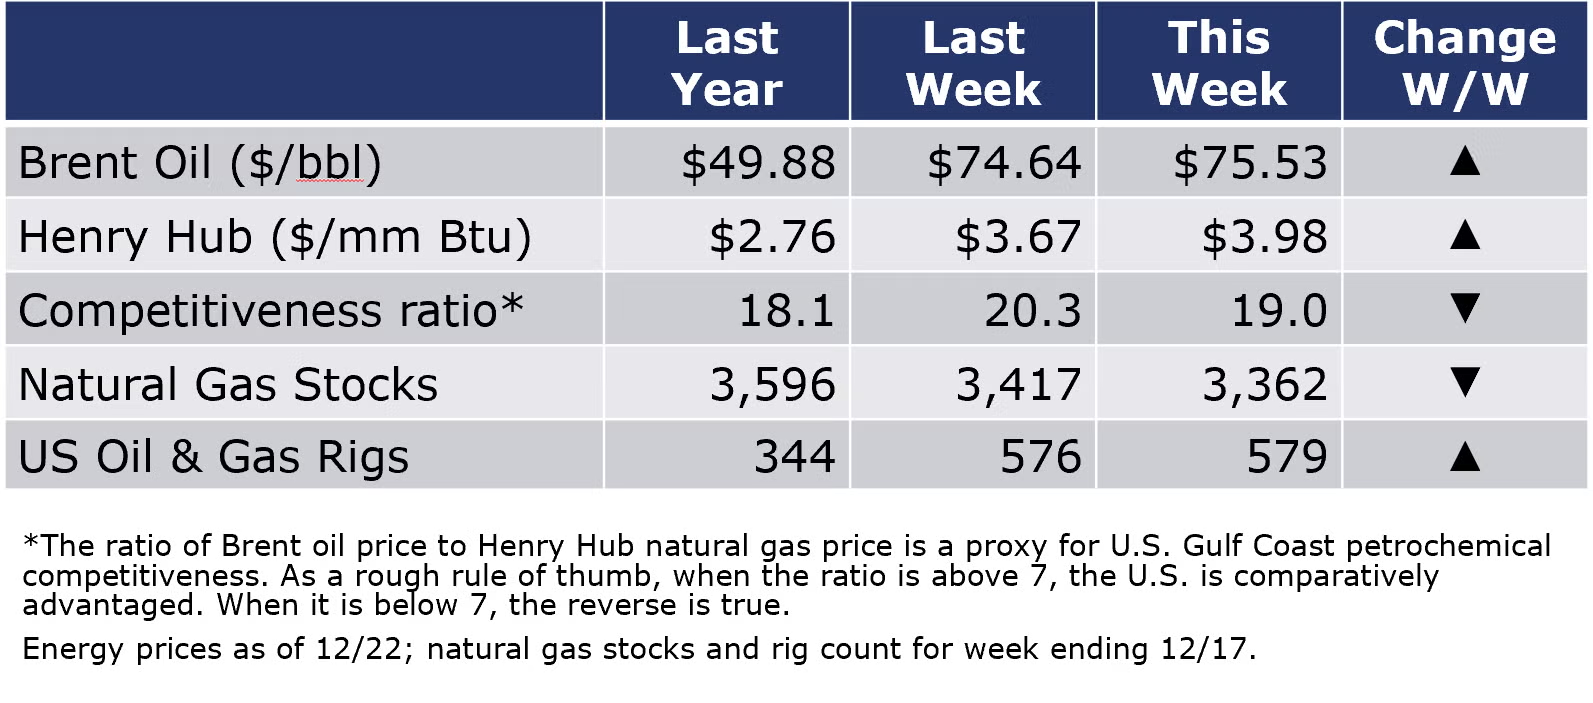
The combined oil and gas rig count rose by three to 579 during the week ending 10 December. Oil prices were volatile during the week as concern over Omicron were tempered by a larger than expected inventory draw. Natural gas prices in the U.S. moved higher (around $4/mmbtu) while European gas prices set new records this week as gas flows into Europe declined combined with nuclear outages and low wind output.
For the business of chemistry, the indicators still bring to mind a green banner for basic and specialty chemicals.
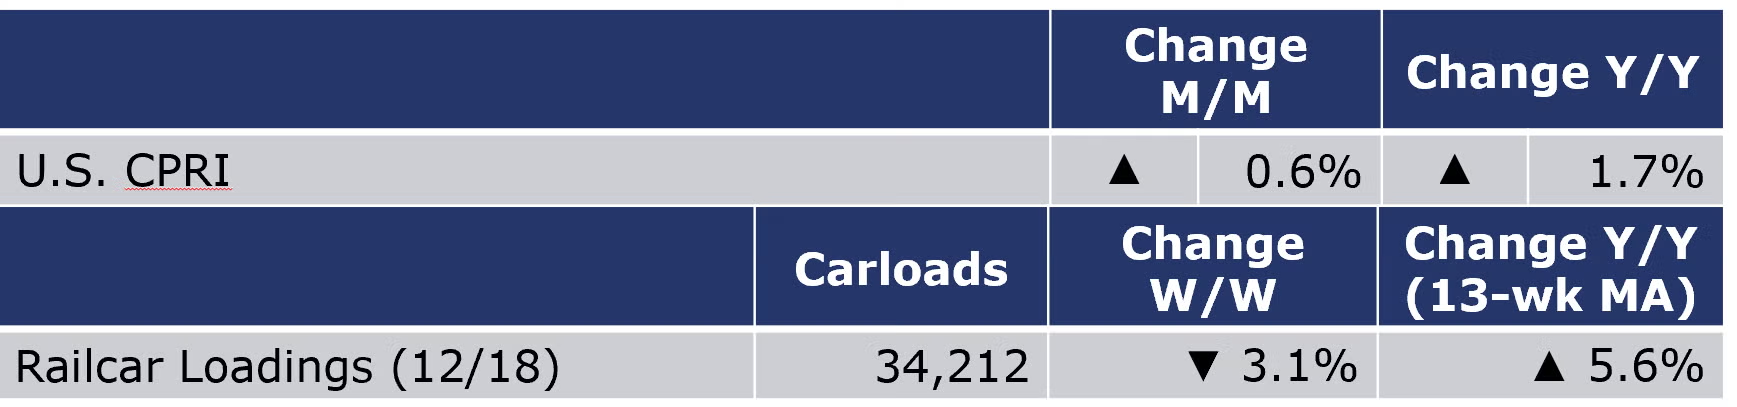
According to data released by the Association of American Railroads, chemical railcar loadings fell by 1,085 carloads to 34,212 for the week ending 18 December. Loadings were up 2.8% Y/Y, up 5.6% YTD/YTD and have been on the rise for 7 of the last 13 weeks.
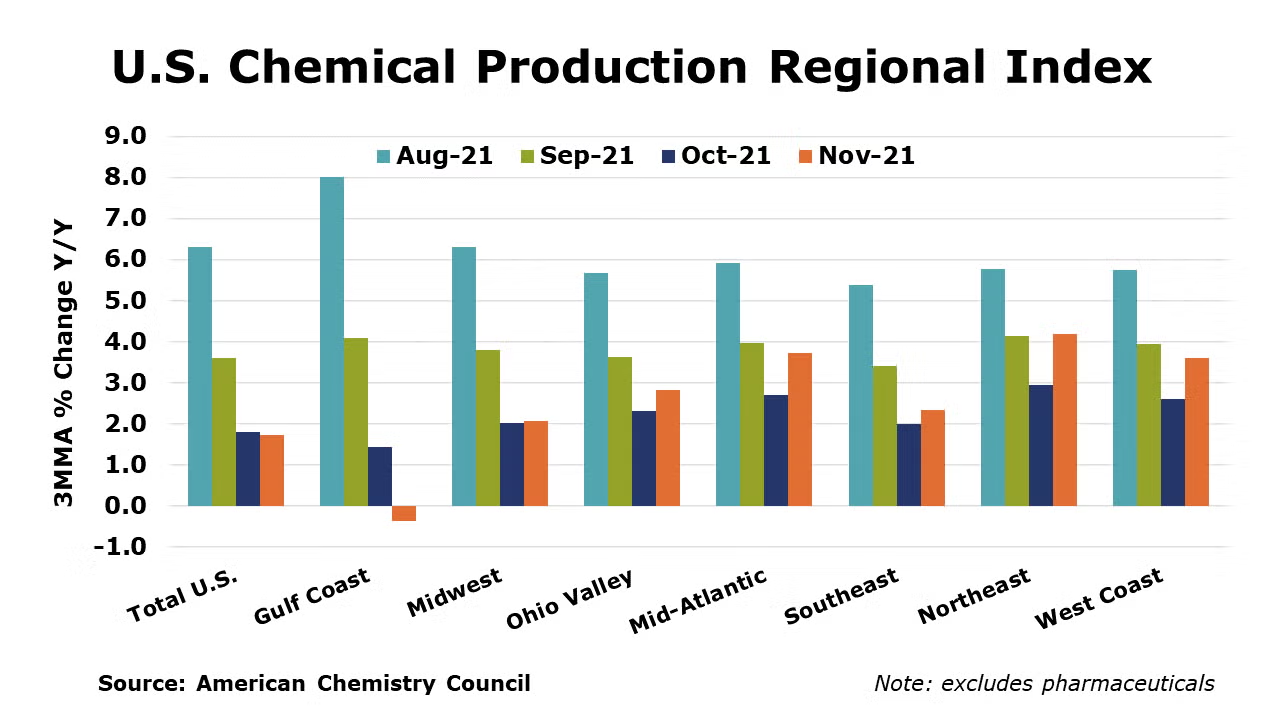
ACC’s U.S. Chemical Production Regional Index (U.S. CPRI) expanded by 0.6% in November following a 0.3% decline in October and a 1.7% decline in September. Chemical output rose in all regions, with the largest gains in the Mid-Atlantic, Northeast, and West Coast regions. The U.S. CPRI is measured as a three-month moving average (3MMA). Compared with November 2020, U.S. chemical production was ahead by 1.7% Y/Y, a slightly weaker comparison than last month, reflecting in part, lingering impacts from Hurricane Ida. Chemical production continued to be higher than a year ago in all regions, however.
Chemical production was mixed in November (3MMA), with an improving trend in the production of coatings, adhesives, consumer products, crop protection, other specialty chemicals, organic chemicals synthetic rubber and manufactured fibers. These gains were offset by weakness in plastic resins, basic inorganic chemicals, industrial gases, and synthetic dyed & pigments.
As nearly all manufactured goods are produced using chemistry in some form, manufacturing activity is an important indicator for chemical demand. Manufacturing output expanded for a fifth consecutive month in November, by 0.5% (3MMA). The 3MMA trend in manufacturing production was mixed, with gains in the output of food and beverages, motor vehicles, aerospace, construction supplies, fabricated metal products, machinery, semiconductors, refining, iron and steel products, plastic products, rubber products, tires, paper, printing, apparel, and furniture.
Note On the Color Codes
The banner colors represent observations about the current conditions in the overall economy and the business chemistry. For the overall economy we keep a running tab of 20 indicators. The banner color for the macroeconomic section is determined as follows:
Green – 13 or more positives
Yellow – between 8 and 12 positives
Red – 7 or fewer positives
For the chemical industry there are fewer indicators available. As a result we rely upon judgment whether production in the industry (defined as chemicals excluding pharmaceuticals) has increased or decreased three consecutive months.
For More Information
ACC members can access additional data, economic analyses, presentations, outlooks, and weekly economic updates through MemberExchange.
In addition to this weekly report, ACC offers numerous other economic data that cover worldwide production, trade, shipments, inventories, price indices, energy, employment, investment, R&D, EH&S, financial performance measures, macroeconomic data, plus much more. To order, visit http://store.americanchemistry.com/.
Every effort has been made in the preparation of this weekly report to provide the best available information and analysis. However, neither the American Chemistry Council, nor any of its employees, agents or other assigns makes any warranty, expressed or implied, or assumes any liability or responsibility for any use, or the results of such use, of any information or data disclosed in this material.
Contact us at ACC_EconomicsDepartment@americanchemistry.com

