Running tab of macro indicators: 13 out of 20
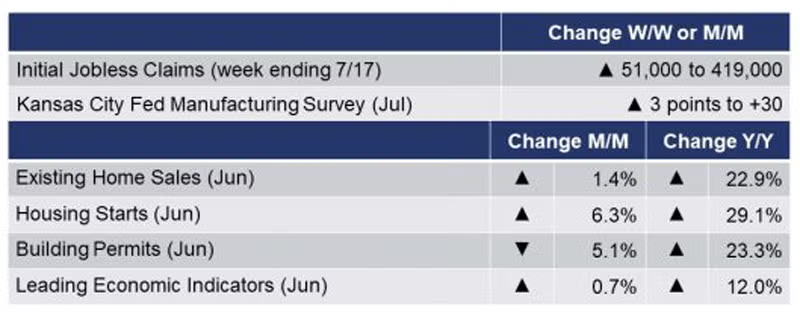
The number of new jobless claims rose by 51,000 to 419,000 during the week ending 17 July. Continuing claims fell by 29,000 to 3.236 million and the insured unemployment rate for the week ending 10 July was stable at 2.4%. A disappointing report and set-back.
Following four straight months of declines, existing home sales rose 1.4% in June. Small gains occurred in three of the four major regions of the U.S. Inventories were up 3.3% for the month and represent a 2.6-month supply at the current sales pace. Sales were up 22.9% Y/Y while inventories were off 18.8% Y/Y creating very lean inventories. The median home price was up 23.4% Y/Y.
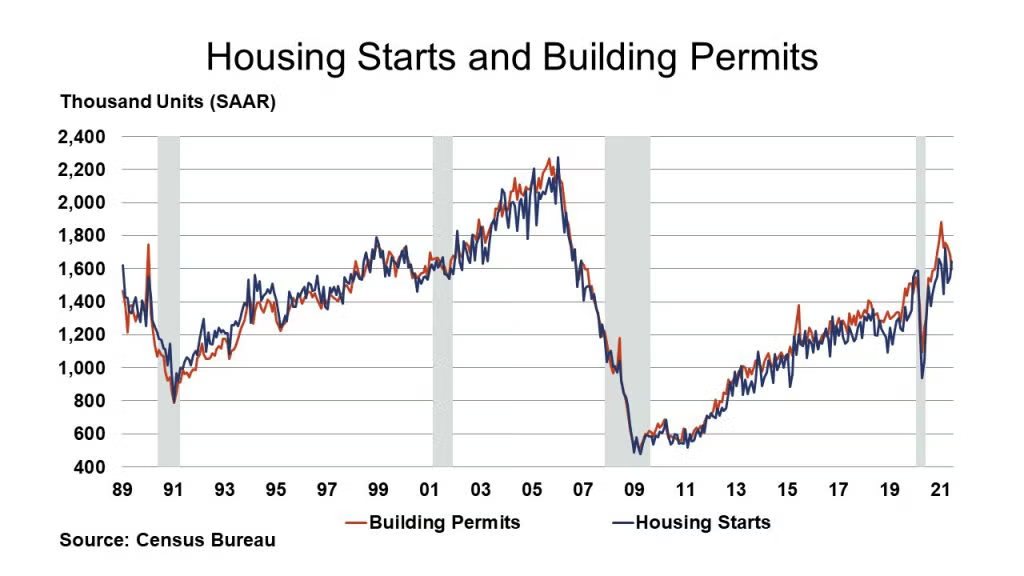
Housing starts rose 6.3% to a better than expected 1.64-million-unit pace in June. Chemistry-intensive single family starts also rose 6.3% led by gains in the South and Northeast regions. Forward-looking building permits fell, however, by 5.1% with activity weaker across all regions. Surging lumber and other building product costs in June may have dampened plans for new construction. Compared to a year ago, starts were up 29.1% Y/Y while permits were ahead 23.3% Y/Y. The National Association of Home Builders (NAHB) reported that its index of homebuilder confidence eased one point to 80, a still very high level of optimism. Strong buyer demand helped to offset supply-side challenges relating to building materials, regulation, and labor. Homebuilders in the Northeast and the West reported the most challenges. For example, prices for OSB (oriented strand board) are reported by NAHB to be up over 500% since early 2020.
The Kansas City Fed reported that Tenth District manufacturing activity increased further, with solid expectations for future activity over the next six months. The index of prices paid for raw materials remained near record highs and the index of prices received for finished goods expanded again in July. Price indexes vs. a year ago posted record highs in July for the fourth straight month. In July, more district firms expected materials prices and finished goods prices to rise over the next six months.
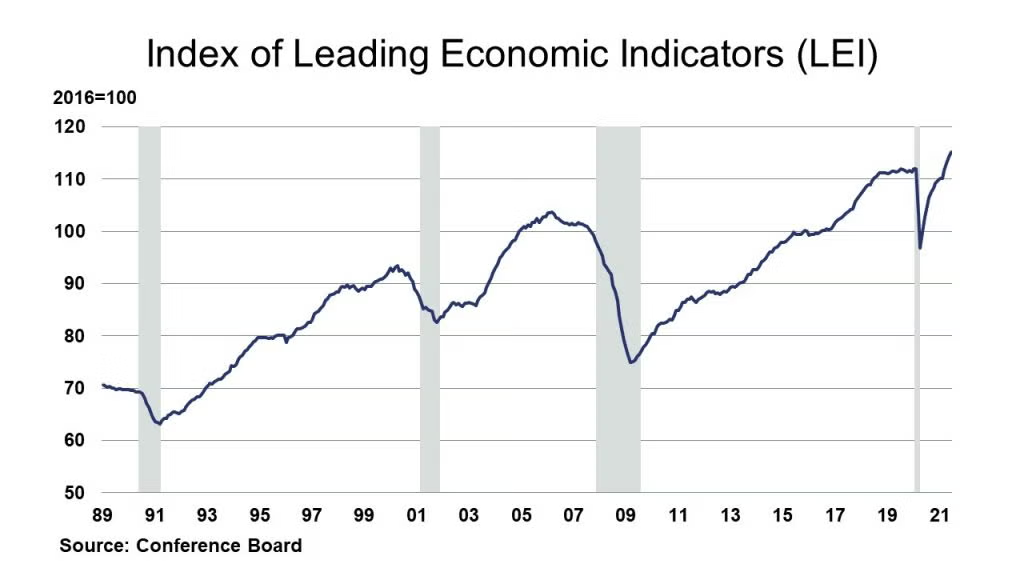
The index of leading economic indicators (LEI) rose 0.7% in June, a slower pace than April and May. Eight of the ten indicators that make up LEI increased in June. The LEI suggests that strong economic growth will continue in the near term. Next week we release our CAB leading indicator and that will provide insight from the July data.
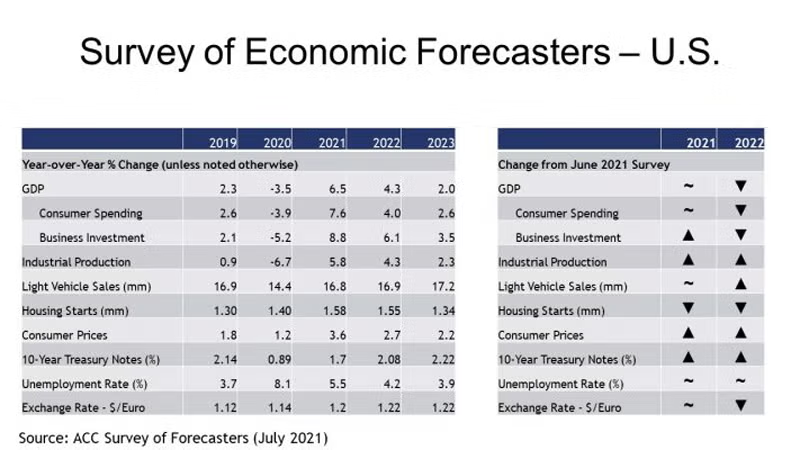
- Despite a rise in cases from the Delta variant, economic momentum going into Q3 remained strong. Demand is growing across many segments and consumer spending is pivoting toward services as the economy further opens. Supply chain disruptions persist in many sectors of the economy, however, and prices are rising as surging demand faces inadequate supply in many segments. Among ACC’s panel of forecasters, expectations remain very positive for 2021. Moving into 2022, forecasters expect the rebound to continue, though at a slower pace.
- Compared to last month’s survey, growth expectations for business investment have continued to improve for 2021 as the recovery accelerates into Q3. U.S. GDP is expected to grow 6.5% in 2021, the fastest pace in more than three decades with a 7.6% gain in consumer spending and an 8.8% gain in business investment. Growth shifts lower in 2022 with a 4.0% gain in GDP, lower than last month’s survey.
- Industrial production, which continued to rebound in May, is expected to rise 5.8% in 2021 (up from last month’s forecast) and 4.3% in 2022.
- Expectations for housing starts edged slightly lower to 1.58 million in 2021 and 1.55 million in 2022.
- Reflecting several supply chain disruptions, expectations for light vehicle sales remained steady at 16.8 million in 2021 and improved to 16.9 million in 2022.
- The unemployment rate is expected to average 5.5% in 2021 and 4.2% in 2022, the same as last month.
- With surging demand from reopening and ongoing supply chain disruptions, expectations for consumer price inflation continued to rise. Consumer prices are expected to grow by 3.6% in 2021 and 2.7% 2022.
- Compared to last month, expectations for interest rates (10-year treasury) were slightly higher for 2021 and 2022.
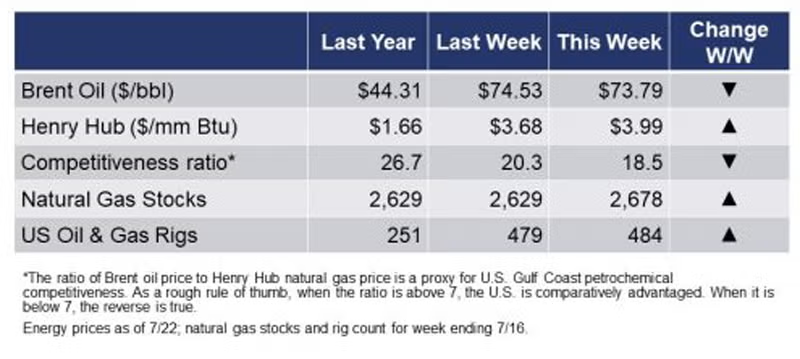
The rig count remained rose by five at 484 rigs during the week ending 16 July. The build in natural gas inventories continues to lag. Oil prices plunged earlier in the week on broad concerns about how the acceleration in the Delta variant will affect the pace of the global recovery in oil demand, but recovered later in the week.
For the business of chemistry, the indicators still bring to mind a green banner for basic and specialty chemicals.
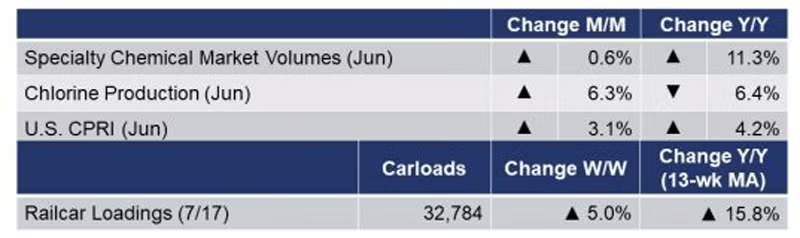
According to data released by the Association of American Railroads, chemical railcar loadings, the best ‘real time’ indicator of chemical industry activity, rose by 5.0% to 32,784 railcars the week ending 17 July (week 28). Loadings were up 9.3% Y/Y and up 5.9% YTD/YTD. The 13-week moving average, which is used to smooth out volatility, was up 15.8%.
The Chlorine Institute (CI) reported that production of chlorine was 30,629 in June, up 6.3% over the previous month; YTD production was down 6.4% Y/Y. The output of co-produced caustic soda rose to 32,936, up 7.1% over May and YTD production was down 6.2% Y/Y.
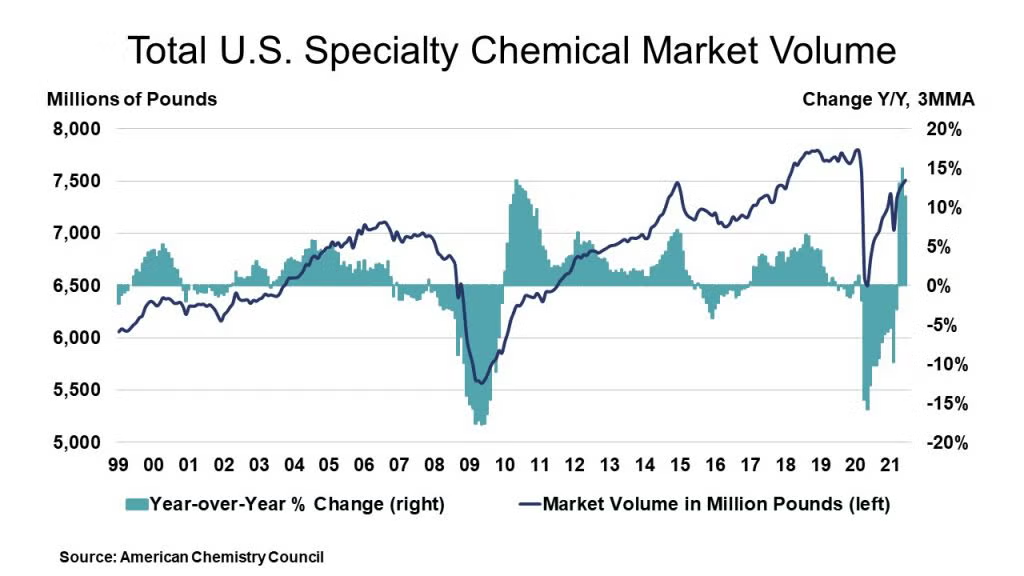
U.S. specialty chemicals market volumes rose 0.6% in June, the same gain as in May, leaving volumes off 3.7% from pre-coronavirus levels. Of the 28 specialty chemical segments we monitor, 15 expanded in June, off from 19 in May. Twelve segments fell back in June, and one was neutral. Thus, on a sequential (one-month change) basis, diffusion was 55%, down from 70% in May. During June, seven segments — cosmetic additives, foundry chemicals, oilfield chemicals, plastics additives, plasticizers, plastic compounding, and printing ink — featured gains of 1.0% or more.
During June, overall specialty chemicals volumes were up 11.3% Y/Y from the depressed levels of last year when lockdowns were widespread. Total volumes stood at 102.3% of their average 2017 levels in June. This is equivalent to 7.51 billion pounds (3.41 million metric tons). On a year-over-year comparison basis, there were gains in 27 chemical segments and diffusion was 96% in June, up slightly from 93% in May.
Since last year, the recovery has largely been V-shaped. At the mid-point of the year, volumes were up 2.7% YTD. Should the economic recovery continue, 2021 will be a good year for specialties.
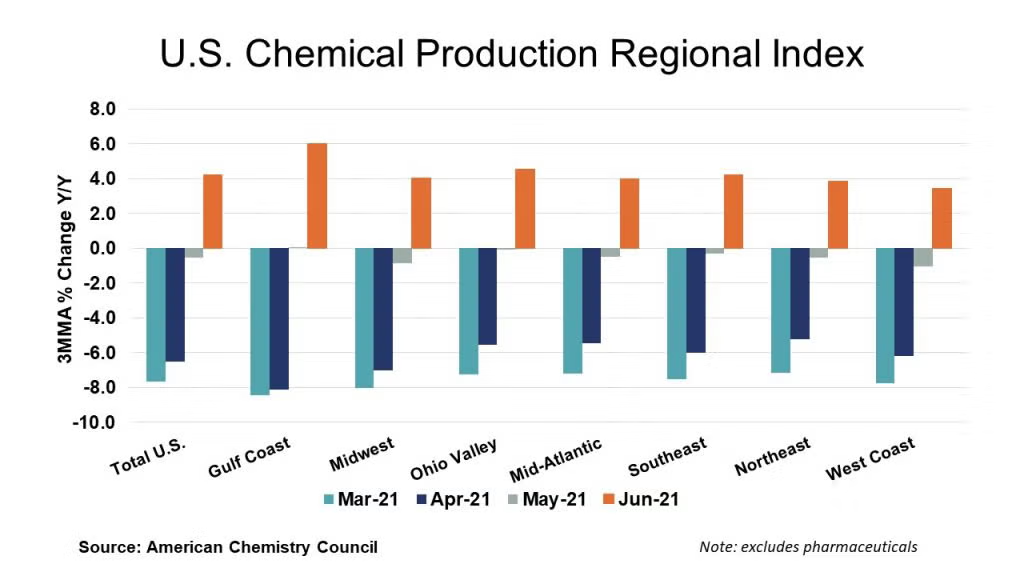
The U.S. Chemical Production Regional Index (U.S. CPRI), which is measured as a three-month moving average (3MMA), rose by 3.1% in June following a 4.6% decline in May and a 1.2% decline in April. During June, chemical output rose in all regions reflecting both solid demand for chemistry products and capacity restoration after the winter storms along the Gulf Coast. Compared with June 2020, U.S. chemical production rose 4.2%. Chemical production was higher than a year ago in all regions.
On a 3MMA basis, chemical production was mixed in June with an improving trend in the production of organic chemicals, plastic resins, fertilizers, adhesives, coatings, chlor-alkali, crop protection chemicals, other specialty chemicals, and miscellaneous inorganic chemicals. These gains were offset, however, by continued weakness in synthetic rubber, synthetic dyes & pigments, manufactured fibers, and consumer products.
As nearly all manufactured goods are produced using chemistry in some form, manufacturing activity is an important indicator for chemical demand. Following a 1.2% gain in May, manufacturing output continued to expand in June, by 0.2% (on a 3MMA basis). The 3MMA trend in manufacturing production was mixed with gains in the output of machinery, computers & electronics, semiconductors, oil & gas extraction, refining, iron & steel products, foundries, rubber products, tires, printing, textile products, apparel, and furniture.
Note On the Color Codes
The banner colors represent observations about the current conditions in the overall economy and the business chemistry. For the overall economy we keep a running tab of 20 indicators. The banner color for the macroeconomic section is determined as follows:
Green – 13 or more positives
Yellow – between 8 and 12 positives
Red – 7 or fewer positives
For the chemical industry there are fewer indicators available. As a result we rely upon judgment whether production in the industry (defined as chemicals excluding pharmaceuticals) has increased or decreased three consecutive months.
For More Information
ACC members can access additional data, economic analyses, presentations, outlooks, and weekly economic updates through MemberExchange.
In addition to this weekly report, ACC offers numerous other economic data that cover worldwide production, trade, shipments, inventories, price indices, energy, employment, investment, R&D, EH&S, financial performance measures, macroeconomic data, plus much more. To order, visit http://store.americanchemistry.com/.
Every effort has been made in the preparation of this weekly report to provide the best available information and analysis. However, neither the American Chemistry Council, nor any of its employees, agents or other assigns makes any warranty, expressed or implied, or assumes any liability or responsibility for any use, or the results of such use, of any information or data disclosed in this material.
Contact us at ACC_EconomicsDepartment@americanchemistry.com
Upcoming Events of Interest
“Challenges and Opportunities in the Catalyst Business” Virtual Webinar
Raphael Crawford | President, Catalysts | Albemarle Corporation
28 July (1:00 – 2:00 pm)
Société de Chimie Industrielle
www.societe.org
“Specialty & Agro Chemicals America”
8-10 September 2021
Belmond Place | Charleston, SC
Chemicals America, Inc.
https://charleston.chemicalsamerica.com/
“Americas Chemicals and Polymers Conference” Virtual Event
14-15 September 2021
Wood Mackenzie
www.woodmac.com/events/americas-chemicals-and-polymers-conference
Hydrocarbon Processing IRPC Operations Virtual Event
Hydrocarbon Processing/Gulf Energy Information
21-22 September 2021
https://web.cvent.com/event/ec87ac54-5d81-48f7-a4db-c7f82f1c4e73/summary

