Running tab of macro indicators: 16 out of 20
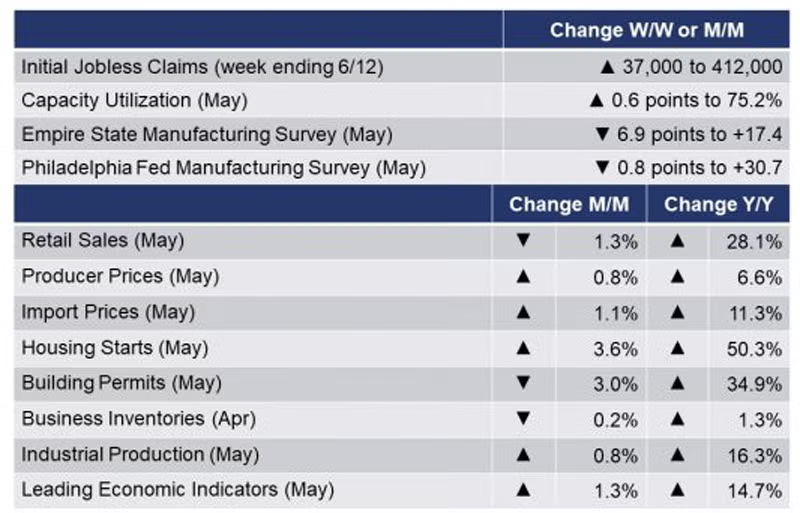
The number of new jobless claims rose by 37,000 to 412,000 during the week ending 12 June. Continuing claims rose by 1,000 to 3.518 million and the unemployment rate for the week ending 5 June was unchanged at 2.5%.
Producer prices rose 0.8% in May, a faster pace than expected and follows a 0.6% gain in April and a 1.0% gain in March. Excluding food and energy, so-called core producer prices rose 1.1%, driven largely by higher prices for non-ferrous metals, motor vehicles, transportation, warehousing, and some services. Compared to a year ago, producer prices were up 6.6%, accelerating from 6.2% Y/Y in April. Core producer prices edged higher to 4.8% Y/Y from 4.1% in April.
U.S. import prices continued to trend up in May, rising 1.1% following increases of 0.8% in April, 1.5% in March, and 1.2% in February. Prices for U.S. imports have not recorded a decline since the index edged down 0.1% in October. The price index for U.S. imports advanced 11.3% for the year ended in May, the largest 12-month rise since a 12.7% increase from September 2010 to September 2011. Import prices for petroleum and natural gas have increased significantly over the past 12 months.
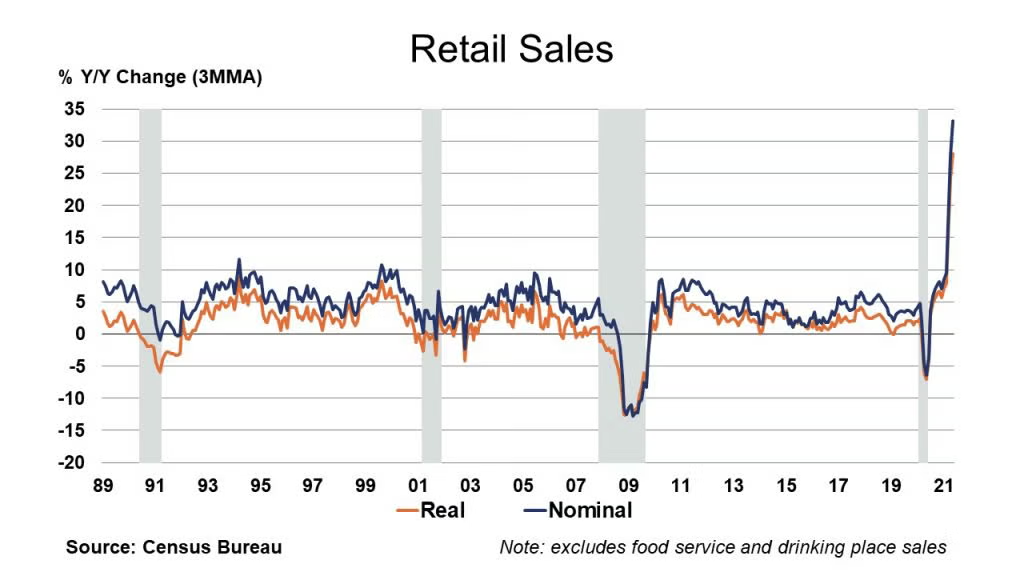
Despite further relaxing of COVID-19 restrictions in most places, retail sales fell more than expected in May, down 1.3%. Part of the decline was explained by a 3.7% drop in sales of motor vehicles and parts, reflecting ongoing supply chain shortages; however, core retail sales fell by 0.8%, below expectations for a small gain. Following more than a year of lower consumer demand for services, the composition of spending may be shifting back toward services and away from goods. Compared to a year ago, headline sales were up 28.1%.
Centered in retail, business inventories were drawn down by 0.2% to $2,024.0 billion at the end of April, a level up 1.3% Y/Y. At the same time, the combined value of distributive trade sales and manufacturers’ sales rose 0.6% to $1,621.1 billion, a level up 40.0% Y/Y. April gains were across the board. This pushed the inventory-to-sales ratio down from 1.26 to 1.25. A year ago, it was 1.73.
Housing starts rose 3.6% to a 1.57-million-unit pace in May, a little softer than expectations. The gain was largely centered in single-family starts, with gain in most regions except the Northeast. The more forward-looking data on building permits disappointed, falling 3.0% to a 1.68-million-unit pace. That permits exceed starts is good, but homebuilders are facing labor constraints and higher costs. Housing starts were up 50.3% Y/Y and building permits were up 34.9% Y/Y. The NAHB Housing Market Index (HMI) eased two points to 81 as homebuilders worry that rising home prices will push some buyers to the sidelines.
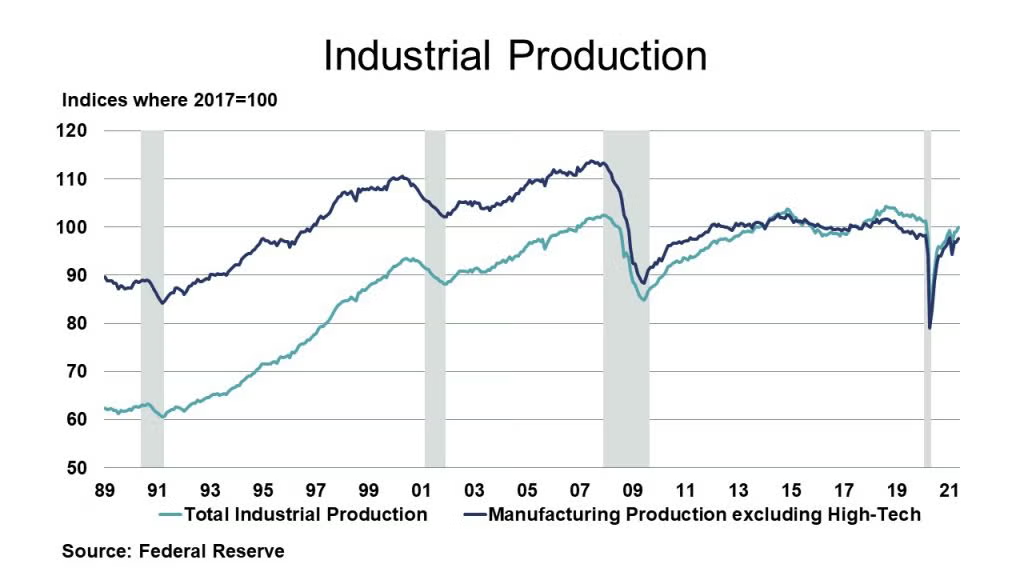
Despite ongoing supply chain challenges, industrial production rose 0.8% in May, after edging higher by 0.1% in April. The largest gains were in motor vehicles, apparel & leather, printing, computers & electronics, and chemicals. Compared to a year ago, production was up 16.3%. Capacity utilization tightened by 0.6 points to 75.2%. A year ago, capacity utilization was 64.7%. Compared to May 2020, there was no growth in industrial capacity.
The New York Fed reported that New York manufacturing activity continued to expand, though at a slower pace than last month. The headline general business conditions index fell 6.9 points to 17.4. New orders and shipments increased moderately, and there was a rise in unfilled orders. Delivery times lengthened at a record-setting pace, and inventories edged lower. Employment levels and the average workweek continued to grow modestly, and both input prices and selling prices continued to rise sharply. Looking ahead, firms remained optimistic that conditions would improve over the next six months, with the index for future employment reaching a record high. The Philadelphia Fed reported that regional manufacturing activity continued to expand with the general index easing 0.8 points to 30.7, a still solid number. The survey’s indicators for new orders and shipments remained elevated, although movements were mixed. Additionally, the employment index increased, while the price indexes climbed above last month’s long-term highs. Firms were even more optimistic for the next six months.
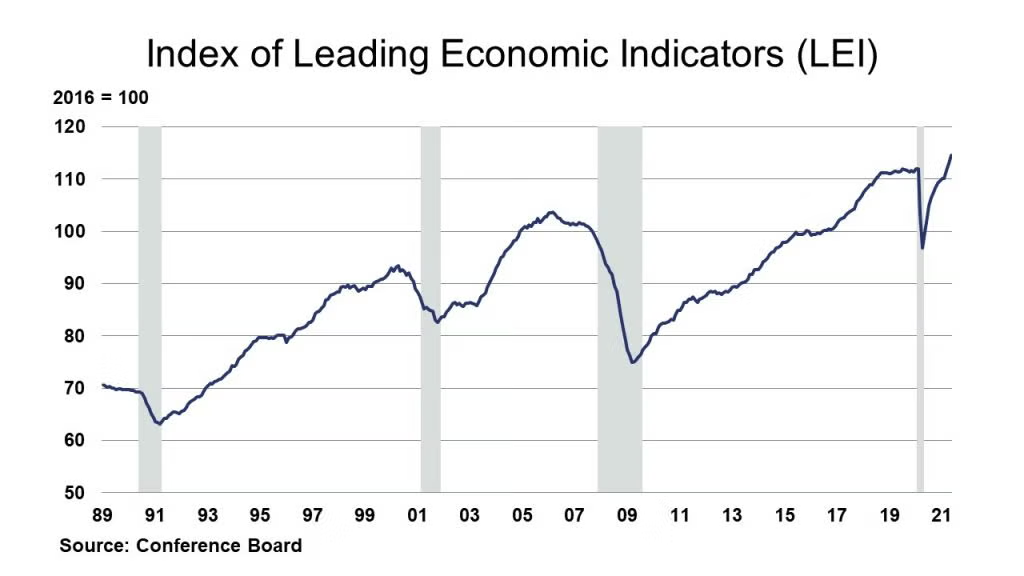
The Conference Board index of leading economic indicators (LEI) rose 1.3% to 114.5 (2016 = 100) in May, following a 1.3% gain in April and a 1.4% increase in March. Strengths among the leading indicators were widespread, with jobless claims making the largest positive contribution and building permits this month’s only negative contribution. The LEI now stands above its pre-pandemic peak and suggests strong economic growth will continue in the near term. The Conference Board now forecasts real GDP rising 6.6% during 2021.
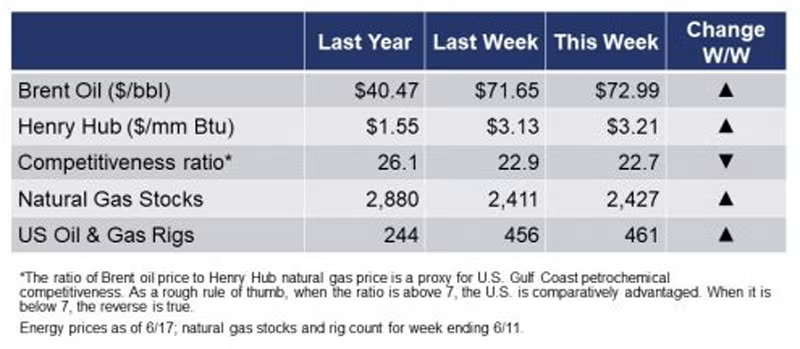
The rig count rose by five to 461 rigs during the week ending 11 June. Amid signs of an improving global economy and rising oil demand, oil prices gained this week to levels not seen in three years.
For the business of chemistry, the indicators still bring to mind a green banner for basic and specialty chemicals.
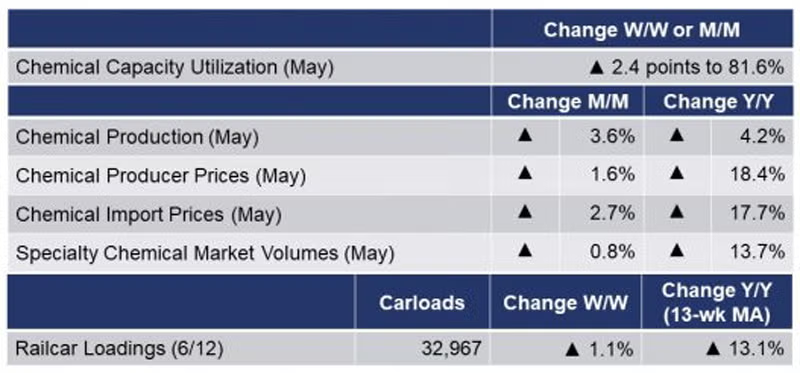
According to data released by the Association of American Railroads, chemical railcar loadings, the best ‘real time’ indicator of chemical industry activity, rose by 1.1% to 32,967 railcars the week ending 12 June (week 23). Loadings were up 20.0% Y/Y, a continuing trend reflective of last year’s COVID-related closures. Loadings were up 4.9% YTD/YTD and the 13-week moving average, which is used to smooth out volatility, was up 13.1%.
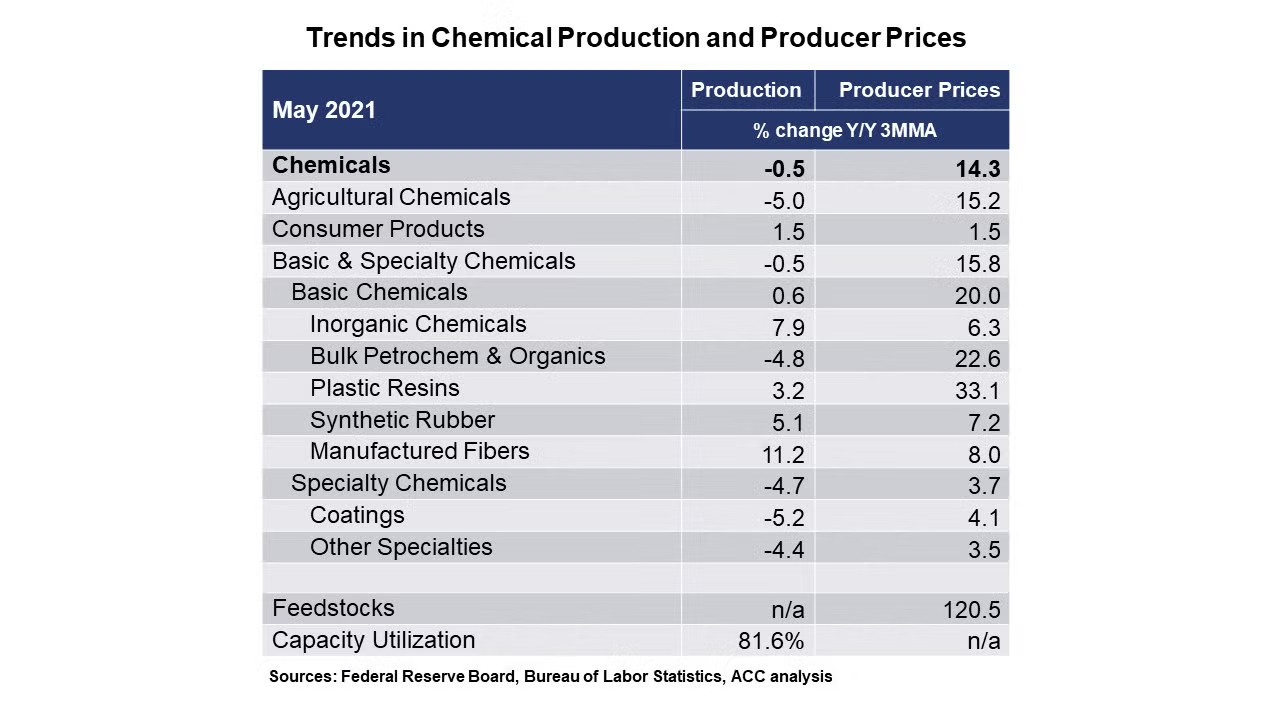
Chemical producer prices rose by 1.6% in May following a 2.7% gain in April. On a month-over-month basis, prices were higher across all segments with the largest gains in agricultural chemicals, bulk petrochemicals & organics, synthetic rubber, and coatings. Compared to a year ago, chemical prices were up 18.4%. Chemical export prices have been building since the beginning of the year and rose 4.0% in May. Chemical export prices were up 31.4% Y/Y. Chemical import prices were up by 2.7% in May and up 17.7% Y/Y.
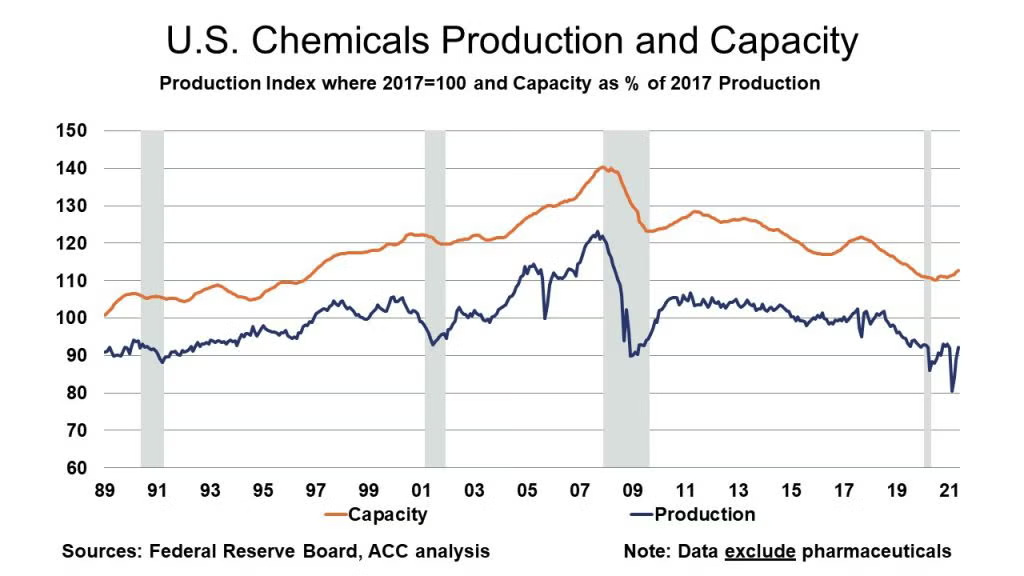
As further progress was made in recovering from the winter storm, chemical production rose by 3.6% in May following a 5.6% gain in April and a 4.7% gain in March. Production was higher across many segments with gains in bulk petrochemicals & organics, coatings, other specialties, and agricultural chemicals. Weakness was seen in inorganic chemicals, plastic resins, synthetic rubber, manufactured fibers, and consumer products. Compared to a year ago, chemical output was up 4.2%. Note that the Federal Reserve Board incorporated a benchmark revision to the data. Based on the rise in output, capacity utilization rose 2.4 points to 81.6%. A year ago, it was 80.0%.
U.S. specialty chemicals market volumes rose 0.8% in May, and volumes are now above the pre-winter storm levels of January. Activity, however, is still off from pre-pandemic levels. Of the 28 specialty chemical segments we monitor, 20 expanded in May, up from 16 in April, and much better than only three in February. Eight segments fell back in May, and one was neutral. Thus, on a sequential (one-month change) basis, diffusion was 73%, up from 57% in April and only 11% in February. During May, 10 segments featured gains of 1.0% or more.
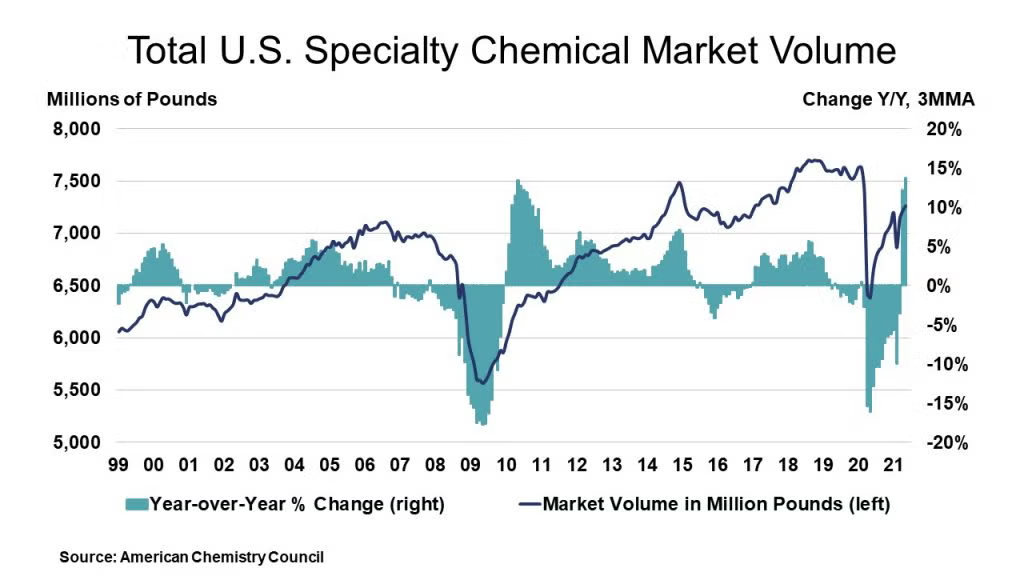
During May, overall specialty chemicals volumes were up 13.7% Y/Y from the depressed levels of last year when lockdowns were widespread. Readers should note that there are base level effects at play, hence the high Y/Y comparisons. Rubber processing chemicals were adversely affected by last year’s shutdowns in tire manufacturing. Volumes stood at 99.0% of their average 2017 levels in May. This is equivalent to 7.26 billion pounds (3.29 million metric tons). On a year-earlier basis, there were gains in 26 chemical segments and diffusion was 93% in May, off slightly from 96% in April. Note: There were revisions to some segments this month. In addition, we changed the base year to where 2017 = 100 so users can compare segments to industrial production and other end-use market indicators. Finally, we made our annual adjustments for seasonality.
Note On the Color Codes
The banner colors represent observations about the current conditions in the overall economy and the business chemistry. For the overall economy we keep a running tab of 20 indicators. The banner color for the macroeconomic section is determined as follows:
Green – 13 or more positives
Yellow – between 8 and 12 positives
Red – 7 or fewer positives
For the chemical industry there are fewer indicators available. As a result we rely upon judgment whether production in the industry (defined as chemicals excluding pharmaceuticals) has increased or decreased three consecutive months.
For More Information
ACC members can access additional data, economic analyses, presentations, outlooks, and weekly economic updates through MemberExchange.
In addition to this weekly report, ACC offers numerous other economic data that cover worldwide production, trade, shipments, inventories, price indices, energy, employment, investment, R&D, EH&S, financial performance measures, macroeconomic data, plus much more. To order, visit http://store.americanchemistry.com/.
Every effort has been made in the preparation of this weekly report to provide the best available information and analysis. However, neither the American Chemistry Council, nor any of its employees, agents or other assigns makes any warranty, expressed or implied, or assumes any liability or responsibility for any use, or the results of such use, of any information or data disclosed in this material.
Contact us at ACC_EconomicsDepartment@americanchemistry.com
Upcoming Events of Interest
“Specialty & Agro Chemicals America”
8-10 September 2021
Belmond Place | Charleston, SC
Chemicals America, Inc.
https://charleston.chemicalsamerica.com/
“Americas Chemicals and Polymers Conference” Virtual Event
14-15 September 2021
Wood Mackenzie
https://www.woodmac.com/events/americas-chemicals-and-polymers-conference