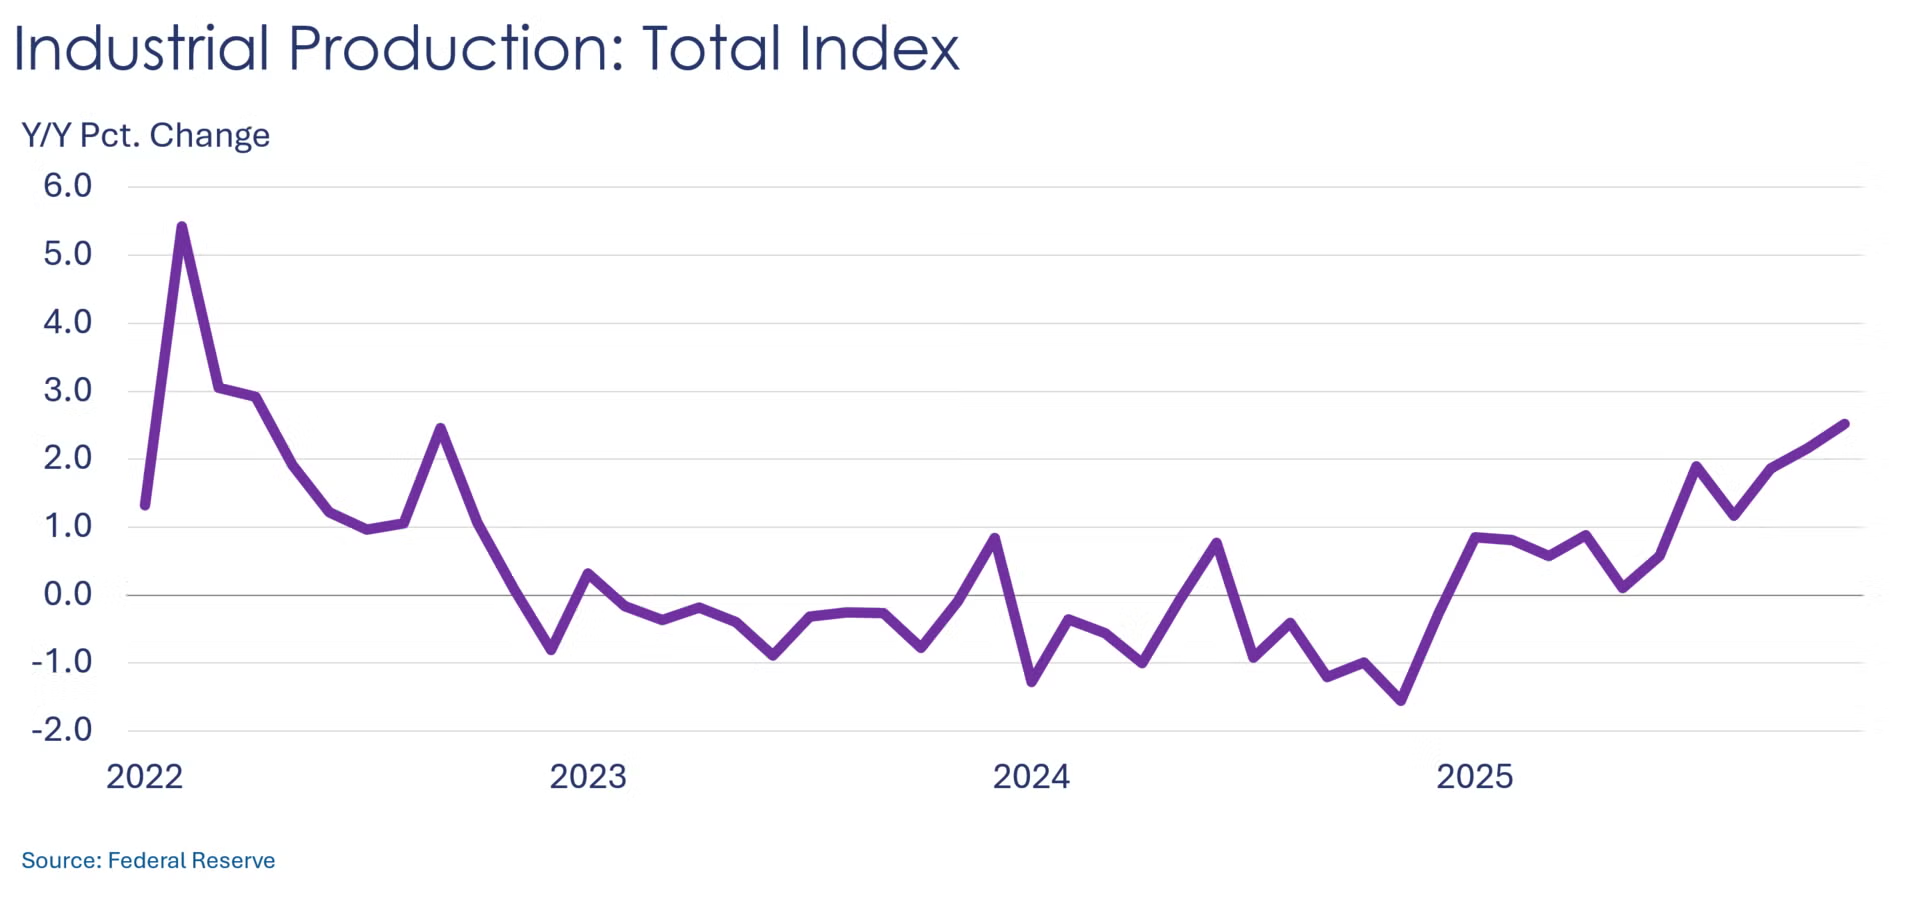
Industrial production rose 0.2% in November after sliding 0.1% the previous month. Manufacturing output was flat after dropping 0.4% in October. Within durable goods manufacturing, output of furniture, motor vehicles & parts, and wood products witnessed the biggest declines, while production of aerospace and electrical equipment, appliances, and computers increased. At the same time, output of non-durables such as apparel & leather, food & beverages, and petroleum & coal products rose while printing, chemicals, paper, and plastics & rubber production declined. Assemblies of autos and light trucks dropped to a 9.46 million seasonally adjusted annual rate (SAAR), the lowest level since January 2025. Compared to a year ago, total industrial production rose 2.5%, the largest Y/Y increase since April 2022. Capacity utilization increased slightly from 75.9% in October to 76.0%.
Overall manufacturing conditions weakened further in Texas in December, according to business executives surveyed in the Dallas Fed’s Texas Manufacturing Outlook Survey. The general business activity index fell to -10.9, down from -10.4 in November. Production, shipments, and new orders declined, as did unfilled orders and finished goods inventories. Despite these contractions, expectations for business conditions six months ahead remained in positive territory.
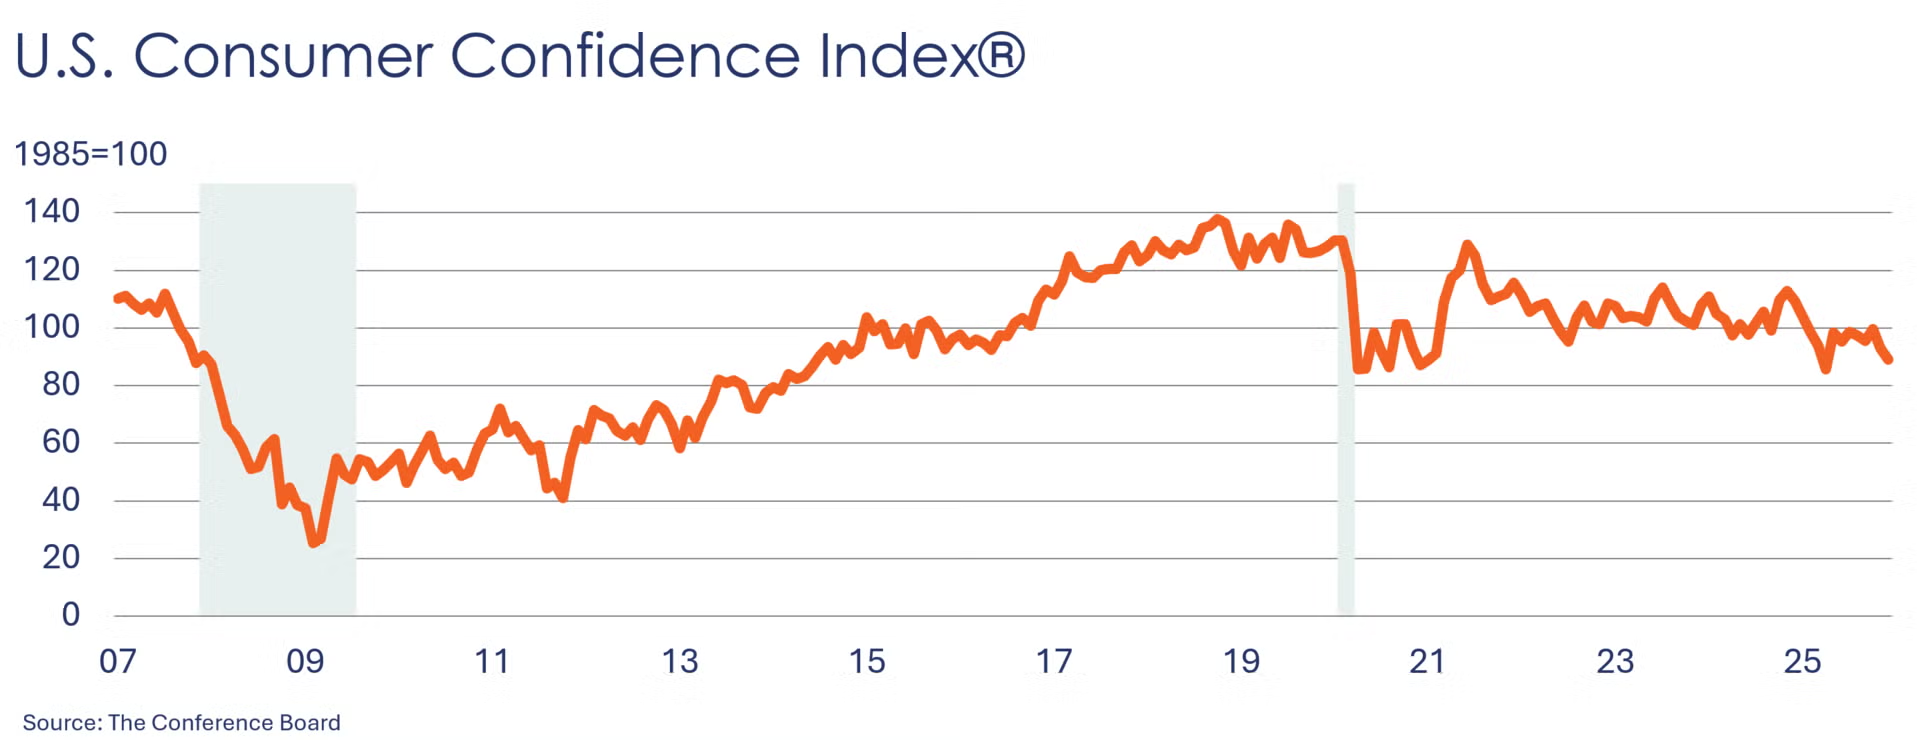
Consumer confidence fell in December, with the index losing 3.8 points to 89.1. The expectations index was unchanged at 70.7, the eleventh consecutive reading below 80, a threshold signaling an upcoming recession. Two of the three components of the expectation index declined in December, namely business conditions and the labor market, while household income expectations were positive but less so than the prior month. Respondents were less pessimistic than in November, still concerned about inflation, tariffs, and politics, but encouraged by declining interest rates. Purchasing plans for big-ticket items reflected more caution, as plans to buy new cars, household appliances, and computers declined. Homebuying plans also dipped. On the other hand, plans to buy smart phones, TVs, and used cars strengthened.
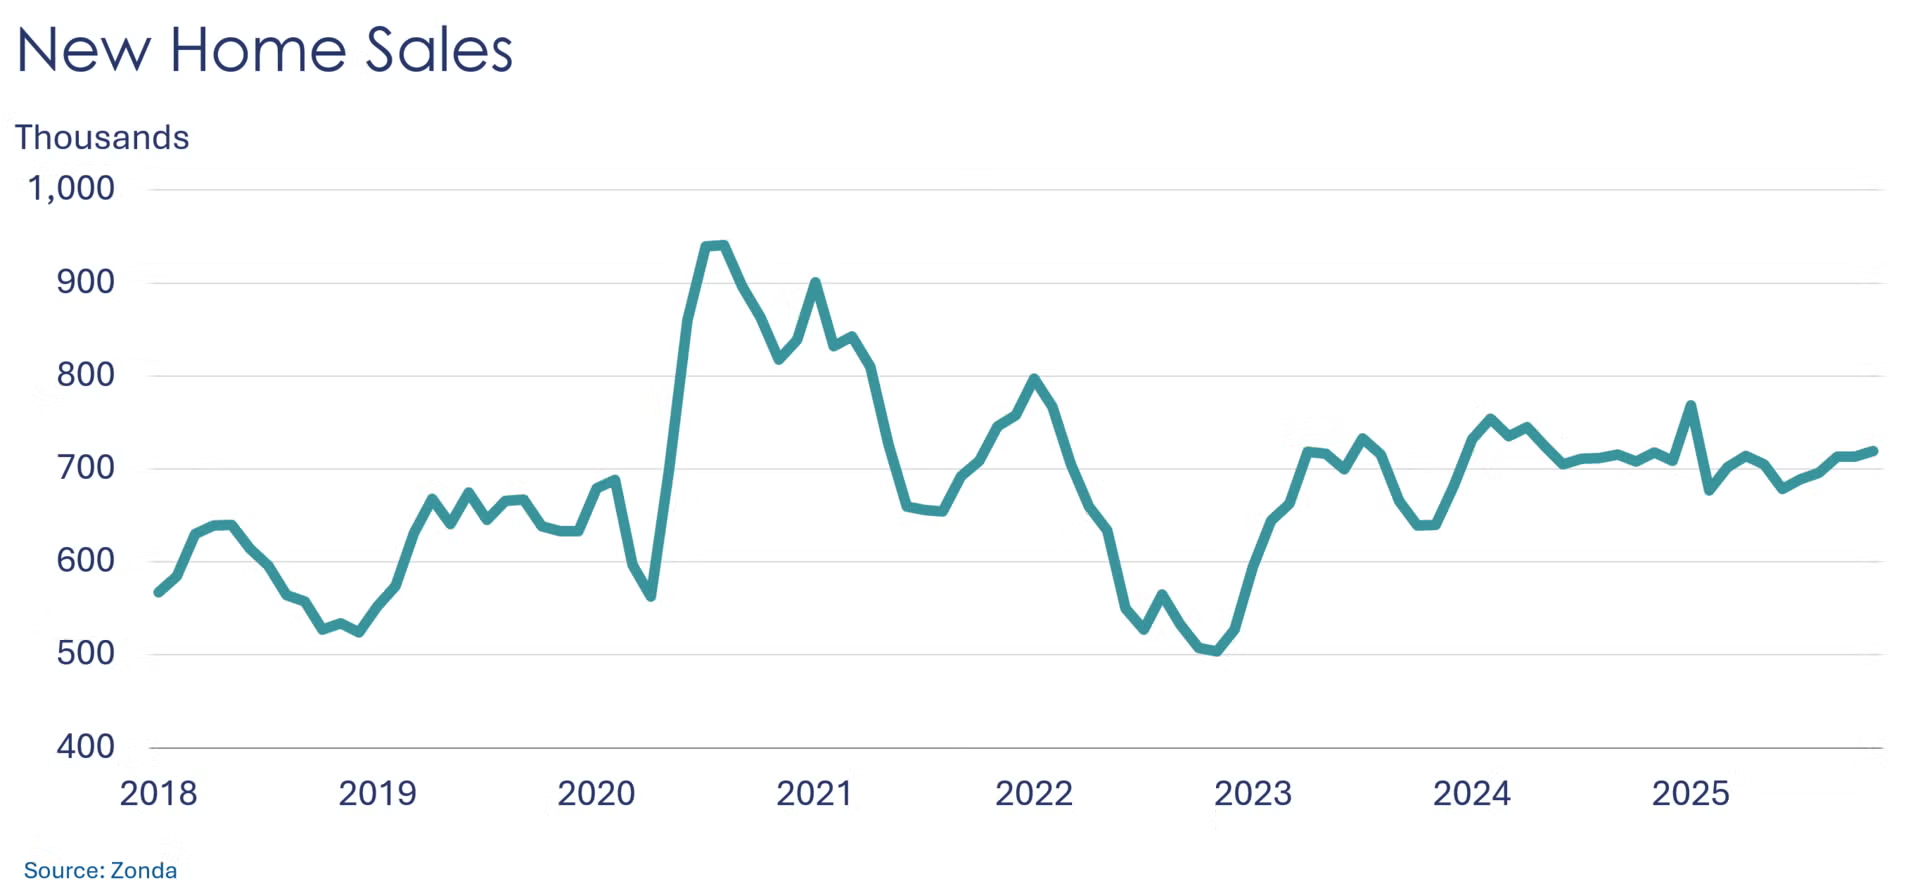
New home sales rose 0.9% in November after being flat the previous month, according to Zonda, a real estate data firm (Zonda’s new single-family home sales metric counts the number of new home contract sales each month and accounts for both cancellations and seasonality.) Excluding October, sales increased each month since July. Compared to last year, sales inched up 0.2% Y/Y, on top of a 0.7% Y/Y rise in October. Compared to a year earlier, sales dropped each month between February and September of 2025.
Headline durable goods orders dropped 2.2% in October, following two straight months of increases. The decline was led by plunging orders for nondefense and defense aircraft and parts, which respectively sank 20.1% and 32.4%. Orders for primary metals and electrical equipment also fell, while orders for computers, machinery, and fabricated metals rose. Core business orders (nondefense capital goods, excluding aircraft) gained 0.5% after adding 1.1% in September. Compared to a year ago, core orders grew 6.2% Y/Y while headline orders were up 4.8% Y/Y.

U.S. GDP for the third quarter rose at a 4.3% seasonally adjusted annual rate (SAAR) according to BEA’s initial estimate, up from a 3.8% rise in the second quarter. Third-quarter GDP was propelled by consumer spending, net exports, and government spending, leading to the largest quarterly advance in GDP since the third quarter of 2023. Real final sales to private domestic purchasers (i.e., consumer spending plus gross private fixed investment) jumped 3.0%. Compared to last year, GDP was up 2.3% Y/Y.
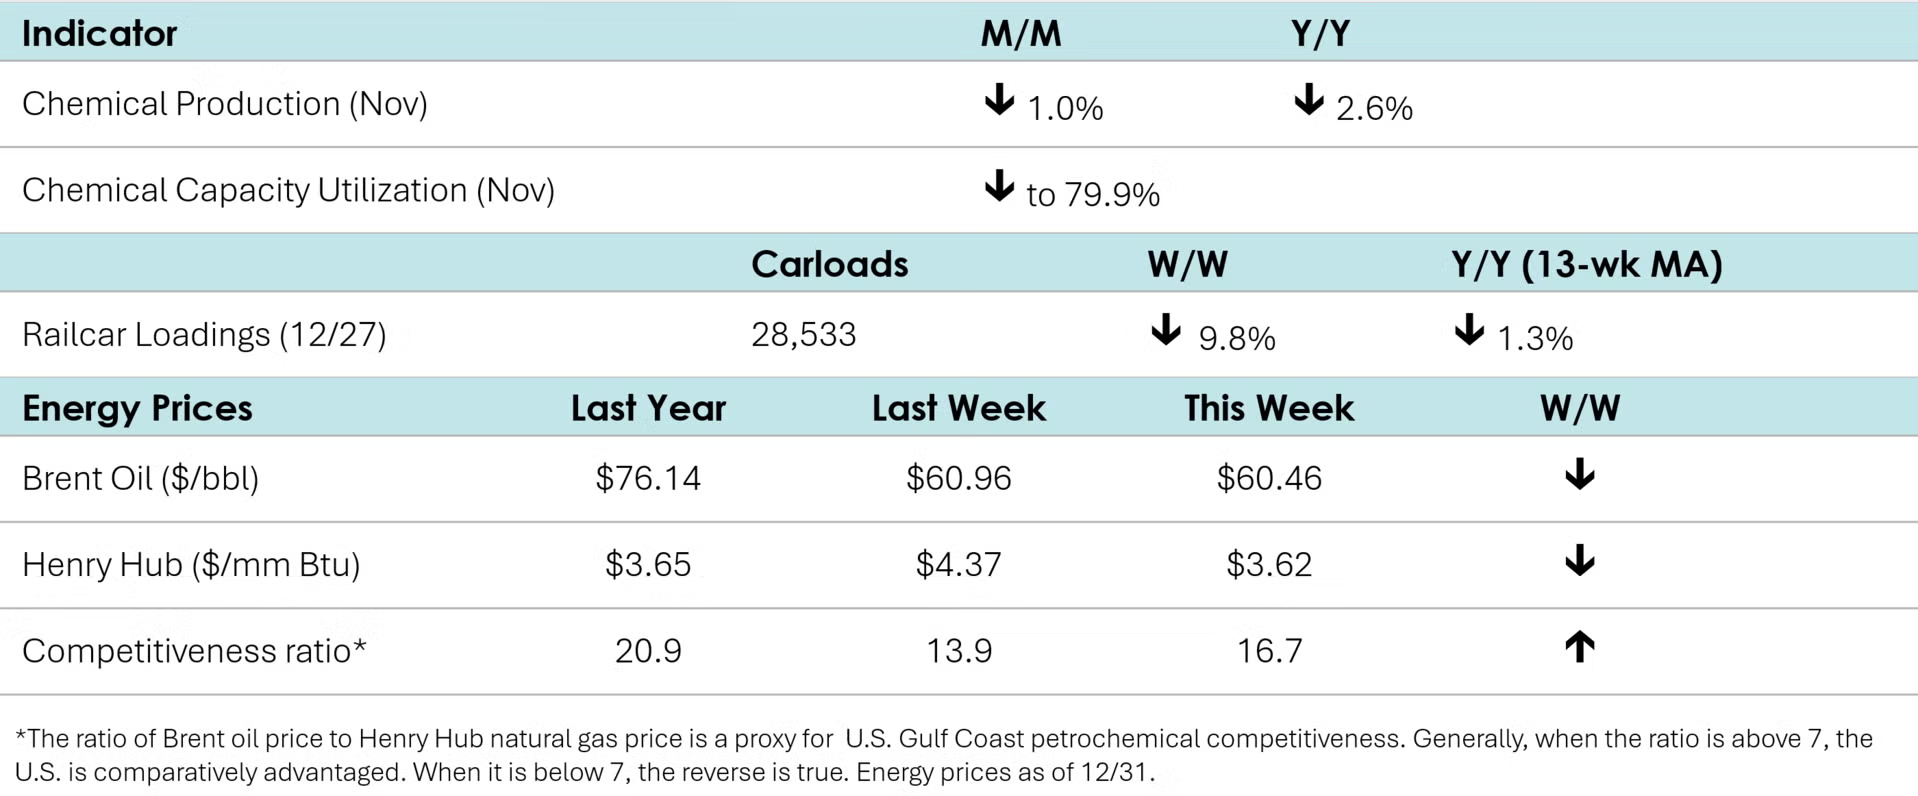
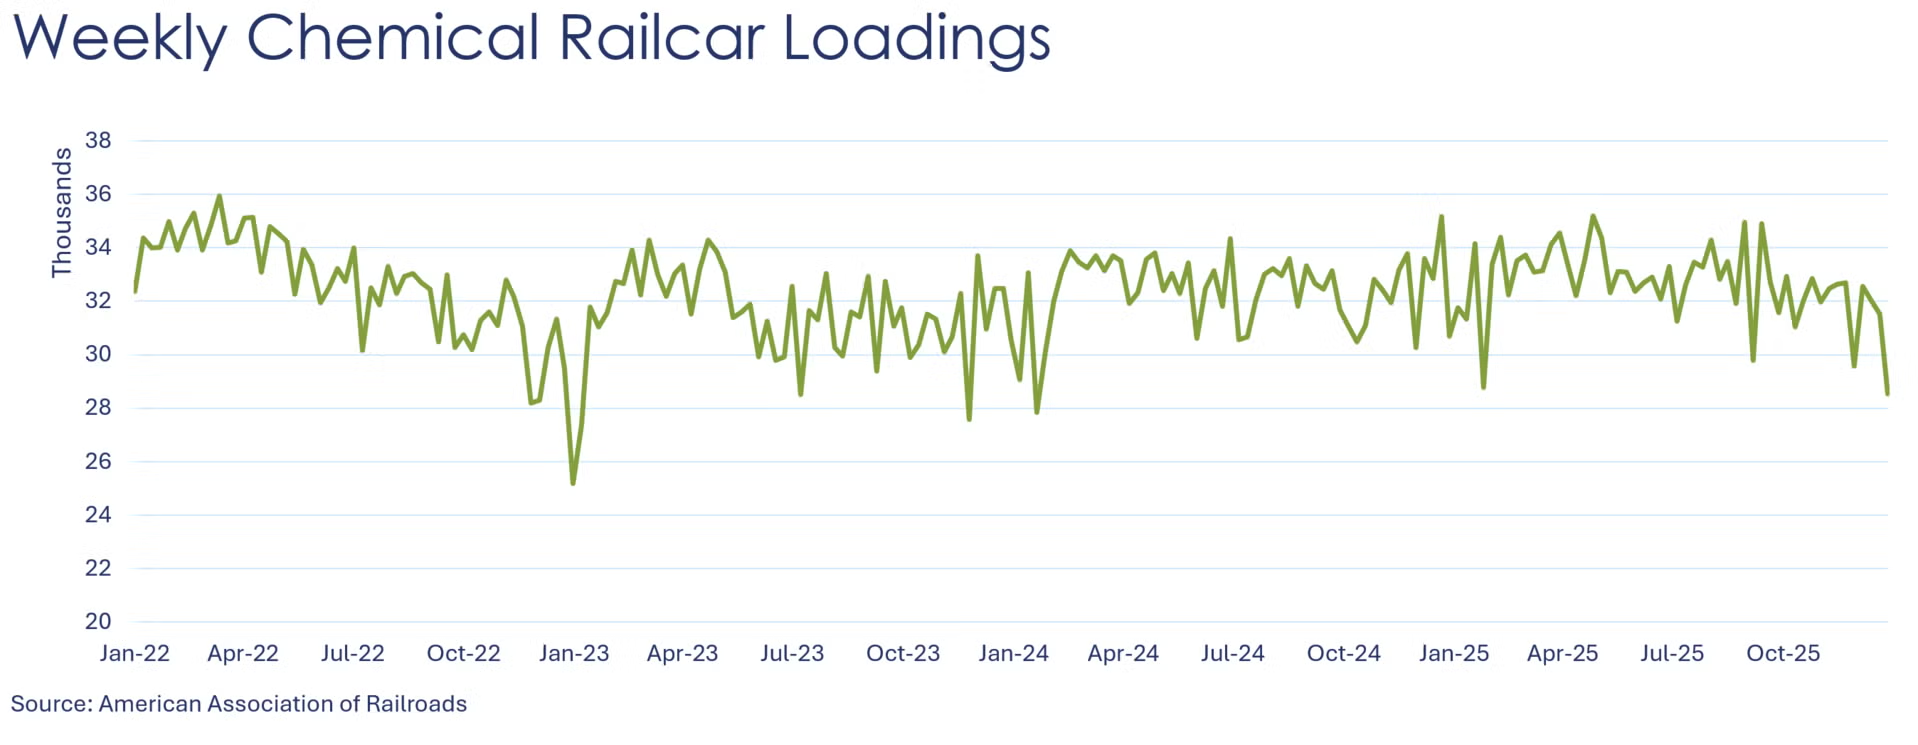
According to data released by the Association of American Railroads, chemical railcar loadings were down to 28,533 for the week ending December 27th, which included the Christmas holiday. Loadings were down 1.3% Y/Y (13-week MA), up 0.8% YTD/YTD and have been on the rise for seven of the last 13 weeks.

Chemical production fell 1.0% in November, following a 1.7% dip in October. Gains in the output of inorganic chemicals and plastic resins offset declines in organic chemicals, synthetic rubber, manufactured fibers, coatings, other specialty chemicals, agricultural chemicals and consumer products. Compared to last November, chemical production was off 2.6%. Chemical industry capacity utilization fell to 79.9%.
Energy Wrap-Up
• Oil prices were essentially steady as oversupply concerns were offset by disruptions in Venezuelan supply and Russia-Ukraine tensions.
• U.S. natural gas prices were lower than a week ago on a lower-than-expected inventory withdrawal and expectations for milder weather in the near-term.
• The combined oil & gas rig count was 537 on December 30th. At the end of 2024, the rig count was 585.
For More Information
ACC members can access additional data, economic analyses, presentations, outlooks, and weekly economic updates through ACCexchange: https://accexchange.sharepoint.com/Economics/SitePages/Home.aspx
In addition to this weekly report, ACC offers numerous other economic data that cover worldwide production, trade, shipments, inventories, price indices, energy, employment, investment, R&D, EH&S, financial performance measures, macroeconomic data, plus much more. To order, visit http://store.americanchemistry.com/.
Every effort has been made in the preparation of this weekly report to provide the best available information and analysis. However, neither the American Chemistry Council, nor any of its employees, agents or other assigns makes any warranty, expressed or implied, or assumes any liability or responsibility for any use, or the results of such use, of any information or data disclosed in this material.
Contact us at ACC_EconomicsDepartment@americanchemistry.com.