Running tab of macro indicators: 17 out of 20
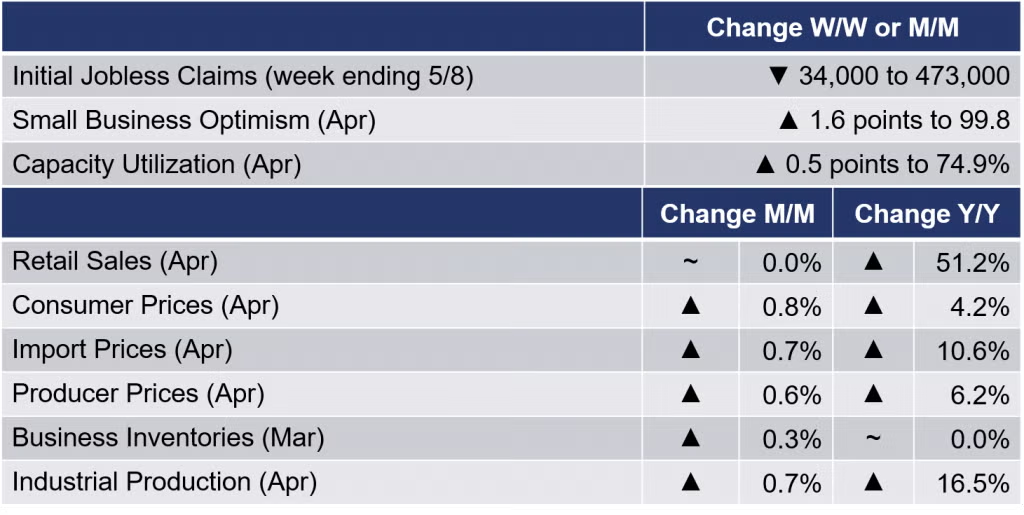
The number of new jobless claims fell by 34,000 to 473,000 during the week ending 8 May, the lowest level since before the national emergency declared for the COVID-19 pandemic. Continuing claims rose by 345,000 to 3.655 million and the unemployment rate for the week ending 1 May eased 0.1 points to 2.6%.
Retail sales were disappointingly flat in April, following a stimulus-driven jump in March. Excluding vehicles and gas stations, core retail sales were off 0.8%. Restaurant sales continued to rise and were more than double year-ago levels. Gains in motor vehicles, electronics & appliances, and health & personal care sales were offset by declines in other categories. With the comparison to April 2020, the height of the pandemic lockdowns, retail sales were ahead by 51.2% Y/Y.
Business inventories rose 0.3% to $2,014.3 billion in March, a level essentially unchanged from a year earlier. Manufacturer and wholesaler inventories gained while that for retailers eased. The combined value of distributive trade sales and manufacturers’ shipments for March jumped 5.7% to $1,638.2 billion, a level up 18.5% Y/Y. Gains were broad-based. This pushed the inventory-to-sales ratio down from 1.30 to 1.23. Supply-chain constraints abound!
Driven by stimulus checks and reopening momentum due to higher vaccination rates, consumer prices surged in April, up 0.8% compared to March and up 4.2% Y/Y. In April, prices in most categories were higher, with the largest increase in used cars & truck prices since 1953, which accounted for one-third of the overall gain. Excluding food and energy, core consumer prices were up 2.0% in April (up 4.4% Y/Y). Producer prices ran hot again, rising 0.6% in April, and following a 1.0% gain in March and 0.5% gain in February. About two-thirds of the April advance in the final demand index can be traced to a 0.6% increase in prices for services, the sectors most affected by the pandemic and that are now re-opening. Companies in these sectors are facing hiring challenges and have been boosting wages and prices. Looking at goods, prices for steel mill products, beef, veal, pork, residential natural gas, plastic resins, and dairy products all moved higher. Headline prices were up 6.2% Y/Y
U.S. import prices were up for the sixth month in a row, rising 0.7% in April following monthly gains of 1% or more since December. U.S. import prices rose 10.6% Y/Y, the largest increase since an 11.1% Y/Y advance in October 2011. Both fuel and nonfuel import prices were up in April. U.S. export prices have also been on the rise and were up 0.8% in April. Export prices have advanced 14.4% Y/Y.
In contrast to last week’s disappointing employment report, job openings reached a record 8.1 million at the end of March, signaling a growing divide between the increased demand for labor and the willingness to work among the 9.7 million unemployed. The number of job openings in manufacturing rose from 572,000 in February to 706,000 in March. Reasons for the disconnect likely include childcare considerations (only half of elementary and middle schools have returned to full-time instruction), enhanced unemployment benefits, skill mismatch, and fear of contracting or transmitting COVID-19.
The nation’s industrial sector continued to rebound into April with industrial production up by 0.7%. Compared to a year ago, production was up 16.5%. Manufacturing output rose 0.4% with mixed results among individual industries. Reflecting the continued improvement from the February freeze in the Gulf Coast, the largest gains were in chemicals and petroleum products. There were also gains in food & beverage, primary metals, motor vehicles, electrical equipment & appliances, apparel, and computers & electronics. Capacity utilization continued to tighten, up 0.5 percentage points to 74.9%.
Small business optimism rose to its highest level since the pandemic began, up 1.6 points to 99.8. Eight of the 10 index components improved. Owners indicated they have plans to invest in their businesses in the next three to six months. Despite the gain, job openings remain at record highs with 44% of business owners reporting that job openings that could not be filled.
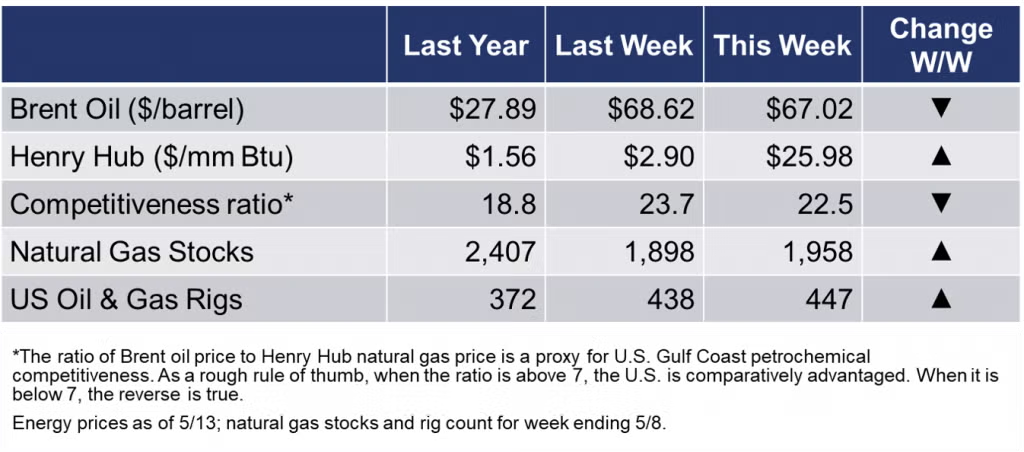
The rig count rose by nine to 447 rigs during the week ending 7 May. The build in natural gas inventories was typical for the week and in line with expectations. After rising oil prices amid the Colonial Pipeline shutdown, prices pulled back.
For the business of chemistry, the indicators still bring to mind a green banner for basic and specialty chemicals.
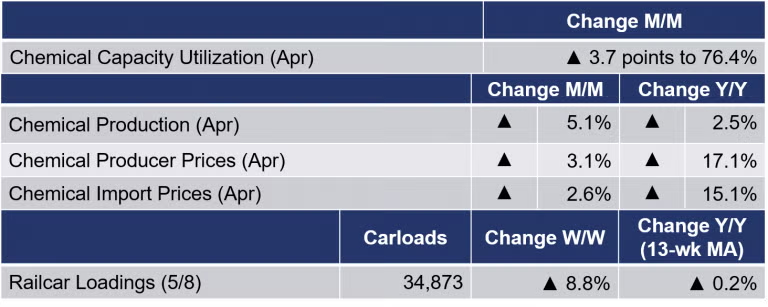
According to data released by the Association of American Railroads, chemical railcar loadings, the best ‘real time’ indicator of chemical industry activity, rose by 8.8% to 34,873 railcars the week ending 8 May (week 18). Loadings were up 21.3% Y/Y, up 1.3% YTD/YTD and the 13-week moving average, which is used to smooth out volatility, was up for the first time since February, albeit slightly (by 0.2%).
Chemical producer prices rose for an 11th consecutive month in April, up by 3.1%. There were gains across all segments, with the largest gains in the prices of plastic resins, manufactured fibers, synthetic rubber, and bulk petrochemicals & organic intermediates. Compared to a year ago, chemical producer prices were up 17.1%.
U.S. chemical import prices were also up for the 11th month in a row. Import prices rose 2.6% in April following monthly gains of 2% or more since December. U.S. import prices were up 15.1% Y/Y. U.S. chemical export prices have also been on the rise and were up 5.4% in April. Export prices were up 24.7% Y/Y.
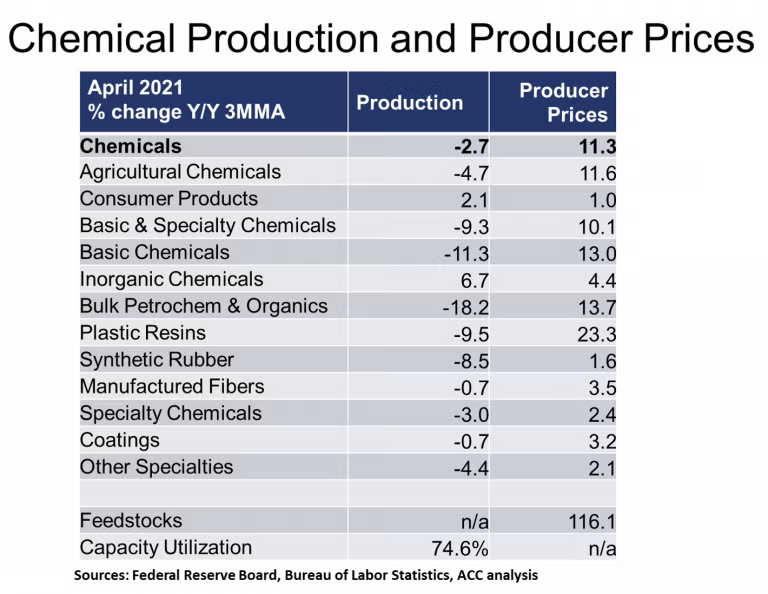
With further restarts (from the shutdowns associated with the winter storm), chemical production rose 5.1% in April. Gains were broad-based but production of specialties fell. Basic chemicals jumped 9.8% with particularly large gains in bulk petrochemicals & organic intermediates as well as plastic resins. Production was up 2.5% Y/Y. Industry capacity rose 0.1% and with the gain in output, capacity utilization rose 3.7 points to 76.4% in April. A year earlier it was 74.7%. ICIS is now reporting that less than 5% of chemical capacity remains offline due to the winter storms, a big improvement over recent weeks.
Note On the Color Codes
The banner colors represent observations about the current conditions in the overall economy and the business chemistry. For the overall economy we keep a running tab of 20 indicators. The banner color for the macroeconomic section is determined as follows:
Green – 13 or more positives
Yellow – between 8 and 12 positives
Red – 7 or fewer positives
For the chemical industry there are fewer indicators available. As a result we rely upon judgment whether production in the industry (defined as chemicals excluding pharmaceuticals) has increased or decreased three consecutive months.
For More Information
ACC members can access additional data, economic analyses, presentations, outlooks, and weekly economic updates through MemberExchange.
In addition to this weekly report, ACC offers numerous other economic data that cover worldwide production, trade, shipments, inventories, price indices, energy, employment, investment, R&D, EH&S, financial performance measures, macroeconomic data, plus much more. To order, visit http://store.americanchemistry.com/.
Every effort has been made in the preparation of this weekly report to provide the best available information and analysis. However, neither the American Chemistry Council, nor any of its employees, agents or other assigns makes any warranty, expressed or implied, or assumes any liability or responsibility for any use, or the results of such use, of any information or data disclosed in this material.
Contact us at ACC_EconomicsDepartment@americanchemistry.com
