Running tab of macro indicators: 14 out of 20
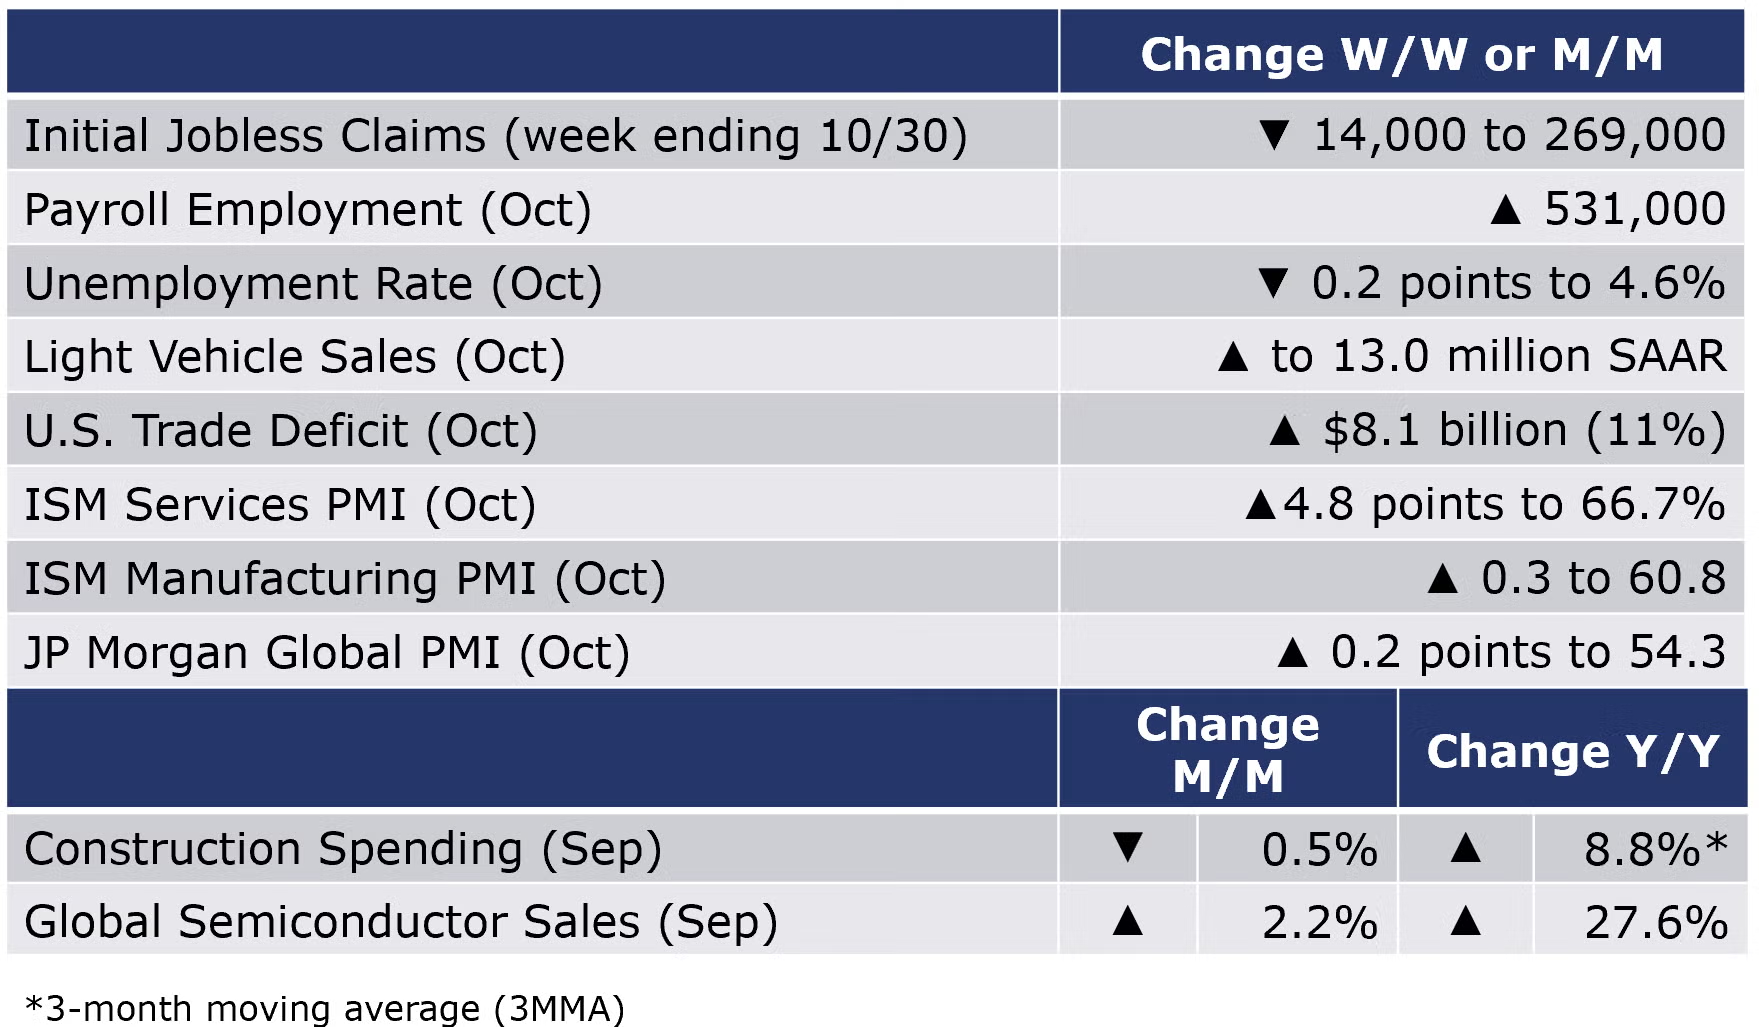
The number of new jobless claims fell by 14,000 to 269,000 during the week ending 30 October, the lowest since March 14, 2020. Continuing claims decreased by 134,000 to 2.1 million, and the insured unemployment rate for the week ending 23 October declined by 0.1 points to 1.6%.
Nonfarm payrolls expanded by 531,000 in October, a better-than-expected gain. This follows upwardly revised gains in August and September. There were gains across all major segments, except government (teachers) which continued to decline. Reflecting continued strong demand for goods, manufacturing employment grew for a sixth consecutive month, up by 60,000. Average hourly earnings for all workers rose 4.9% to $30.96. The unemployment rate fell by 0.2 points to 4.6%, the lowest since the pandemic began and approaching the 4.4% rate from February 2020. The decline in the unemployment rate reflects higher employment rather than large growth in the labor force. The participation rate was essentially unchanged from September (at 61.6%), but remains 1.7 points lower than in February 2020.
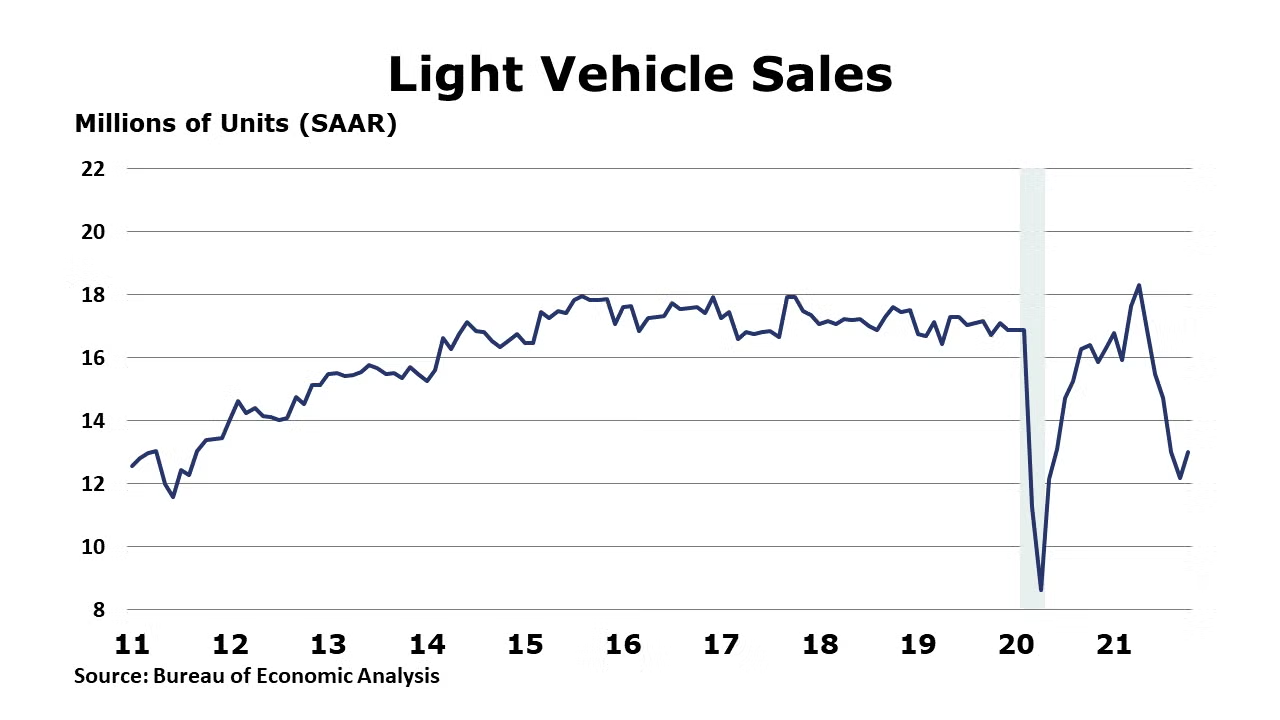
Still struggling amid shortages of semiconductors and other materials, light vehicle sales remained depressed, though up slightly from September to a 13.0 million seasonally adjusted annual rate (SAAR).
The U.S. trade deficit in goods and services rose to $8.1 billion in September to $80.9 billion, up 11% from August as exports declined by 3% and imports grew by 0.6%.
Construction spending declined by 0.5% to $1,574 billion (SAAR) in September with spending on both private and public projects declining. On a 3MMA Y/Y basis, spending is still quite elevated at 8.8% higher. This comparison has been driven by growth in private residential building construction spending which was up by 21.9% Y/Y (3MMA).
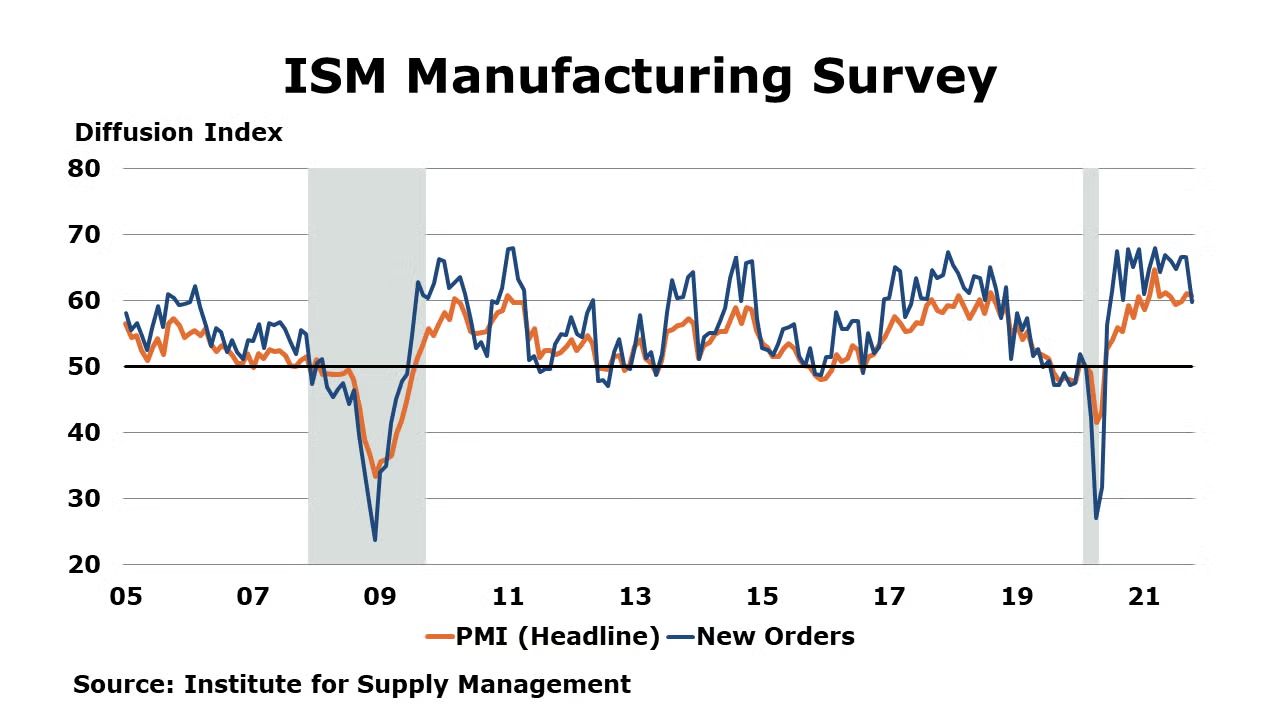
The ISM PMI for services grew by 4.8 points to 66.7 in October, a very strong reading and an all-time high. All 18 service industries reported growth. However, ongoing challenges — including supply chain disruptions — are constraining capacity. ISM’s October Manufacturing PMI measure points to continued growth in the US economy and in the manufacturing sector. October was the 17th consecutive month of growth for the US economy. The manufacturing PMI was lower at 60.8, down from 61.1 in September. This figure is over 50, indicating continued expansion. Growth continued in new orders, production and employment. Manufacturers are facing challenges with supply chain disruptions and it shows up in the ISM data. According to ISM, “…companies and suppliers continue to deal with an unprecedented number of hurdles to meet increasing demand. All segments of the manufacturing economy are impacted by record-long raw materials lead times, continued shortages of critical materials, rising commodities prices and difficulties in transporting products. Global pandemic-related issues — worker absenteeism, short-term shutdowns due to parts shortages, difficulties in filling open positions and overseas supply chain problems — continue to limit manufacturing growth potential”. The JP Morgan Manufacturing PMI rose by 0.2 points to 54.3, indicating that the global manufacturing sector expanded in October. There was slower growth in output, new orders, and new export orders. Inflation rose at a faster pace and there was a record lengthening in supplier lead times, reflecting the ongoing supply chain challenges gripping the global economy.
As expected, factory orders edged higher by 0.2% in September. It was the smallest gain since April. A gain in orders for nondurable goods (including higher priced petroleum products) offset declining orders for long-lasting durable goods, particularly transportation equipment. Core business orders rose by 0.8%, the largest increase since June. Manufacturing shipments rose 0.4% with broad gains across most industries (except motor vehicles). Inventories rose for an eighth consecutive month, up by 0.9% with gains across the majority of industry segments. Compared to a year ago, inventories were ahead 8.3% Y/Y while shipments were up 11.9% Y/Y. The inventories-to-sales ratio remained stable (compared to August) at 1.48 in September, but was down from 1.53 a year ago.
September marked the end of a record-breaking quarter for semiconductor sales, as more semiconductor units were shipped during 3Q21 than any other quarter in the market’s history. Global semiconductor sales totaled $48.3 billion in September, up 2.2% from August, according to data compiled by the World Semiconductor Trade Statistics (WSTS) organization, as reported by the Semiconductor Industry Association. Year-to-year gains were noted across all regions.
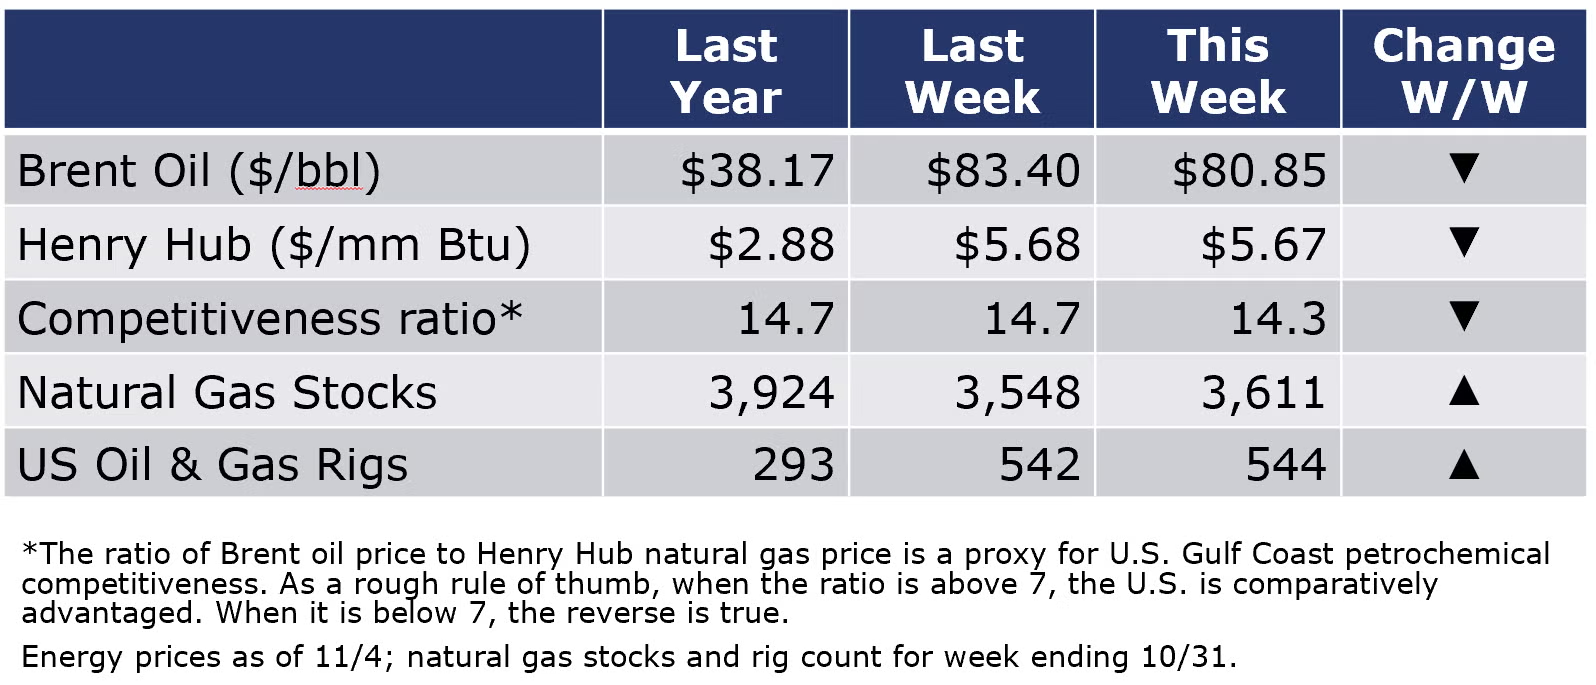
Following a decline the previous week, the combined oil and gas rig count rose by two to 542 rigs during the week ending 29 October. Oil prices fell during the week on another larger-than-expected inventory build. Natural gas prices edged slightly lower, but remain elevated as the northern hemisphere moves into the heating season.
For the business of chemistry, the indicators still bring to mind a yellow banner for basic and specialty chemicals.
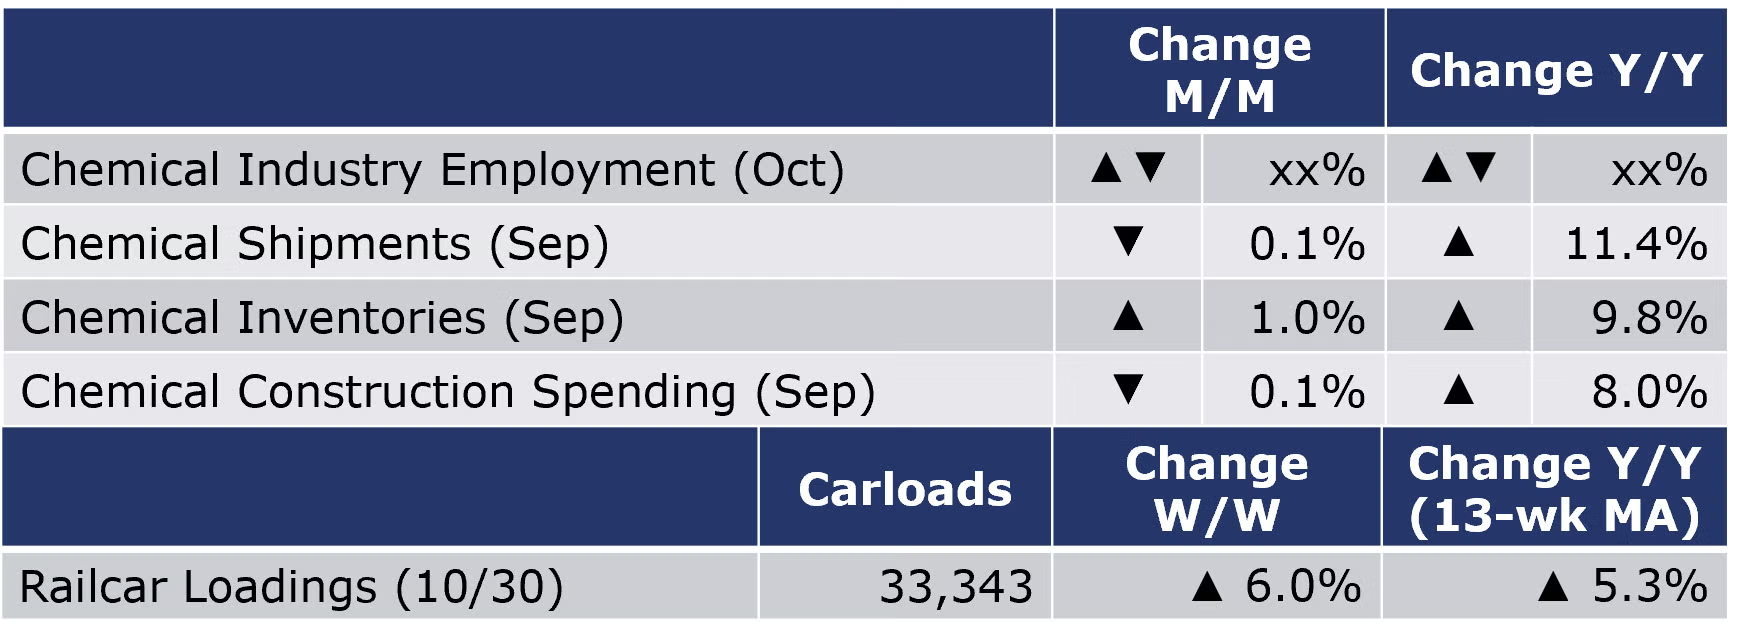
According to data released by the Association of American Railroads, chemical railcar loadings, the best ‘real time’ indicator of chemical industry activity, rose by 1,889 to 33,343 railcars during the week ending 30 October (week 43), the highest level in 12 weeks. Loadings were up 9.2% Y/Y, up 5.7% YTD/YTD and have been on the rise for 7 of the last 13 weeks.
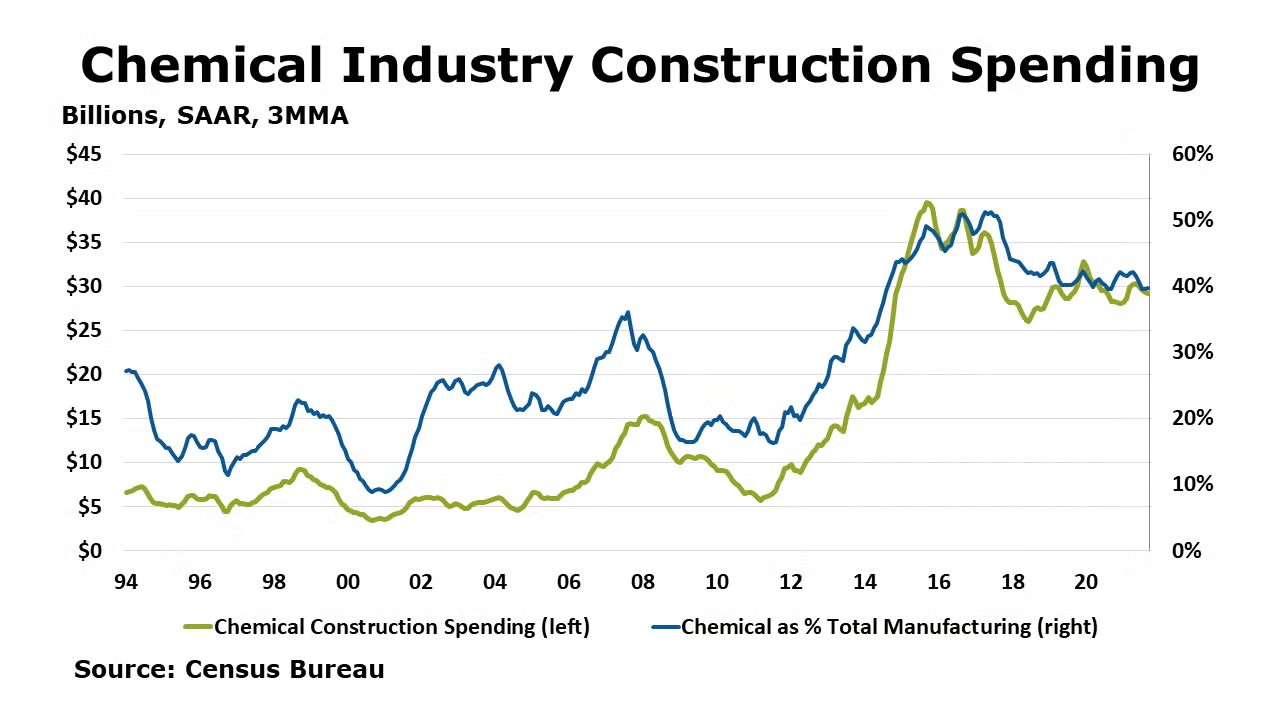
Construction spending on chemical manufacturing projects softened 0.5% in the month of September but at $29.3 billion (SAAR) it was still elevated compared to a year ago (up 8.0%). In September, spending on chemical projects comprised about 40% of total construction spending in manufacturing.
ISM’s latest Manufacturing PMI measure indicates expansion in chemicals, plastics and rubber products. One chemical industry respondent commented, “Business is getting stronger, but the supply chain is getting worse every day”. Production, employment, imports and new orders grew for chemicals in October. Chemical manufacturers reported slower supplier deliveries and higher inventories. Customer inventories, however, are reported to be too low. Prices for raw materials are reported to be higher. Backlogs of orders are at historical highs though they expanded at lower rate in October. New export orders increased in October for chemical products but declined for plastic and rubber products.
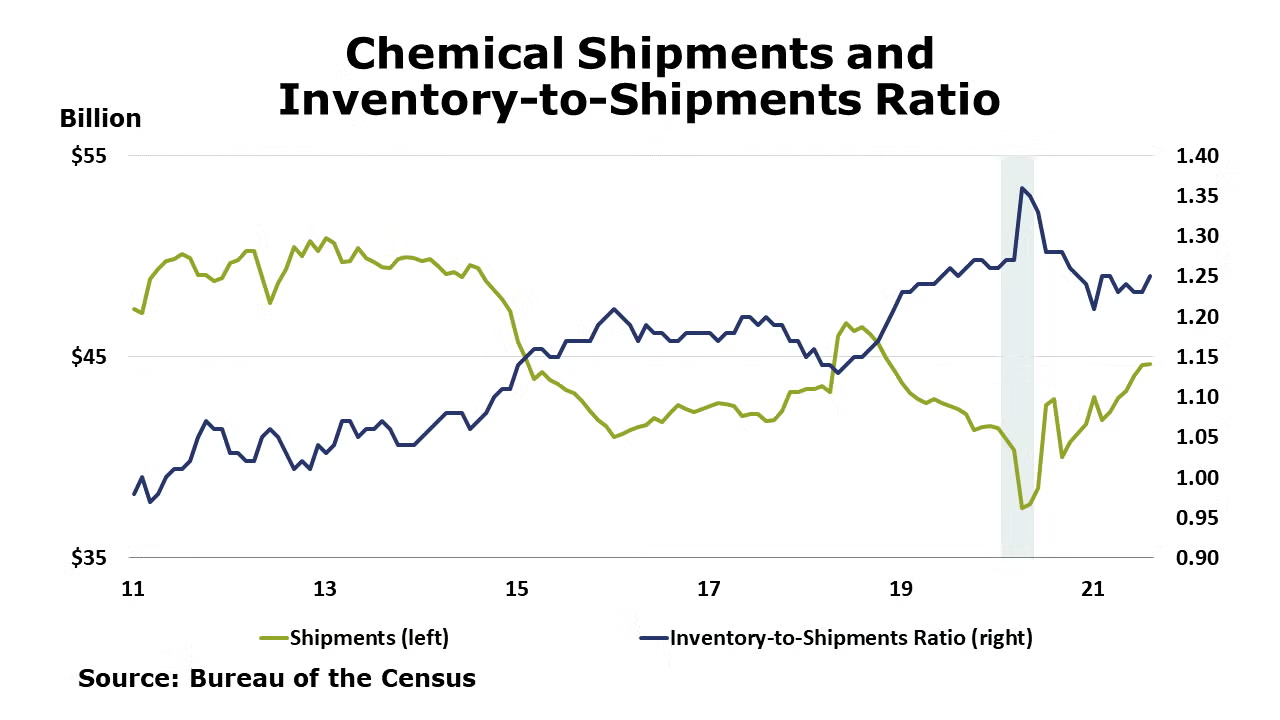
Chemical shipments edged lower by 0.1% in September. A small gain in shipments of coatings and adhesives offset further declines in agricultural chemicals and all other chemicals. Chemical inventories rose for a tenth consecutive month, however, by 1.0%. Inventories rose along all major segments. Compared to a year ago, inventories were up 9.8% Y/Y while shipments were up by 11.4% Y/Y. The inventories-to-sales ratio ticked higher to 1.26 in September compared to August. A year ago, the ratio was 1.28. Chemical inventories remained in a relatively tight position heading into the last quarter of the year.
Chemical industry (including pharma) employment rebounded in October, up by 5,600 (0.7%), following a revised decline of 300 in September. Compared to last October, employment remained higher by 25,100 (3.0%). Production worker jobs rose by 0.2% in October, and supervisory and non-production employment rose by 1.1%. Average wages were up 4.2% Y/Y to $27.07. The average workweek increased to 41.1 hours. Combined with the reduction in production workers, the total labor input into the chemical industry rose by 0.9%, suggesting chemical production contracted in October which is consistent with the ISM report.
The benchmark S&P 500 index rose by 5.4% in October. Chemical equity prices, as measured by the S&P index for chemical companies also rose, up 7.0% for the month. Equity prices are often a good indicator of future activity and represent one component of the leading economic indicators. Compared to the beginning of the year, chemical equities were up 16.6% while the S&P 500 index was up 22.4% year-to-date.
Note On the Color Codes
The banner colors represent observations about the current conditions in the overall economy and the business chemistry. For the overall economy we keep a running tab of 20 indicators. The banner color for the macroeconomic section is determined as follows:
Green – 13 or more positives
Yellow – between 8 and 12 positives
Red – 7 or fewer positives
For the chemical industry there are fewer indicators available. As a result we rely upon judgment whether production in the industry (defined as chemicals excluding pharmaceuticals) has increased or decreased three consecutive months.
For More Information
ACC members can access additional data, economic analyses, presentations, outlooks, and weekly economic updates through MemberExchange.
In addition to this weekly report, ACC offers numerous other economic data that cover worldwide production, trade, shipments, inventories, price indices, energy, employment, investment, R&D, EH&S, financial performance measures, macroeconomic data, plus much more. To order, visit http://store.americanchemistry.com/.
Every effort has been made in the preparation of this weekly report to provide the best available information and analysis. However, neither the American Chemistry Council, nor any of its employees, agents or other assigns makes any warranty, expressed or implied, or assumes any liability or responsibility for any use, or the results of such use, of any information or data disclosed in this material.
Contact us at ACC_EconomicsDepartment@americanchemistry.com

