Running tab of macro indicators: 12 out of 20
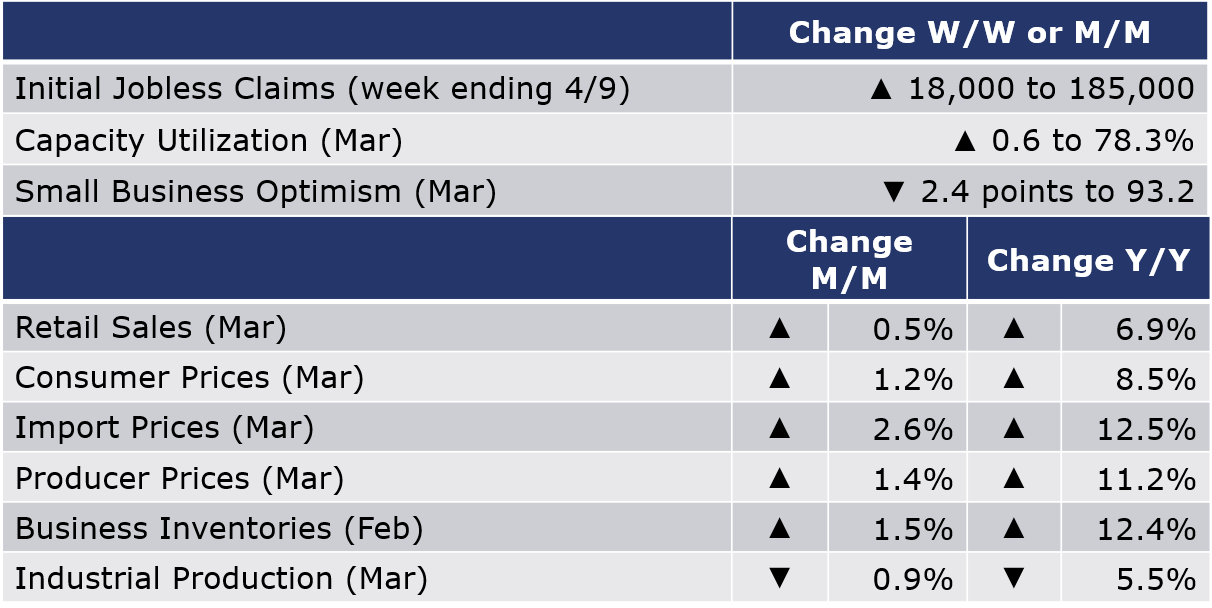
The number of new jobless claims rose by 18,000 to 185,000 during the week ending 9 April. Continuing claims fell by 48,000 to 1.475 million, and the insured unemployment rate for the week ending 2 April was unchanged at 1.1%.
Headline consumer prices rose by 1.2% in March and were up 8.5% Y/Y. The gasoline index rose 18.3% percent in March and accounted for over half of the “all items” increase; there were also large increases in shelter and food. The index for all items less food and energy (core CPI) rose 0.3% in March, a moderation in the pace of monthly gains. The shelter index was by far the biggest factor in the increase, with a broad set of other indexes also contributing, including those for airline fares, household furnishings and operations, medical care, and motor vehicle insurance. In contrast, the index for used cars and trucks fell 3.8% over the month.
Headline producer prices rose by 1.4% in March, following gains of 0.9% in February and 1.2% in January. Higher energy costs related to Russia’s invasion of Ukraine accounted for about half of the increase in prices for final demand goods. In addition to prices for petroleum products, there were gains in prices for fresh and dry vegetables, iron and steel scrap and electric power. Excluding food and energy, core producer prices were up 1.1%. Compared to a year ago, headline producer prices were up 11.2% Y/Y while core prices were up 7.0% Y/Y.
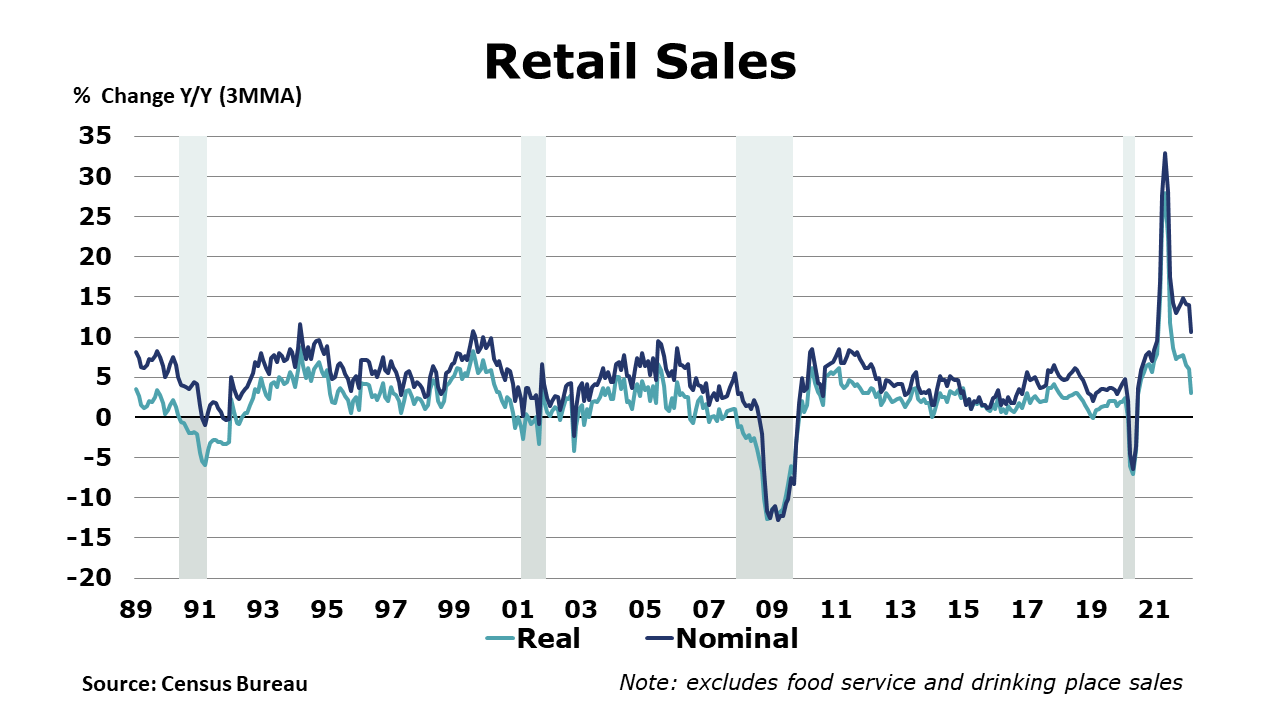
Following a 4.9% gain in January and a 0.8% gain in February, retail sales rose 0.5% in March. After adjusting for higher inflation, real retail sales were lower. Results were mixed within segments, suggesting that higher prices at the pump (8.9% monthly increase) may be eating into sales of other segments. Online sales eased as the impact from Omicron faded. Compared to a year ago, retail sales were up 6.9%.
U.S. import prices rose 2.6% in March, after advancing 1.6% in February and 2.0% in January. Higher fuel and nonfuel prices drove the increases in all three months. Import prices were up 12.5% Y/Y. Prices for U.S. exports advanced 4.5% in March following a 3.0% rise the previous month.
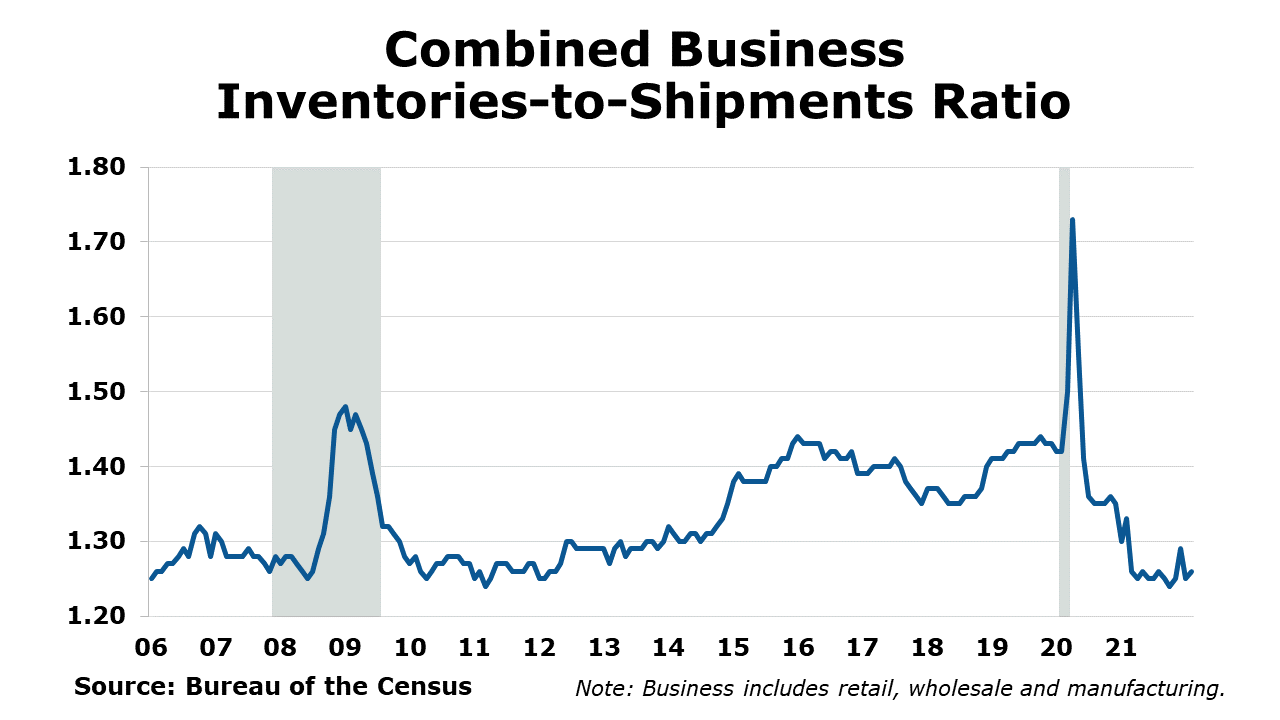
Combined business inventories rose by 1.5% in February with gains in retail, wholesale, and manufacturing inventories. Combined business sales increased 1.0% with gains in manufacturing, retail, and wholesale. Compared to a year ago, business sales were up 18.8% while inventories were up 12.4% Y/Y. The combined inventories-to-sales ratio was higher at 1.26 compared to 1.25 in January.
Industrial production rose by 0.9% in March, a better-than-expected gain. Mining output (including oil & gas) rose strongly and utility output also rose. Manufacturing output rose by 0.9% and follows a 1.2% gain in February. The largest gains were in motor vehicles and parts, aerospace, electrical equipment, and plastic & rubber products. Compared to a year ago, overall industrial production was up 5.5% Y/Y. Capacity utilization tightened by 0.6 points to 78.3%, the highest since January 2019 and a sign of underlying demand.
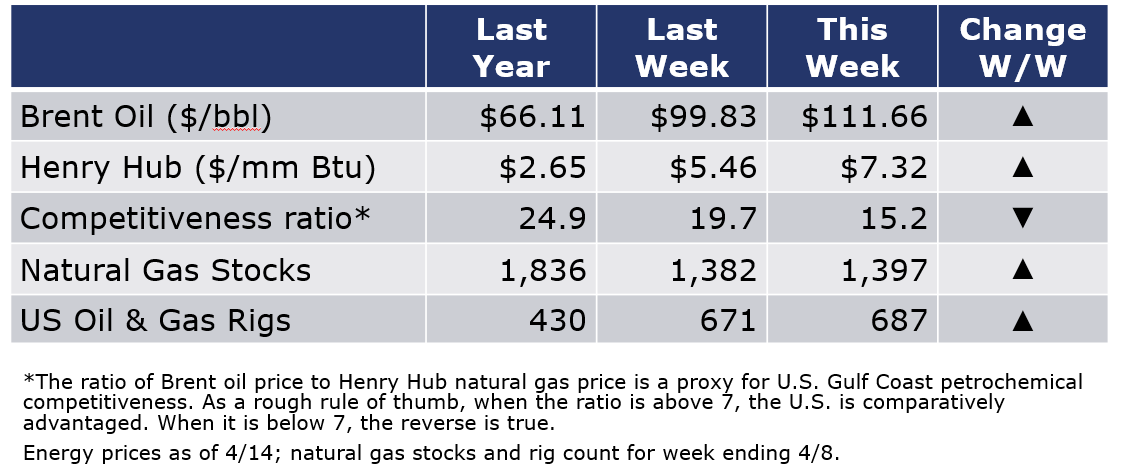
Oil prices were up following an IEA report suggesting that the 3 million bpd of Russian oil expected to leave the market in May could not be replaced by reserve releases, increased OPEC production, and Iranian production. Natural gas prices rose above $7/mmbtu as high drilling costs, labor shortages, and strict capital-discipline are limiting growth in gas production capacity. The realization comes at the same time as natural gas demand growth is accelerating. The combined oil and gas rig count rose by 16 to 687, but remains well below pre-pandemic levels of drilling.
For the business of chemistry, the indicators still bring to mind a green banner for basic and specialty chemicals.
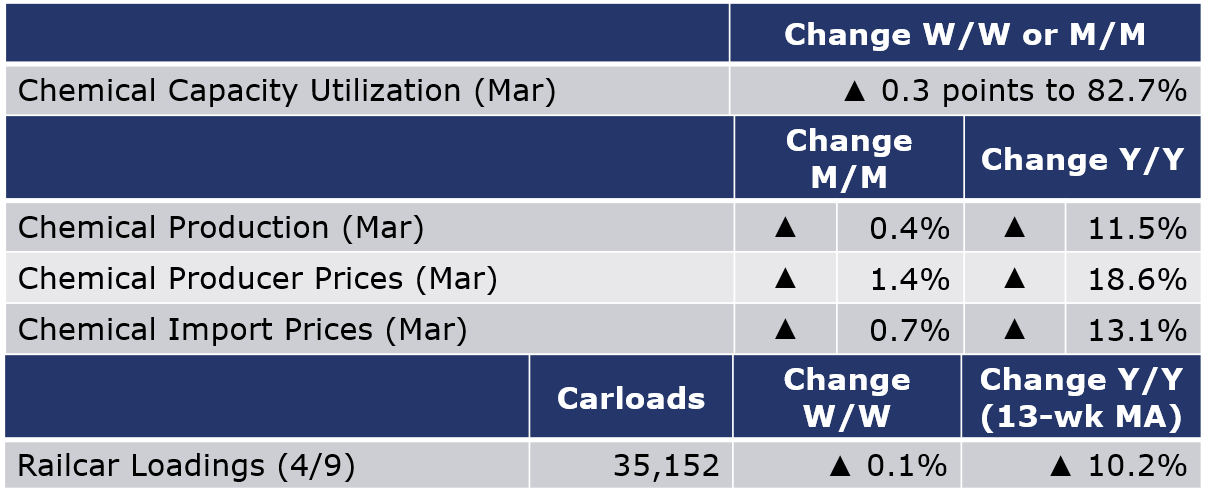
According to data released by the Association of American Railroads, chemical railcar loadings were essentially flat for the week ending 9 April. Loadings were up 10.2% Y/Y (13-week MA), up 9.7% YTD/YTD and have been on the rise for 9 of the last 13 weeks.
Chemical prices (as measured by the producer price index) rose 1.4% in March, the 22nd monthly gain. Chemical prices rose in all categories with the exception of plastic resins, which eased by 0.3% (the fifth monthly decline). The largest gains were in bulk petrochemical and organics and agricultural chemicals. Compared to a year ago, chemical prices were up 18.6% Y/Y, the smallest annual increase since May 2021.
U.S. chemical imports prices rose 0.7% in March, after advancing 0.9% in February. Chemical imports prices have also risen for 22 consecutive months. Prices for U.S. chemical exports rose 1.6% in March following a 0.1% decline the previous month. Year-over-year comparisons have been high for both import and export prices. In March, chemical import prices were up 13.1% Y/Y and export prices were up 9.3% Y/Y.
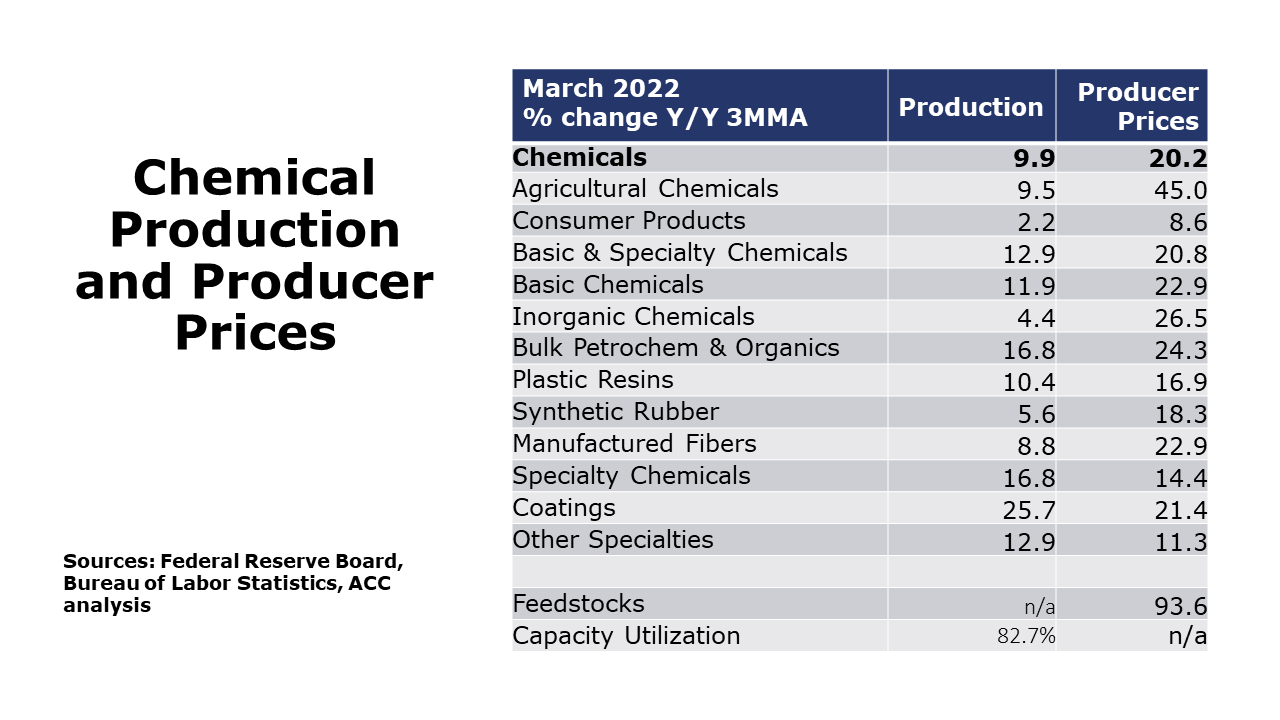
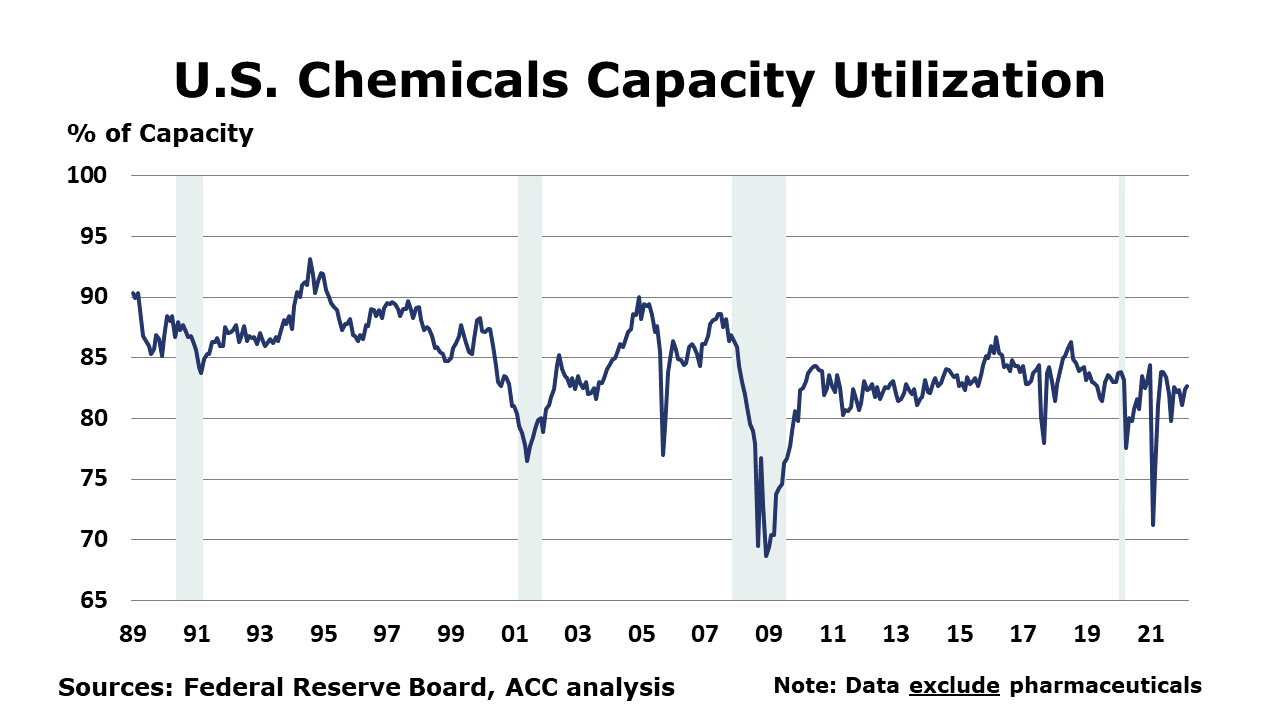
Chemical production rose 0.4% in March following a 1.8% gain in February and 1.3% decline in January. There were gains across most segments, except synthetic materials. The largest monthly gains were in basic inorganic chemicals, coatings, other specialty chemicals, fertilizers, and crop protection chemicals. Chemical capacity utilization tightened, up 0.3 points to 82.7%.
Note On the Color Codes
The banner colors represent observations about the current conditions in the overall economy and the business chemistry. For the overall economy we keep a running tab of 20 indicators. The banner color for the macroeconomic section is determined as follows:
Green – 13 or more positives
Yellow – between 8 and 12 positives
Red – 7 or fewer positives
For the chemical industry there are fewer indicators available. As a result we rely upon judgment whether production in the industry (defined as chemicals excluding pharmaceuticals) has increased or decreased three consecutive months.
For More Information
ACC members can access additional data, economic analyses, presentations, outlooks, and weekly economic updates through MemberExchange.
In addition to this weekly report, ACC offers numerous other economic data that cover worldwide production, trade, shipments, inventories, price indices, energy, employment, investment, R&D, EH&S, financial performance measures, macroeconomic data, plus much more. To order, visit http://store.americanchemistry.com/.
Every effort has been made in the preparation of this weekly report to provide the best available information and analysis. However, neither the American Chemistry Council, nor any of its employees, agents or other assigns makes any warranty, expressed or implied, or assumes any liability or responsibility for any use, or the results of such use, of any information or data disclosed in this material.
Contact us at ACC_EconomicsDepartment@americanchemistry.com


