Running tab of macro indicators: 12 out of 20
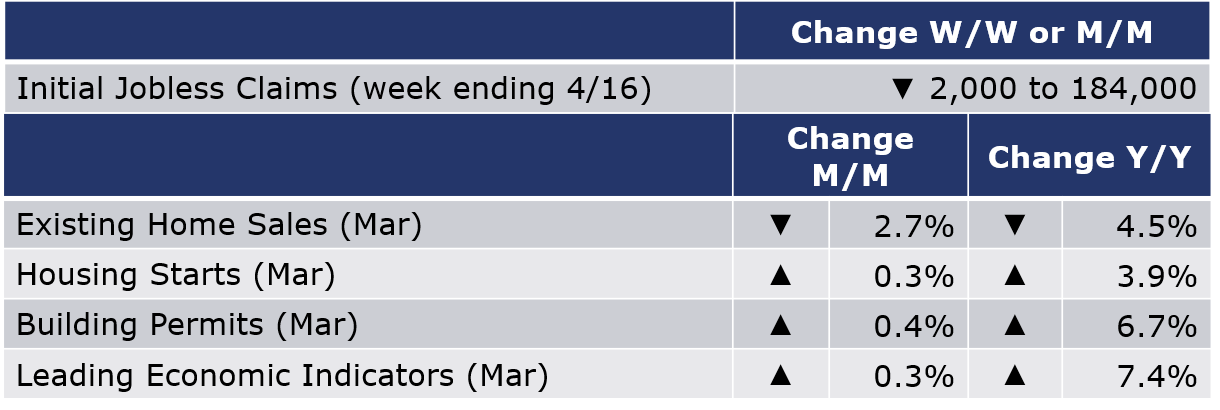
The number of new jobless claims fell by 2,000 to 184,000 during the week ending 16 April. Continuing claims fell by 58,000 to 1.4 million, the lowest level in more than fifty years. The insured unemployment rate for the week ending 9 April was down 0.1% at 1.0%.
Existing home sales declined for the second straight month, a 2.7% loss to a 5.77 million annual pace in March, reflecting rising mortgage rates and higher inflation. The 30-year fixed mortgage rate rose above 5% for the first time since 2011, raising monthly payments, and impacting affordability. Compared to a year ago, sales were off 4.5%. The inventory of unsold homes at the end of the month increased and represents a 2.0-month supply at the current sales pace. This is higher than last month and lower than a year ago. The median sales price was up 15.0% Y/Y.
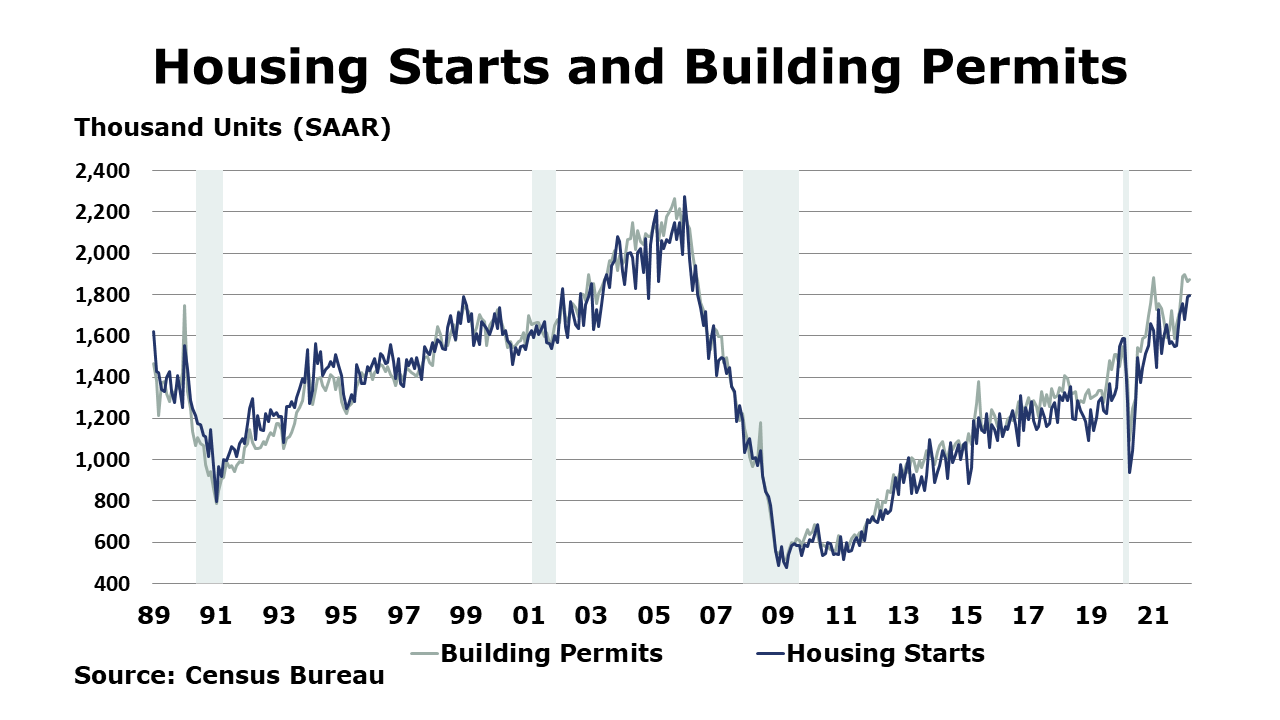
Despite rising mortgage rates and rising prices for lumber and other building materials, demand for housing remains strong. Housing starts edged higher by 0.3% to a 1.79 million annual pace in March, the highest pace since mid-2006. Single-family starts, however moved lower by 1.7% to a 1.2 million pace. Forward-looking building permits edged higher by 0.4% to a 1.87 million pace. Compared to a year ago, housing starts were up 3.9% Y/Y while building permits were up 6.7% Y/Y.
Homebuilder sentiment dropped to a seven-month low in April as higher mortgage rates exacerbated the impact of rising inflation for building materials and higher labor costs. Down by 2 points to 77, the NAHB/Wells Fargo Housing Market Index declined for a fourth month. Like the ISM Purchasing Managers Index, a reading above 50 indicates expansion; the decline in this month’s reading suggests the housing market expanded at a slower pace as current sales conditions and buyer traffic eased, while sales expectations in the next six months accelerated.
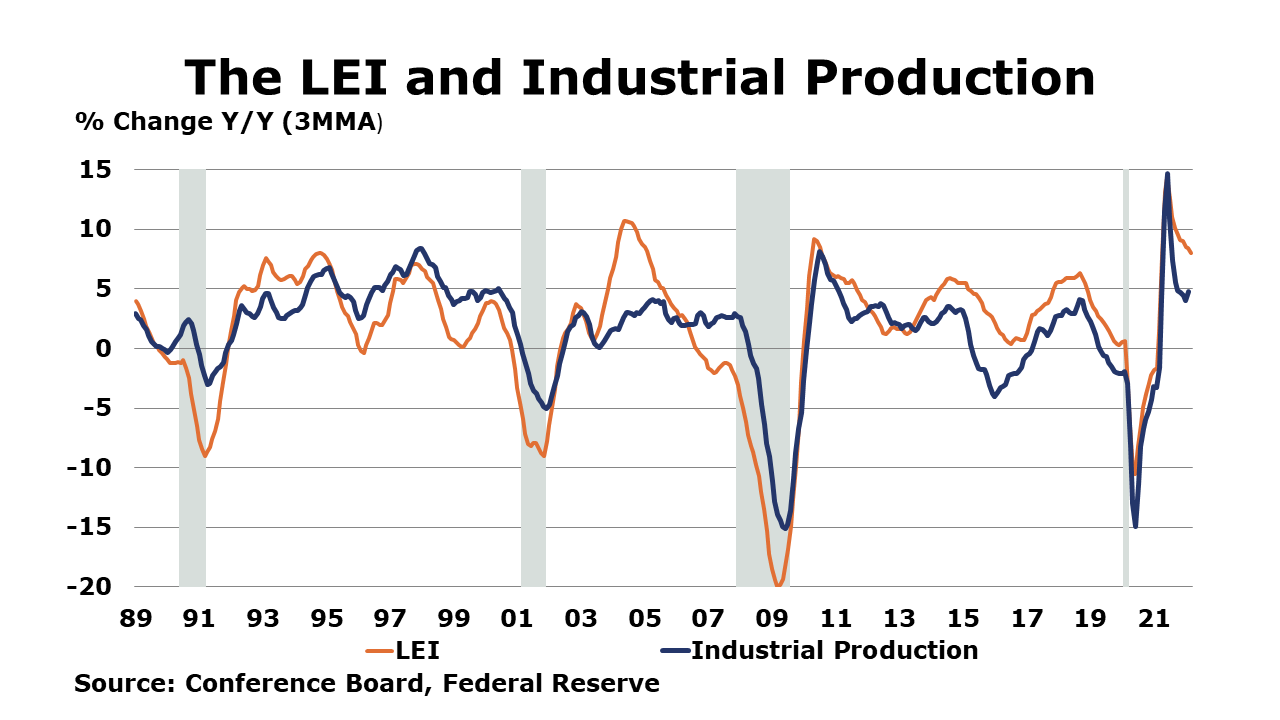
Despite headwinds related to Russia’s invasion of Ukraine, the Conference Board’s Index of Leading Economic Index® (LEI) rose by 0.3% in March, following an upwardly revised 0.6% gain in February. The Conference Board notes, “this broad-based improvement signals economic growth is likely to continue through 2022 despite volatile stock prices and weakening business and consumer expectations.”
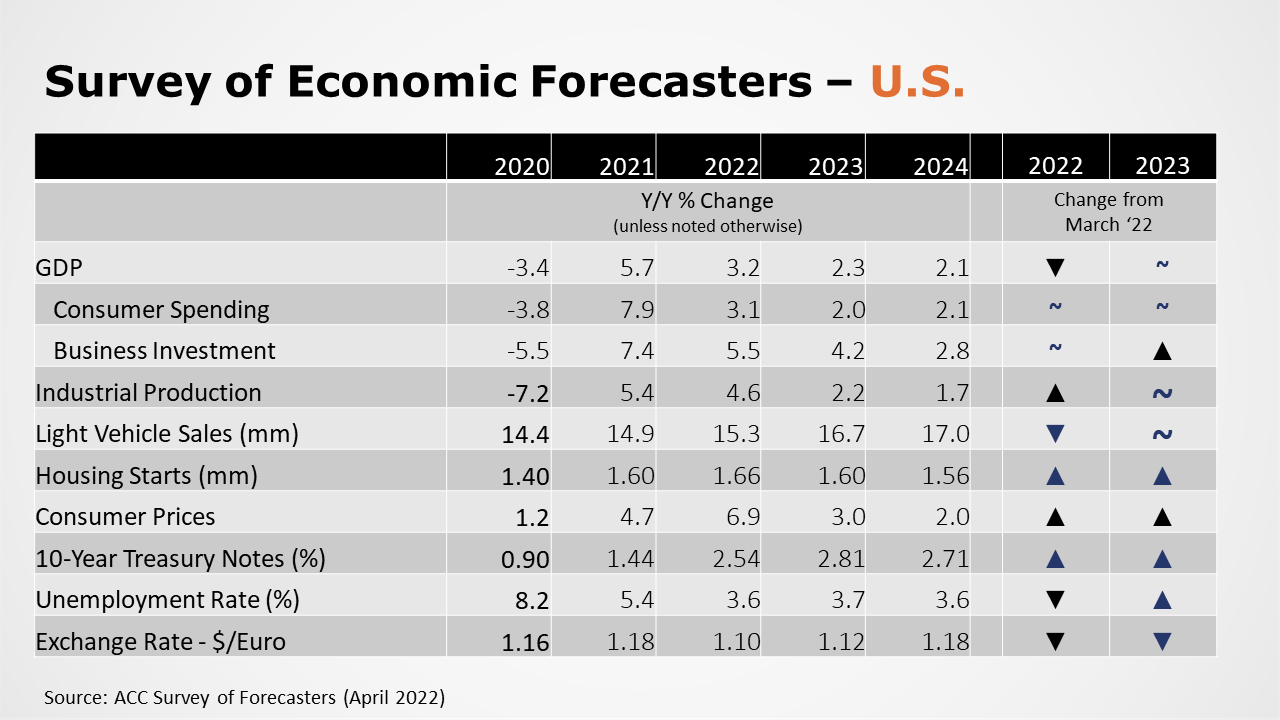
ACC SURVEY OF ECONOMIC FORECASTERS – U.S.
• The outlook for 2022 weakened slightly compared to March with ongoing inflationary pressures, exacerbated by the Russian invasion of Ukraine, and subsequent monetary tightening.
• Expectations into 2023 remain largely stable compared to March but were lower compared to the beginning of the year.
• U.S. GDP is expected to grow by 3.2% in 2022 as the highest inflation in decades erodes growth prospects. In 2023, forecasters continue to expect U.S. to grow by 2.3%, near its long-term trend.
• With sharply higher inflation and the removal of fiscal stimulus, consumer spending is expected to increase by 3.1% in 2022 (down from a 7.9% surge in 2021) before slowing further to a 2.0% gain in 2023.
• Business fixed investment is expected to expand by 5.5% in 2022 and 4.2% in 2023.
• Industrial production is expected to rise 4.6% in 2022 (higher than last month’s expectations as oil & gas activity ramps up) and 2.2% in 2023.
• With continued supply chain challenges for vehicle manufacturers, expectations for light vehicle sales were lowered again to 15.3 million in 2022 and rising to 16.7 million in 2023.
• Expectations for housing starts edged slightly higher to 1.66 million in 2022 and 1.60 million in 2023.
• The unemployment rate is expected to average 3.6% in 2022 and 3.7% in 2023.
• Inflation continues to accelerate, first from tight supply chains and worker shortages, and now from the impact of Russian invasion on commodity markets. Expectations for gains in consumer prices were again sharply higher compared to last month with forecasters looking for inflation of 6.9% in 2022, before easing to a 3.0% pace in 2023, as constraints ease.
•Compared to last month, expectations for interest rates (10-year treasury) continued to move higher for 2022 and 2023.
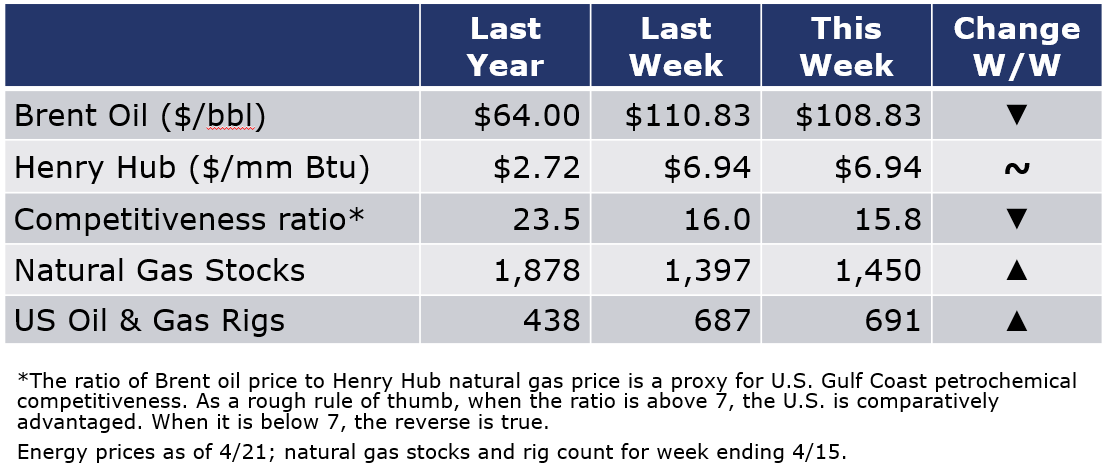
Oil prices eased on downward revisions to IMF’s projections for global economic growth this year. Natural gas prices moved above $7 earlier in the week but ended at the same level as last Thursday on a larger-than-expected inventory build of 53 BCF at the end of last week. The combined oil and gas rig count continued to move higher, up by 3 to 691 rigs.
For the business of chemistry, the indicators still bring to mind a green banner for basic and specialty chemicals.
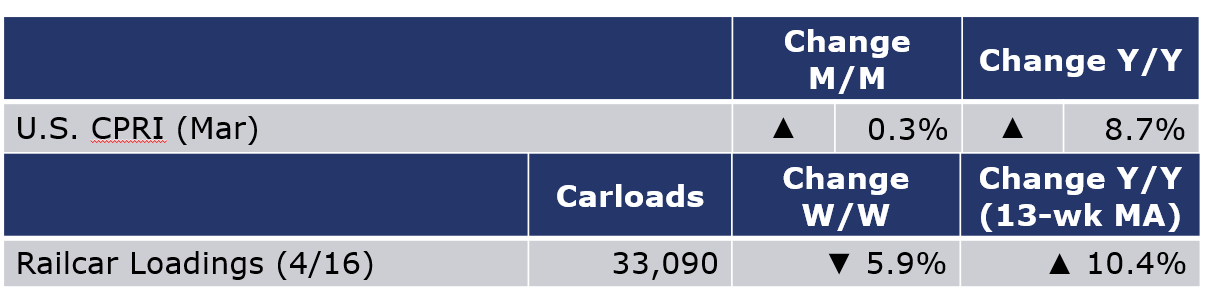
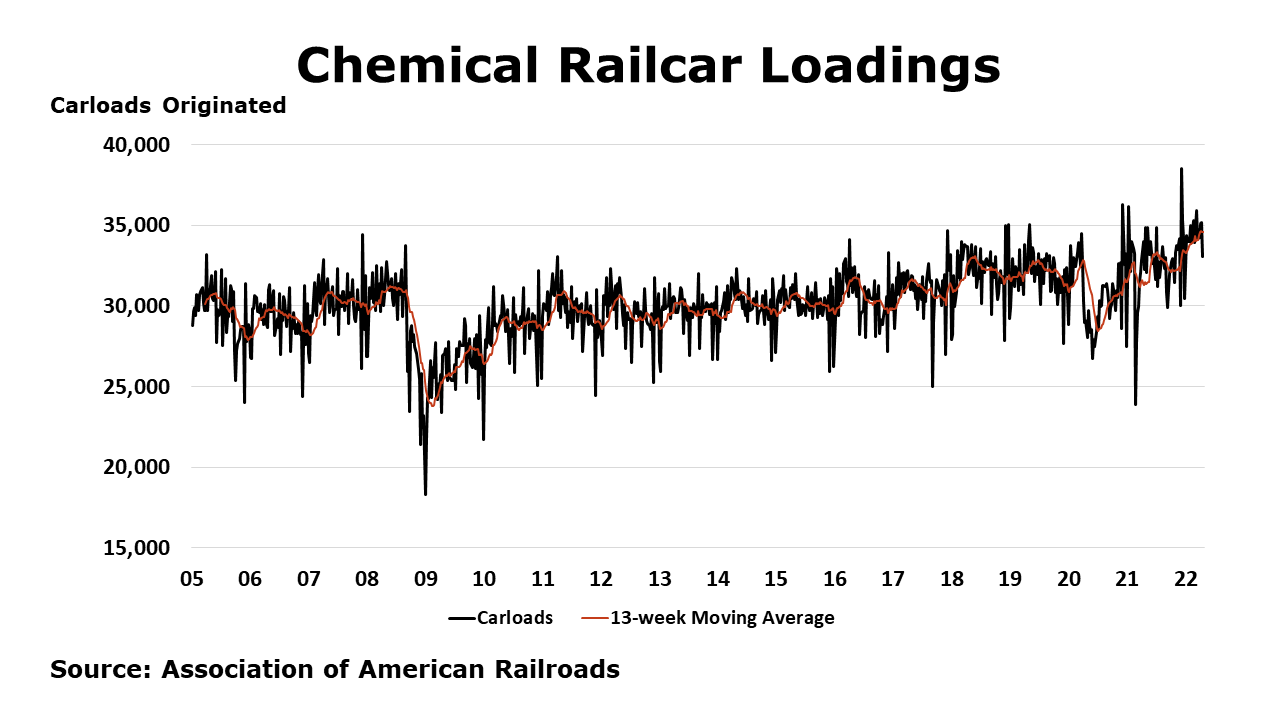
According to data released by the Association of American Railroads, chemical railcar loadings were down 2,062 (5.9%) for the week ending 16 April. Loadings were up 10.4% Y/Y (13-week MA), up 8.6% YTD/YTD and have been on the rise for 9 of the last 13 weeks.
The U.S. Chemical Production Regional Index (U.S. CPRI) was 0.3% higher in March following a similar gain in February and a 0.2% decline in January, according to the ACC. Chemical output rose across all regions with the largest gains in the Gulf Coast. The U.S. CPRI is measured as a three-month moving average (3MMA). Compared with March 2021, U.S. chemical production was ahead by 8.7%, an improving comparison from last month and reflecting the steep output losses in 2021 from winter storm Uri. Chemical production continued to be higher than a year ago in all regions.
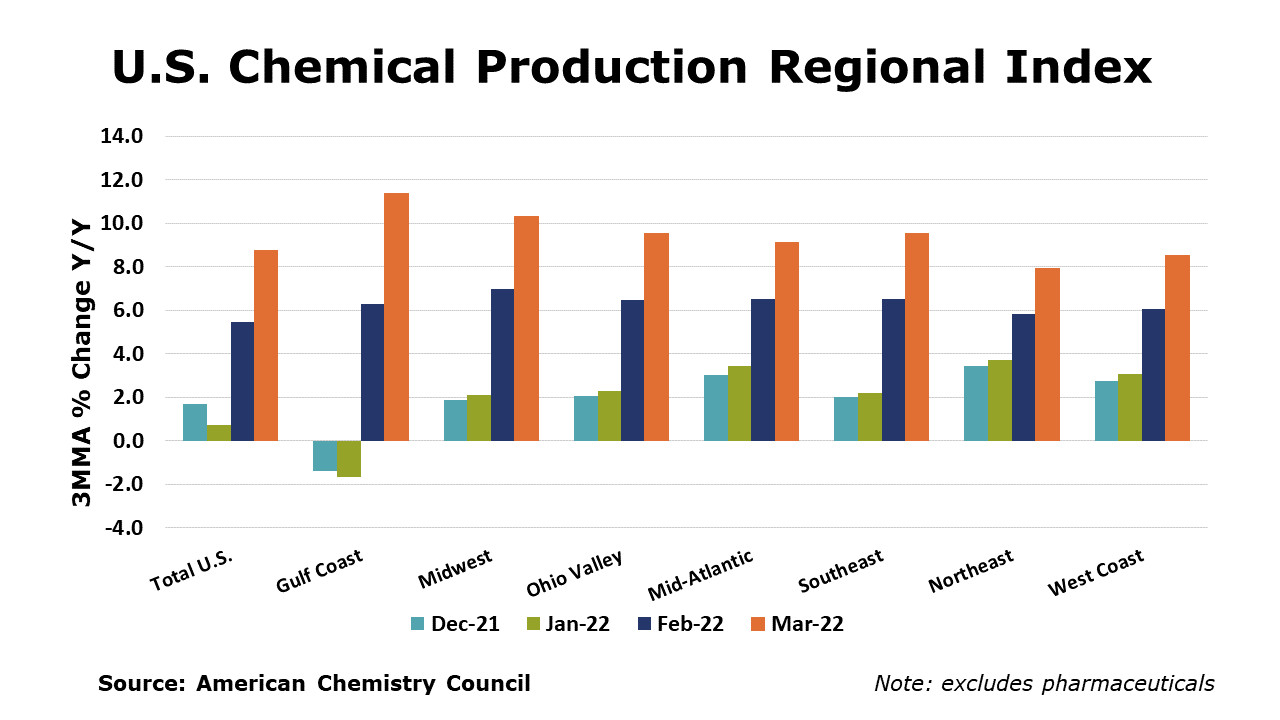
Chemical production was mixed in March (3MMA), with an improving trend in the production of coatings, adhesives, industrial gases, organic chemicals, synthetic rubber, manufactured fibers, plastic resins and basic inorganic chemicals. These gains were offset by weakness in the output of fertilizers and crop protection chemicals. Production of other specialty chemicals was flat.
As nearly all manufactured goods are produced using chemistry in some form, manufacturing activity is an important indicator for chemical demand. Manufacturing output expanded for a seventh consecutive month in March, by 0.3% (3MMA). The 3MMA trend in manufacturing production was mixed, with gains in the output of foundries, semiconductors, refining, computers & electronics, oil & gas extraction, printing, furniture, plastic products, structural panels, construction supplies, fabricated metal products, paper, aerospace, appliances food & beverages, and apparel.
Note On the Color Codes
The banner colors represent observations about the current conditions in the overall economy and the business chemistry. For the overall economy we keep a running tab of 20 indicators. The banner color for the macroeconomic section is determined as follows:
Green – 13 or more positives
Yellow – between 8 and 12 positives
Red – 7 or fewer positives
For the chemical industry there are fewer indicators available. As a result we rely upon judgment whether production in the industry (defined as chemicals excluding pharmaceuticals) has increased or decreased three consecutive months.
For More Information
ACC members can access additional data, economic analyses, presentations, outlooks, and weekly economic updates through MemberExchange.
In addition to this weekly report, ACC offers numerous other economic data that cover worldwide production, trade, shipments, inventories, price indices, energy, employment, investment, R&D, EH&S, financial performance measures, macroeconomic data, plus much more. To order, visit https://store.americanchemistry.com/.
Every effort has been made in the preparation of this weekly report to provide the best available information and analysis. However, neither the American Chemistry Council, nor any of its employees, agents or other assigns makes any warranty, expressed or implied, or assumes any liability or responsibility for any use, or the results of such use, of any information or data disclosed in this material.
Contact us at ACC_EconomicsDepartment@americanchemistry.com

