Running tab of macro indicators: 12 out of 20

The number of new jobless claims declined by 5,000 to 166,000 during the week ending 2 April. Continuing claims decreased by 52,806 to 1.723 million, and the insured unemployment rate for the week ending 26 March held steady at 1.1%.
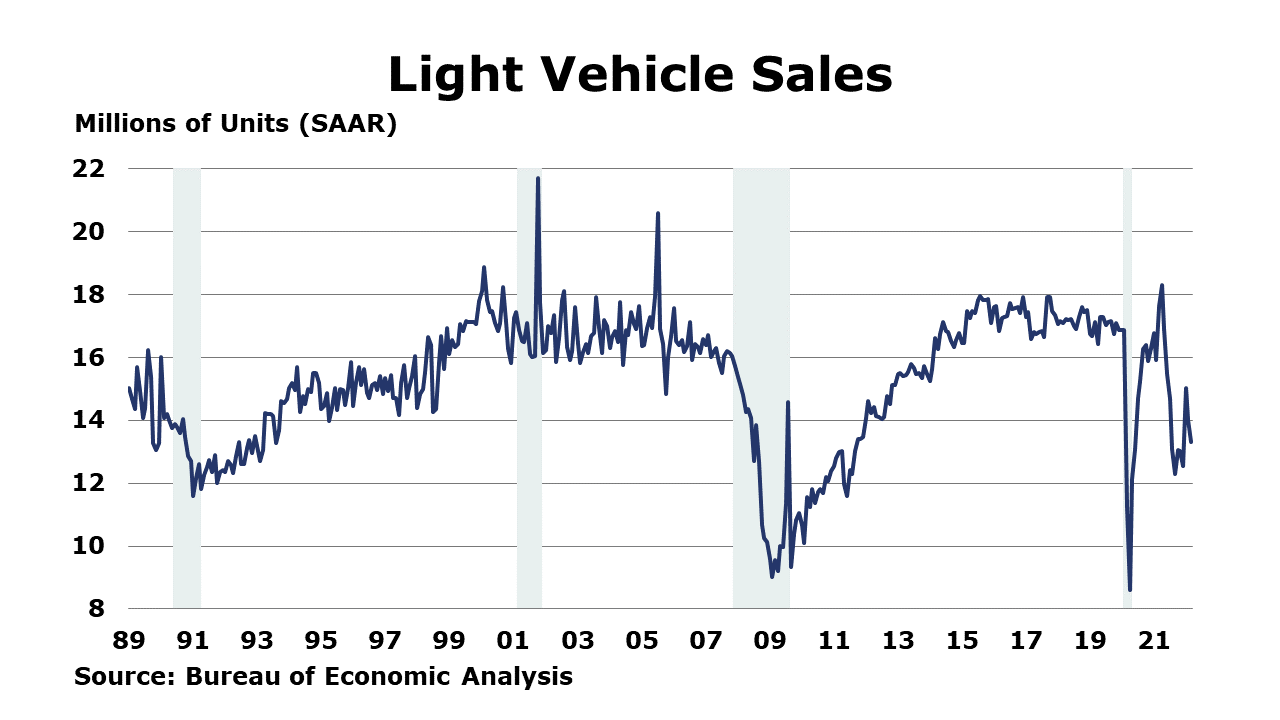
As supply chain challenges are still creating headaches for automakers, light vehicle sales continued to move lower in March falling to 13.3 million seasonally adjusted annual average (SAAR).
The U.S. trade deficit in goods and services tightened slightly (by less than $0.1 billion) to $89.2 billion in February as exports increased by 1.8% and imports increased 1.3%. Exports of goods increased in February reflecting increases in pharmaceuticals and fuel oil offset by decreases in civilian aircraft. Exports of services also rose in February, reflecting an increase in travel. Goods imports rose with higher imports of crude oil, fuel oil, and other petroleum products; imports of passenger cars, however, fell. Imports of services rose, with half of the increase attributable to increased charges for the use of intellectual property.
The ISM Services PMI rose 1.8 points to 58.3 in March, signaling that the services sector expanded at a faster pace. Seventeen of 18 industries reported growth, with the only decline noted in agriculture, forestry, fishing, and hunting. Supplier deliveries slowed 2.8% compared to February. Prices continued to rise at a faster rate. One respondent noted that chemical deliveries are increasingly delayed due to lack of qualified hazardous materials drivers.
Following nine consecutive months of gains, factory orders fell 0.5% in February. The reading was in line with expectations. Declines in orders for consumer durables, information technology, construction materials, and construction supplies were offset by higher orders for consumer nondurables (including petroleum products), defense capital goods, and computers and related equipment. Core business orders edged lower by 0.2%. An indicator of the manufacturing pipeline, unfilled orders continued to expand, up by 0.4%. Shipments, up 21 of the past 22 months, continued to gain, up 1.4%. Inventories also continued to build for a 13th consecutive month, up by 0.5%. At 1.45, the inventories-to-sales ratio remained steady compared to January.
Wholesale inventories rose 2.5% by the end of February and were 19.9% higher than levels in February 2021. At the wholesale level, auto inventories were drawn down in February as were electrical products and hardware. During the same period, inventories of furniture, lumber, professional products including computer equipment, and machinery increased. Wholesale sales were up 1.7% in February and were 25.5% higher than a year earlier. The inventories-to-sales ratio rose to 1.21 in February, up from 1.20 in January and lower than the February 2021 level of 1.27.
The JP Morgan Global Manufacturing PMI fell to an 18-month low in March, down by 0.7 points to 53.0. The reading, above 50, suggests continued expansion in global manufacturing, but at a slower pace than in February. National PMI readings were above the neutral 50.0 mark in 23 of 30 countries. Advanced economies in Europe and North America posted the highest PMIs while PMIs signaled contraction in Russia, Turkey, China, Mexico, Myanmar, Kazakhstan, and Malaysia. Global supply chains remained stretched during March, highlighted by a further marked lengthening of average supplier lead times. The extent of the increase in delivery times remained among the steepest in the survey history and was also slightly more marked than in the prior month.
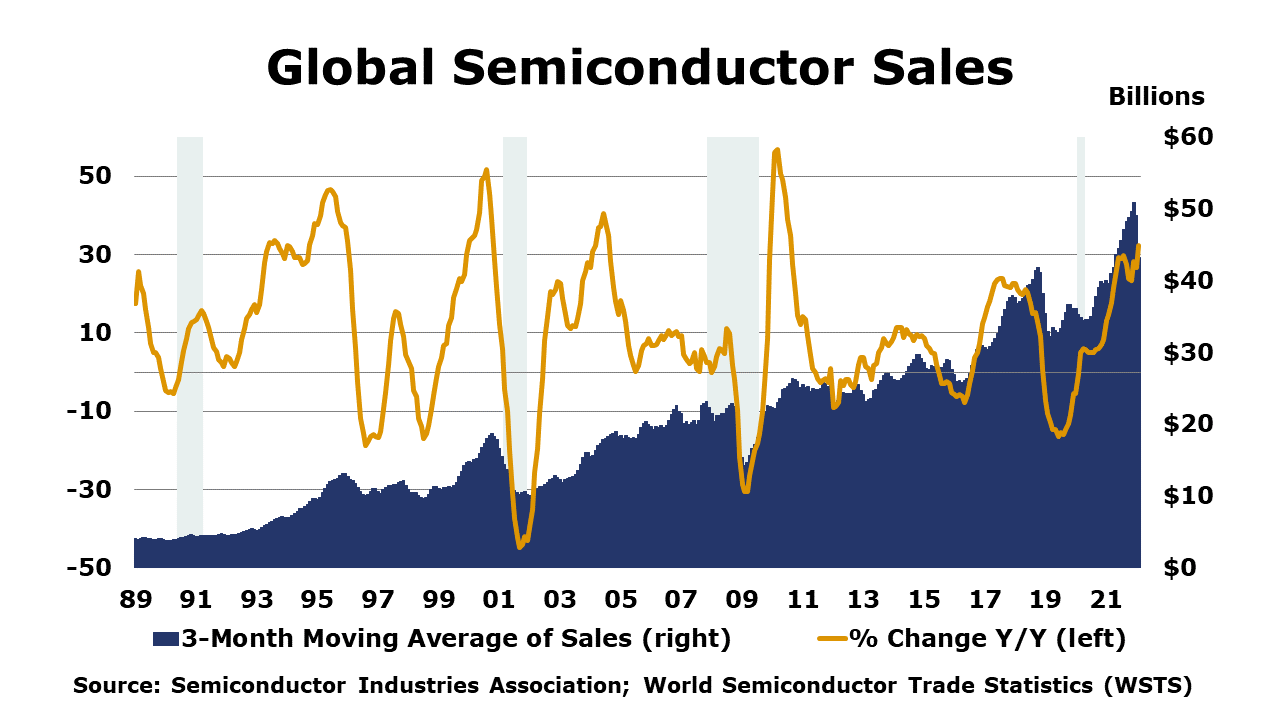
Global semiconductor sales rose 3.4% in February with gains in Asia Pacific and Europe but fell slightly in China, Japan, and other Asia, as well as the Americas. Compared to year ago, global semiconductor sales were up 32.4% Y/Y (>20% for the 11th consecutive month) with the largest gains in the Americas and Europe.
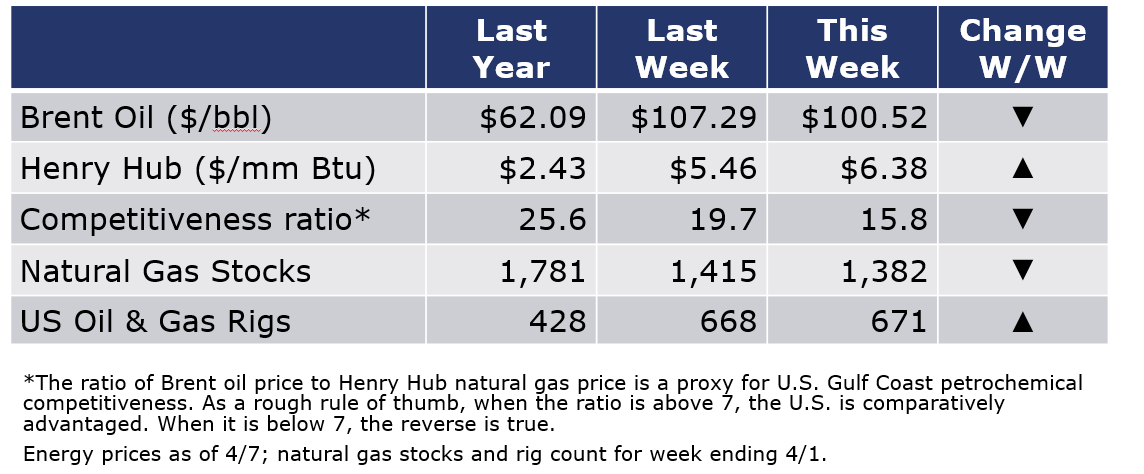
Despite the prospect of more sanctions on Russia related to war crime accusations, oil prices eased during the past week, closing yesterday at just above $100 on news of additional unprecedented reserve releases and a boost in commercial U.S. inventories. Natural gas prices continued to move higher on continued concerns that U.S. production gains are not keeping pace with increased demand. The combined oil and gas rig count rose by three to 671 during the week ending 1 April.
For the business of chemistry, the indicators still bring to mind a green banner for basic and specialty chemicals.
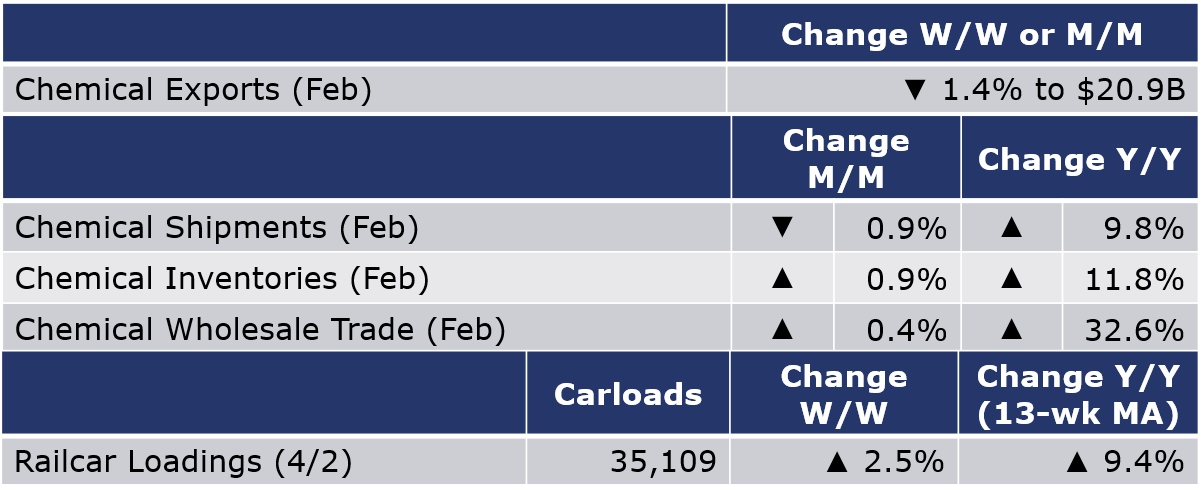
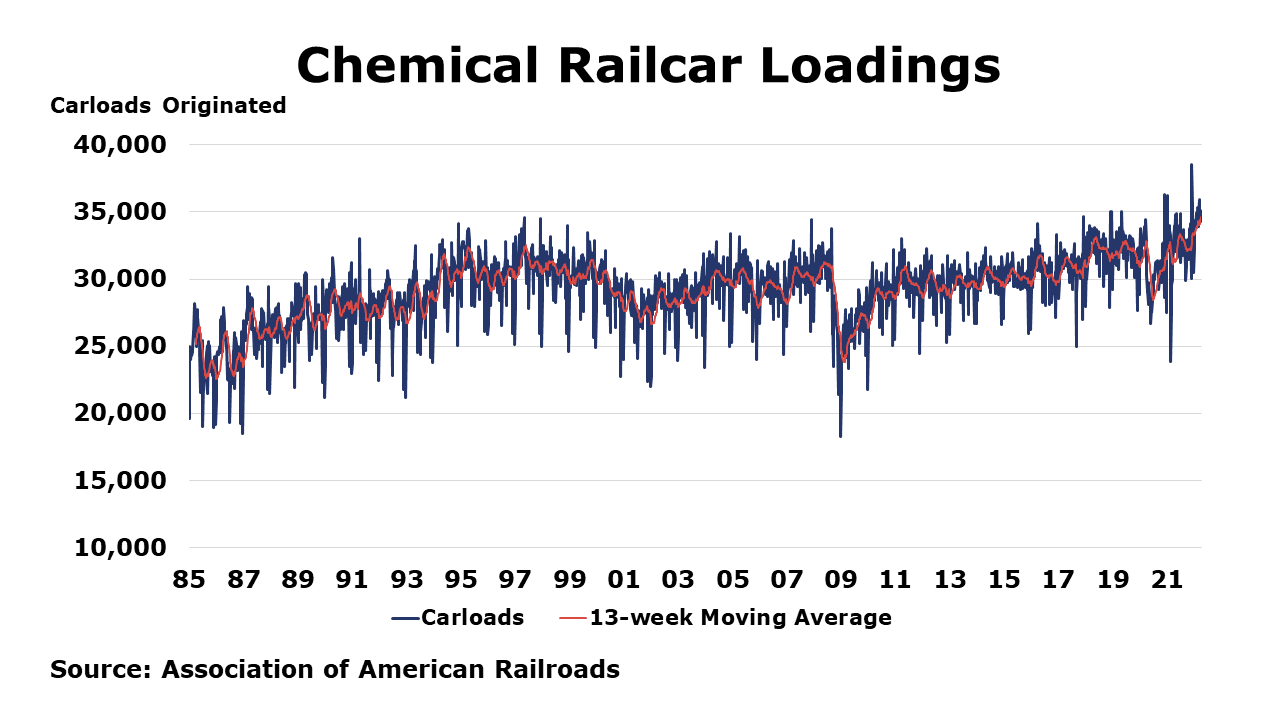
According to data released by the Association of American Railroads, chemical railcar loadings were up by 2.5% (845 carloads) for the week ending 2 April. Loadings were up 9.4% Y/Y (13-week MA), up (9.7%) YTD/YTD and have been on the rise for nine of the last 13 weeks. At 35,582, the 13-week trend in chemical railcar loadings is at an all-time high.
Chemical exports (excluding pharma) were down 1.4% in February but up 25.9% Y/Y driven by a rise in petrochemicals and resin exports. Chemical imports fell 10.0% in February but were up 39.2% Y/Y driven by gains in all major categories, with particularly strong gains in agricultural chemicals and plastic resins. The monthly trade surplus grew to $2.5 billion.
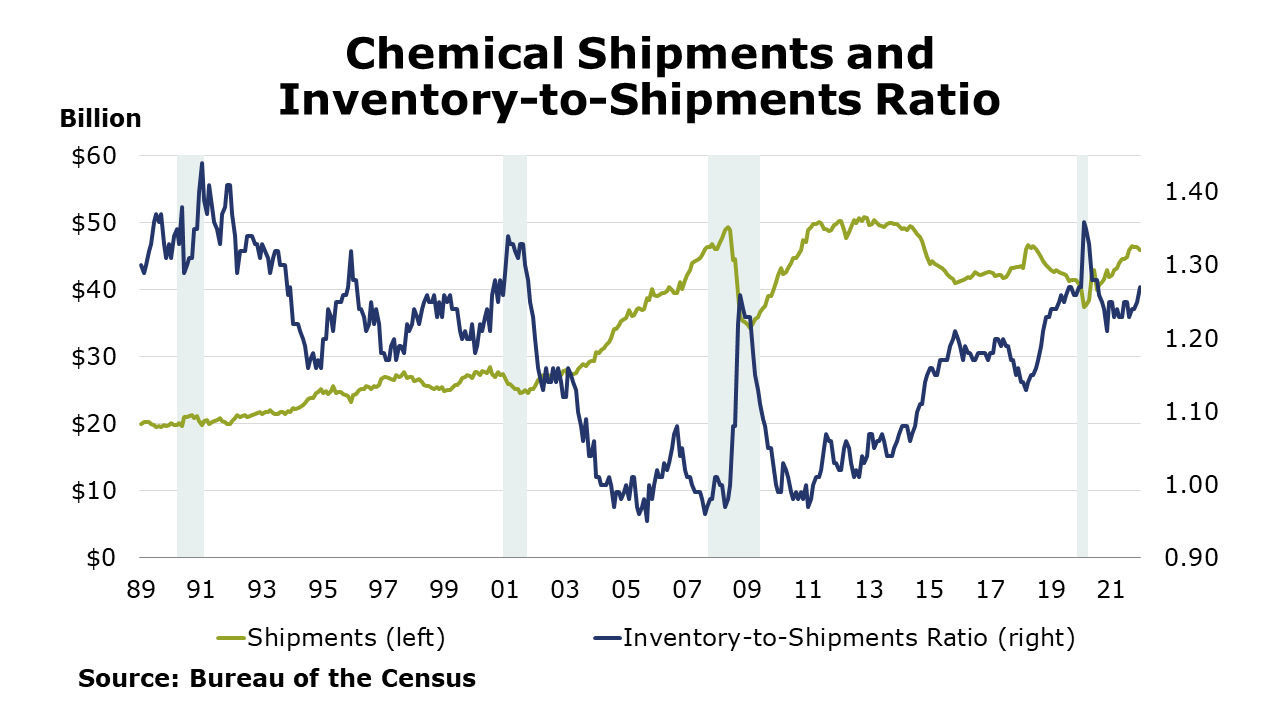
Following flat growth in January, chemical shipments eased in February, off by 0.9% with declines across all major segments. Chemical inventories rose, however, by 0.9%, the second consecutive increase. Inventories rose along all segments with the largest growth in coatings and adhesives. Compared to a year ago (when winter storm Uri disrupted activity), shipments were up 9.8% while inventories were ahead by 11.8% Y/Y. The inventories-to-shipments ratio rose from 1.25 in January to 1.27 in February.
Wholesale chemical inventories rose 3.4% by the end of February to $15.1 billion, a level up 22.7% Y/Y. Wholesale sales were up 0.4% in February to $13.7 billion, a level 32.6% higher than a year before. The inventories-to-sales ratio increased to 1.11 in February from 1.07 in January and was down from 1.19 a year earlier.
Note On the Color Codes
The banner colors represent observations about the current conditions in the overall economy and the business chemistry. For the overall economy we keep a running tab of 20 indicators. The banner color for the macroeconomic section is determined as follows:
Green – 13 or more positives
Yellow – between 8 and 12 positives
Red – 7 or fewer positives
For the chemical industry there are fewer indicators available. As a result we rely upon judgment whether production in the industry (defined as chemicals excluding pharmaceuticals) has increased or decreased three consecutive months.
For More Information
ACC members can access additional data, economic analyses, presentations, outlooks, and weekly economic updates through MemberExchange.
In addition to this weekly report, ACC offers numerous other economic data that cover worldwide production, trade, shipments, inventories, price indices, energy, employment, investment, R&D, EH&S, financial performance measures, macroeconomic data, plus much more. To order, visit https://store.americanchemistry.com/.
Every effort has been made in the preparation of this weekly report to provide the best available information and analysis. However, neither the American Chemistry Council, nor any of its employees, agents or other assigns makes any warranty, expressed or implied, or assumes any liability or responsibility for any use, or the results of such use, of any information or data disclosed in this material.
Contact us at ACC_EconomicsDepartment@americanchemistry.com


