Running tab of macro indicators: 9 out of 20
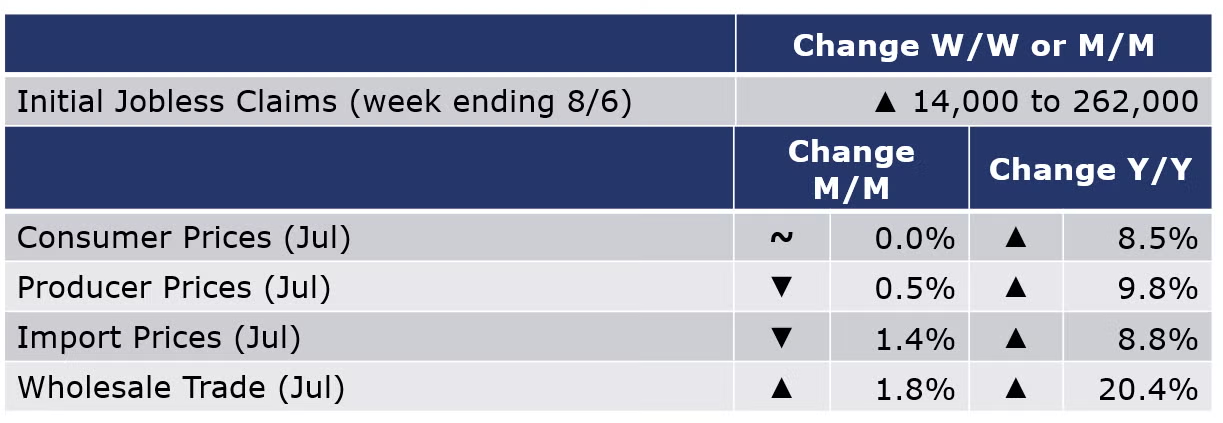
The number of new jobless claims rose by 14,000 to 262,000 during the week ending 6 August. Continuing claims increased by 8,000 to 1.43 million, and the insured unemployment rate for the week ending 31 July was unchanged at 1.0%.
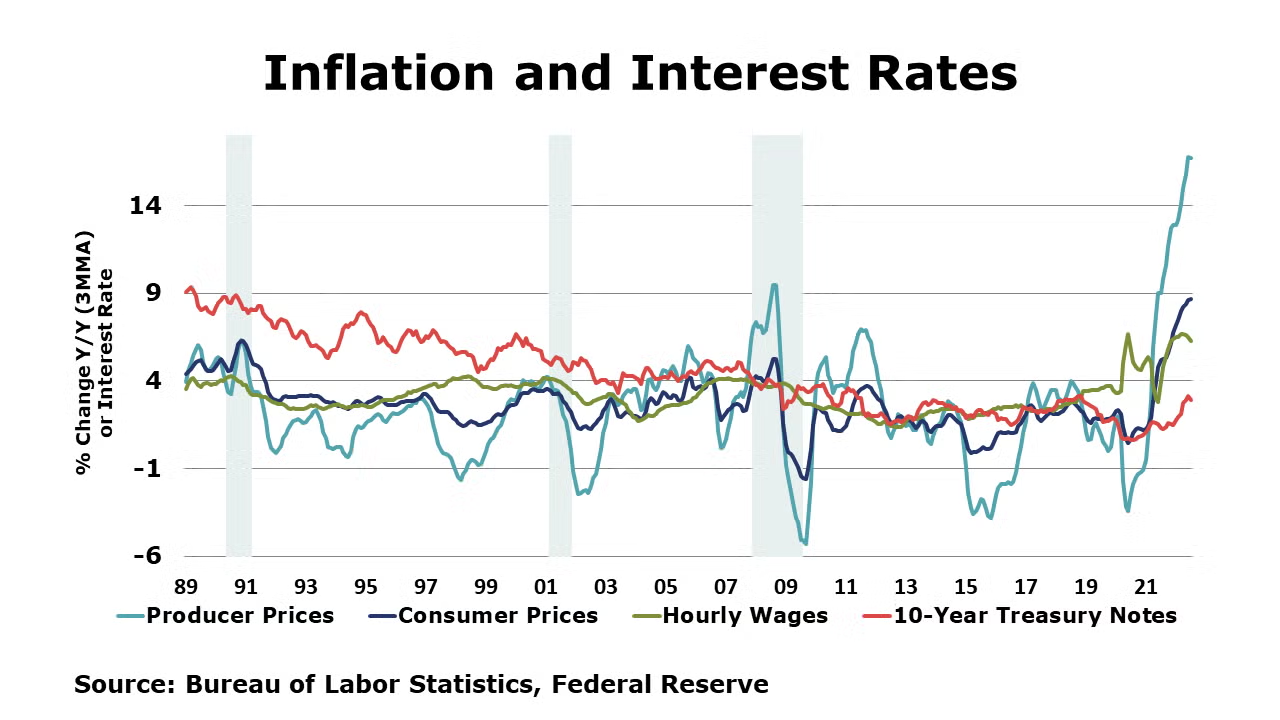
Consumer prices remain unchanged in July after a 1.3% gain from June, suggesting some cooling in inflation. Gasoline prices fell 7.7% to offset increases in food and shelter. Core consumer prices were up 0.3% in July, following 0.7% gain in June. Of the major component indexes, the largest contributors were the indexes for electricity (1.6%) and food (1.3%). Compared to a year ago, headline consumer prices were up 8.5% Y/Y while core prices were up by 5.9% Y/Y.
Producer prices fell 0.5% in July, the first sequential decline since April 2020. The decline was led by a drop in prices for energy. Eighty percent of the July decline in the index for final demand goods was attributable to lower gasoline prices. Partially offsetting the decline in energy goods, prices for food, core goods and services continued to rise. Core goods prices rose by 0.2%, the slowest gain in ten months. Compared to a year ago, producer prices were up 9.8% (the lowest Y/Y comparison since last October). The annual pace of core producer prices continued to ease at 5.8% Y/Y (having peaked at 7.1% Y/Y in March).
Import prices fell 1.4% in July following a 0.3% gain in June. Both fuel and nonfuel prices contributed to the decline in U.S. import prices in July. July’s month-over-month decline was the first since December and the largest drop since the index fell 2.6% in April 2020. U.S. import prices rose 8.8% over the past 12 months, the smallest over-the-year increase since the index advanced 7.1% from March 2020 to March 2021.
Wholesale trade continued to expand in June, up by 1.8%. The largest gains were in petroleum products (reflecting both higher prices and sharply higher travel demand) and farm products. Sales at the wholesale level were also higher for automotive and machinery businesses. Wholesale inventories rose by 1.8% with gains across all major categories, except farm products. Compared to a year ago, sales were up 20.4% Y/Y while inventories were up 25.5% Y/Y. The inventories-to-sales ratio remained steady at 1.26, but was up compared to June 2021 when it was 1.21.
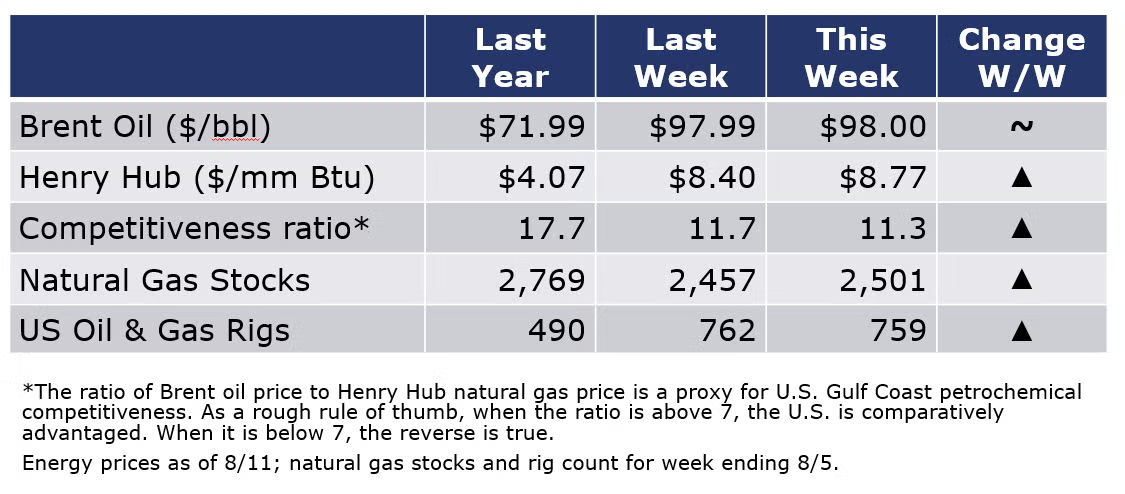
In its recent Short-Term Energy Outlook, EIA expects record electricity production this year due to rising economic activity and hot summer weather, boosting demand for natural gas. In 2023, EIA expects electricity consumption to ease slightly, and increasing generation from renewables will lower demand for natural gas. The combined oil and gas rig count eased by three to 759 during the week ending 8/5.
For the business of chemistry, the indicators still bring to mind a yellow banner for basic and specialty chemicals.
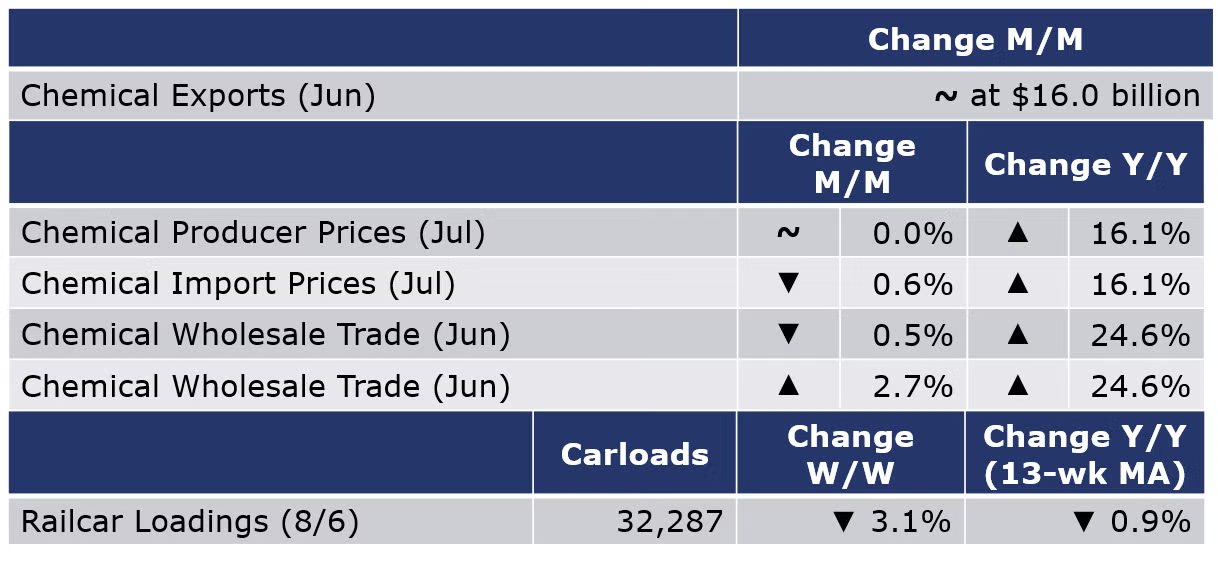
U.S. chemicals trade was up in June with exports rising and imports falling. Exports were up 2.3% during June with gains across all categories except specialties and agricultural chemicals. Imports were down (-4.6%) across most categories; coatings, consumer products and inorganic chemicals rose. Year-to-date comparisons for 2022 versus 2021 remain very strong with chemical exports up 22% and imports up 33%.
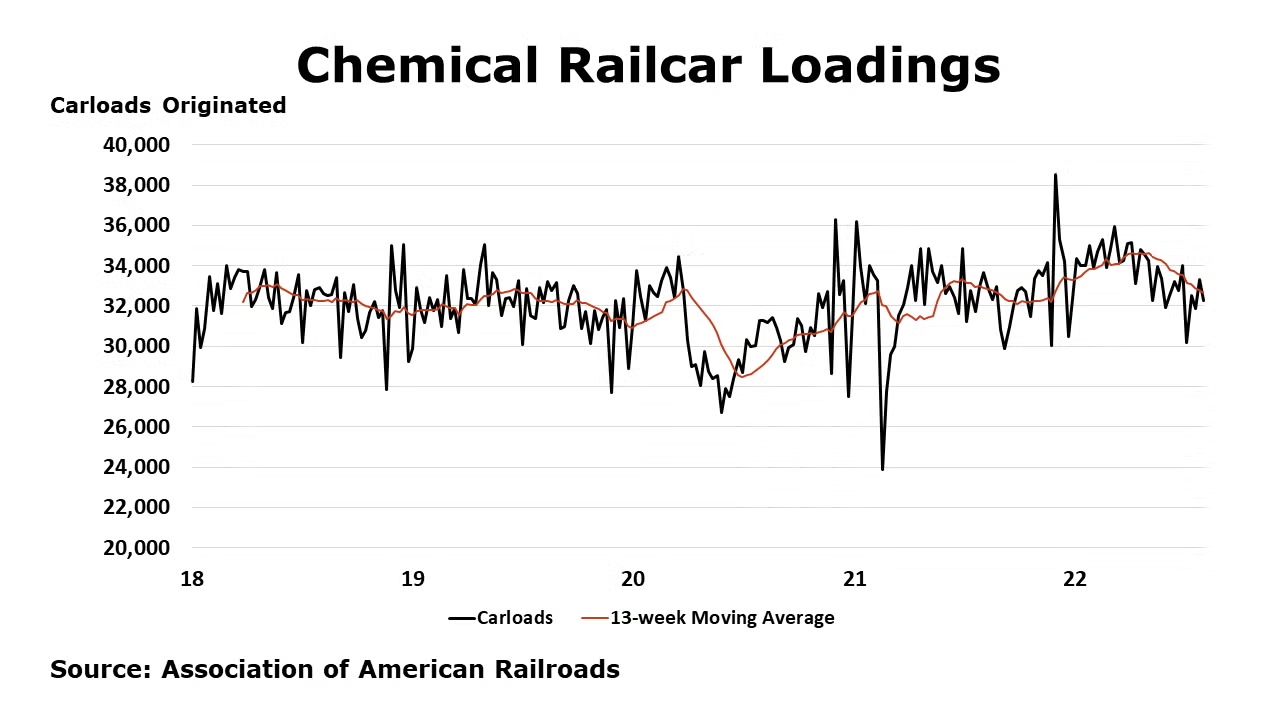
According to data released by the Association of American Railroads, chemical railcar loadings fell 3.1% to 32,287 during the week ending 6 August. Loadings were lower by 0.9% Y/Y (13-week MA), up (3.9%) YTD/YTD and have been on the rise for 6 of the last 13 weeks.
Following more than two years of monthly gains, chemical producer prices were flat in July. Gains in prices for inorganic chemicals, synthetic rubber, manufactured fibers, coatings, and consumer products were offset by lower prices for agricultural chemicals, petrochemicals & organic chemicals, plastic resins, and other specialty chemicals. Feedstock prices were lower for a second consecutive month. Compared to a year ago, chemical prices were up 16.1% Y/Y with gains across all segments. Chemical import prices fell by 0.6% in July and were up 16.1% Y/Y.
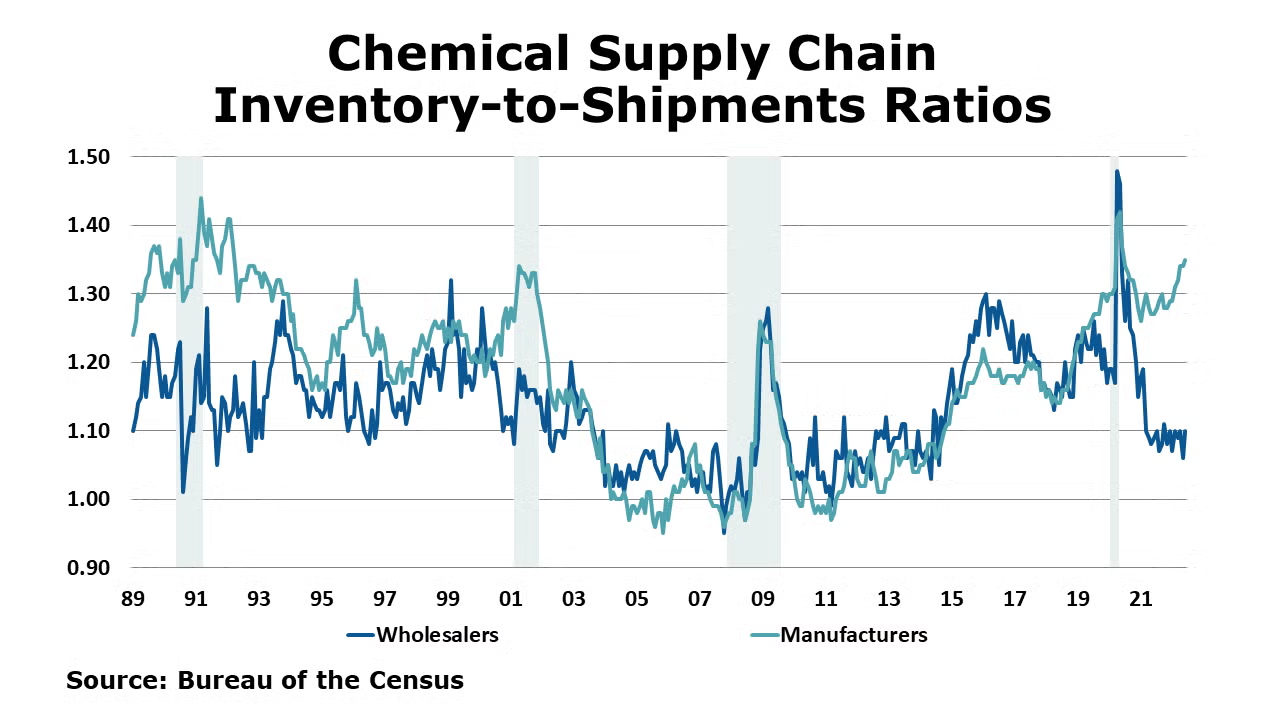
Wholesale trade in chemicals fell by 0.5% in June, the largest monthly decline since August 2020. Wholesale inventories of chemicals, however, rose 2.7%. Compared to a year ago, both sales and inventories were up by 24.6% Y/Y. The inventories-to-sales ratio jumped from 1.06 in May to 1.10 in June, the same as it was in June 2021. While the ratio moved higher, it remains below its average between 2010-2019.
Note On the Color Codes
The banner colors represent observations about the current conditions in the overall economy and the business chemistry. For the overall economy we keep a running tab of 20 indicators. The banner color for the macroeconomic section is determined as follows:
Green – 13 or more positives
Yellow – between 8 and 12 positives
Red – 7 or fewer positives
For the chemical industry there are fewer indicators available. As a result we rely upon judgment whether production in the industry (defined as chemicals excluding pharmaceuticals) has increased or decreased three consecutive months.
For More Information
ACC members can access additional data, economic analyses, presentations, outlooks, and weekly economic updates through MemberExchange.
In addition to this weekly report, ACC offers numerous other economic data that cover worldwide production, trade, shipments, inventories, price indices, energy, employment, investment, R&D, EH&S, financial performance measures, macroeconomic data, plus much more. To order, visit https://store.americanchemistry.com/.
Every effort has been made in the preparation of this weekly report to provide the best available information and analysis. However, neither the American Chemistry Council, nor any of its employees, agents or other assigns makes any warranty, expressed or implied, or assumes any liability or responsibility for any use, or the results of such use, of any information or data disclosed in this material.
Contact us at ACC_EconomicsDepartment@americanchemistry.com

