Running tab of macro indicators: 16 out of 20
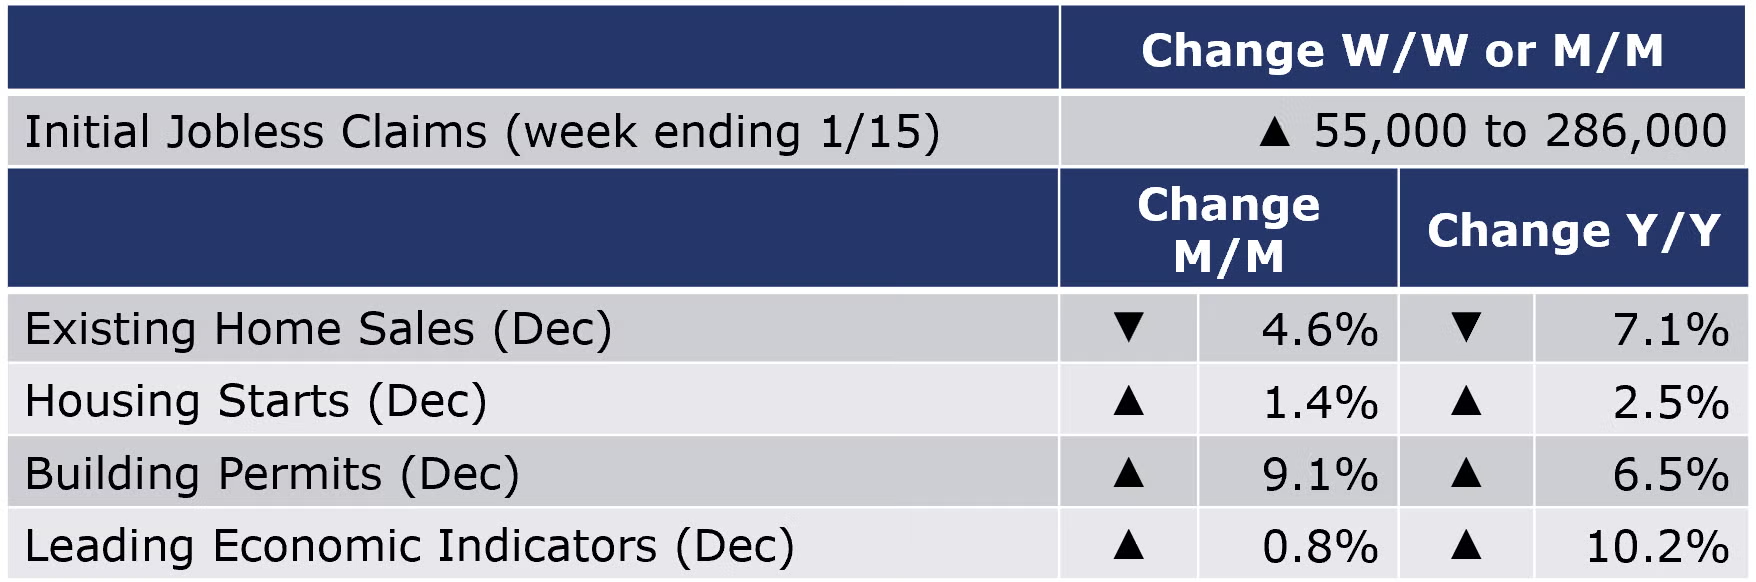
Rising to its highest level since October as Omicron spreads, the number of new jobless claims was up by 55,000 to 286,000 during the week ending 15 January. Continuing claims increased by 84,000 to 1.6 million, and the insured unemployment rate for the week ending 8 January was up 0.1 percentage points to 1.2%.
Despite ongoing labor and material shortages and a doubling of duties on imported softwood lumber from Canada, December housing starts rose 1.4% from November and were 2.5% higher than December 2020. Forward-looking building permits rose by 9.1% to a record high and were 6.5% above the December 2020 level. Separately, homebuilder sentiment slipped slightly in January (after 5 months of increases), as measured by the NAHB/Wells Fargo Housing Market Index (HMI).
Existing home sales dropped by 4.6% in December to a 6.18-million-unit annual pace, 7.1% lower than the 6.65-million-unit pace in December 2020. According to NAR, the pull-back reflects supply constraints more so than weakened demand. Inventories at the end of the month were off 18.0% from November (down 14.2% Y/Y) to a record low and represented a very lean 1.8-month supply at the current sales pace. The median sales price for existing homes was up 15.8% Y/Y.
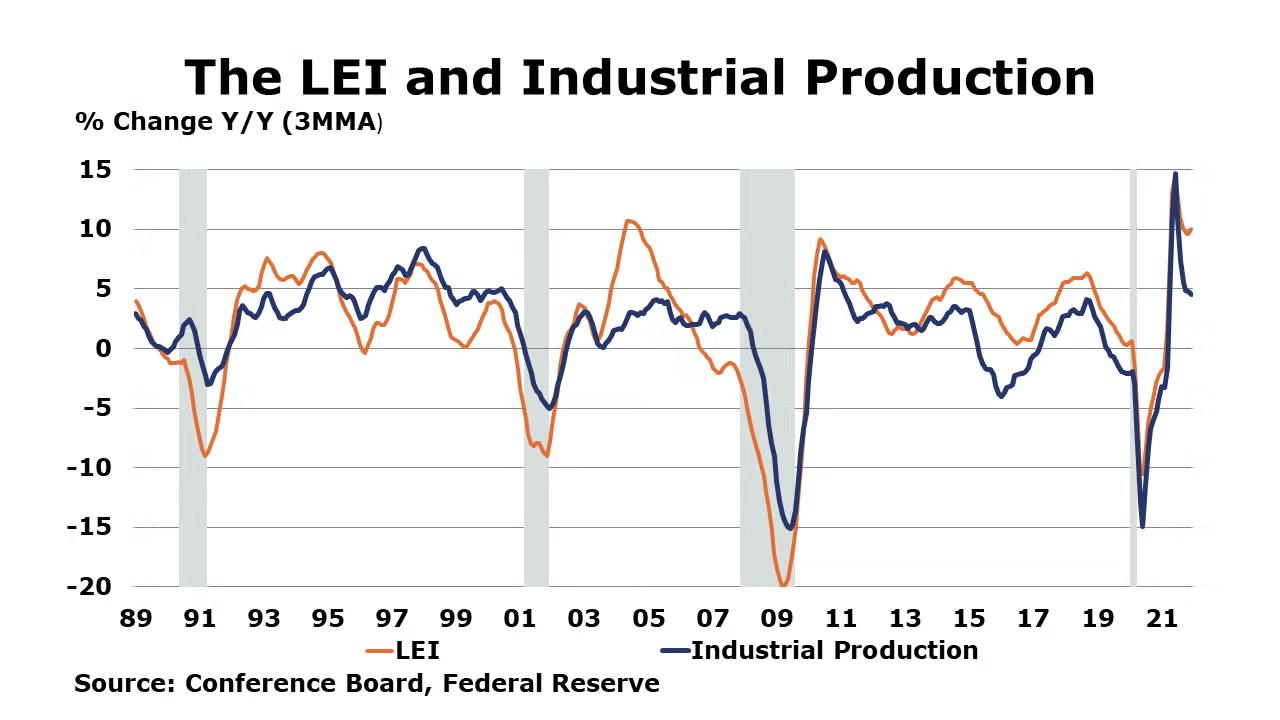
Suggesting momentum going into the new year, the Conference Board’s Index of Leading Economic Indicators (LEI) rose for a tenth consecutive month, up by 0.8% in December. Eight of 10 components increased in December, including jobless claims which fell to 50-year lows. Compared to a year ago, the LEI was up 10.2%.
SURVEY OF FORECASTERS
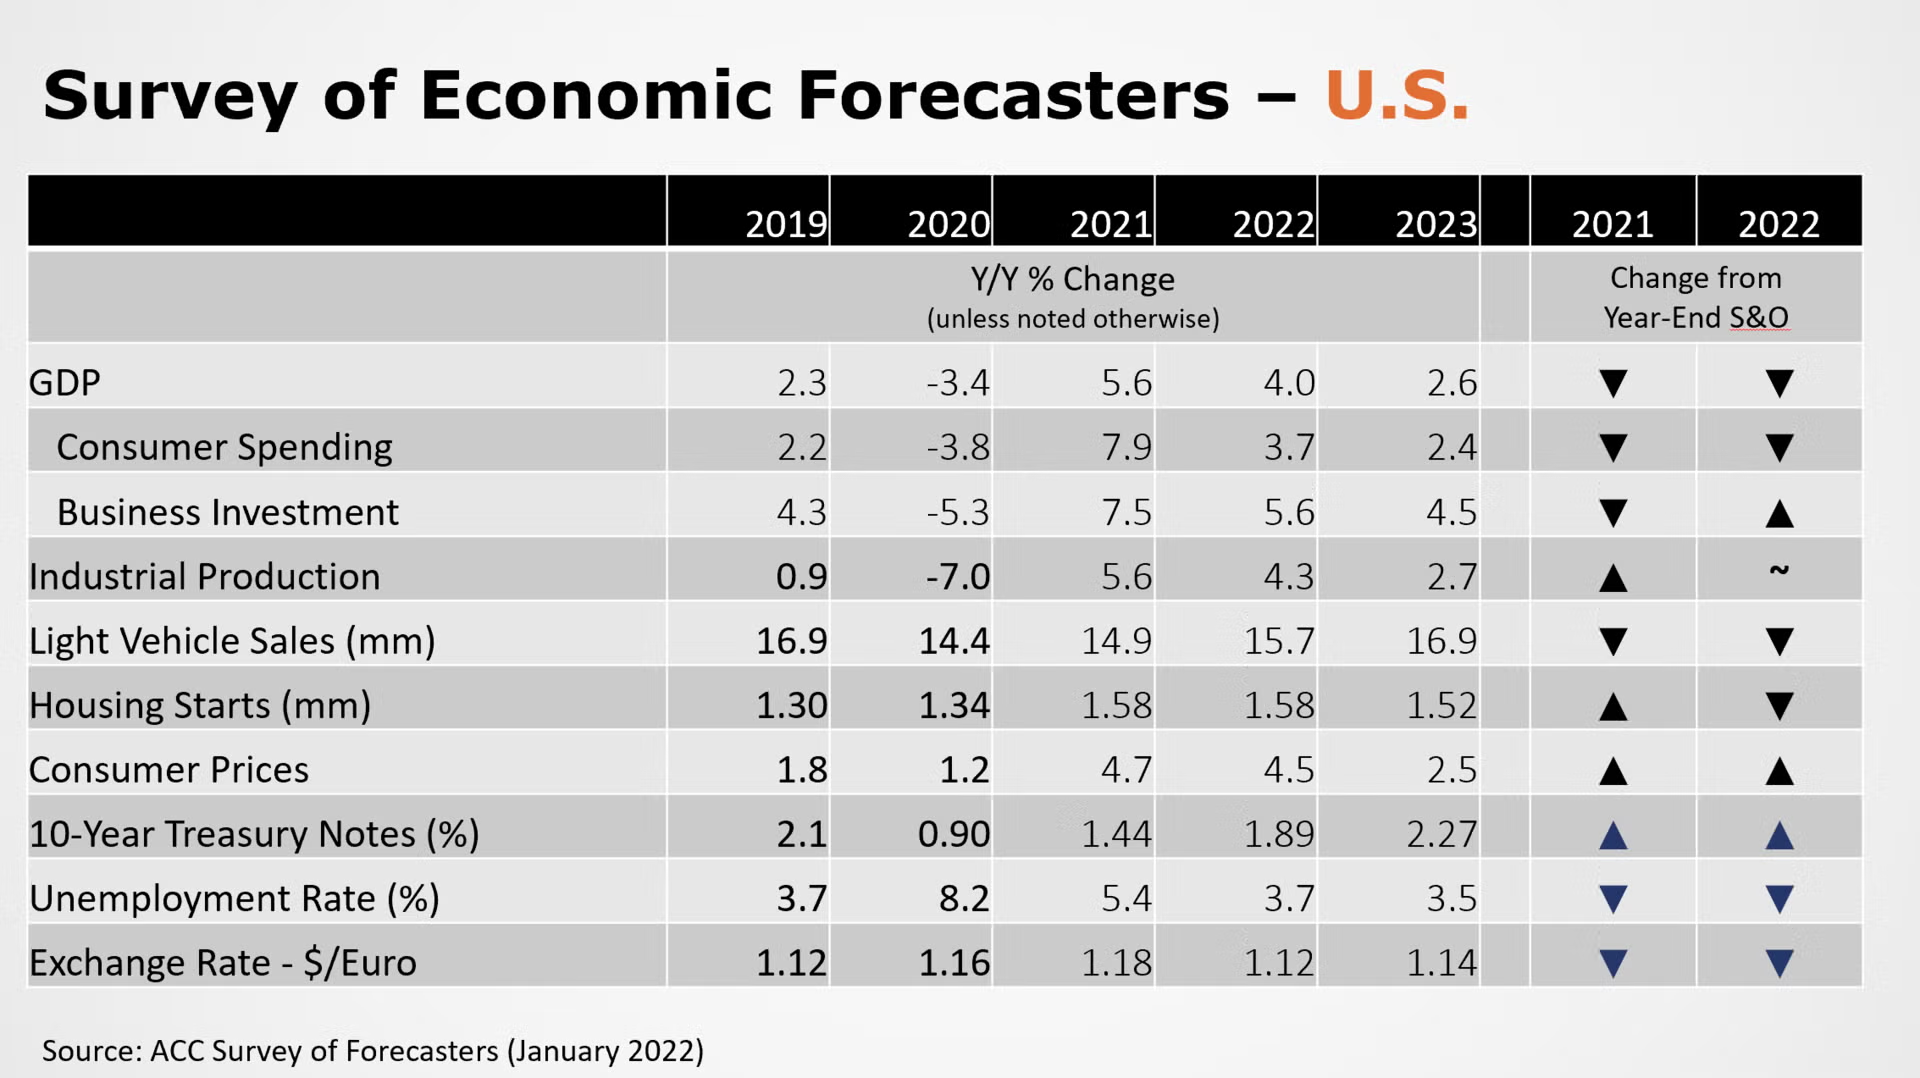
Omicron surged in the beginning of the new year exacerbating worker shortages, supply chain challenges and transportation disruptions. Expectations among ACC’s panel of forecasters remain positive for 2022, though growth expectations have been lowered compared to the outlook at the end of the year. The panel looks for further expansion into 2023.
- U.S. GDP is expected to grow by 4.0% in 2022 as supply chain disruptions and worker shortages take a toll in Q1. In 2023, U.S. GDP is expected to grow 2.6%, near its long-term trend.
- Industrial production, is expected to rise 4.3% in 2022 (higher than last month’s expectations, as disruptions to production from 2021 may be shifted forward) and 2.7% in 2023.
- Continued curtailments in auto production due to shortages of semiconductors and other components, expectations for light vehicle sales were lowered again to 15.7 million in 2022 and 16.9 million in 2023.
- Expectations for housing starts remained relatively steady at 1.58 million in 2022 and 1.52 million in 2023.
- The unemployment rate is expected to average 3.7% in 2022 and 3.5% in 2022.
- With persistent constraints on labor, supplies, and movement of goods, prices have continued to accelerate across the supply chain. Consumer prices are expected to grow by 4.5% in 2022 before returning to 2.7% 2023, as these constraints ease.
- Compared to last month, expectations for interest rates (10-year treasury) were slightly higher for 2022 and 2023.
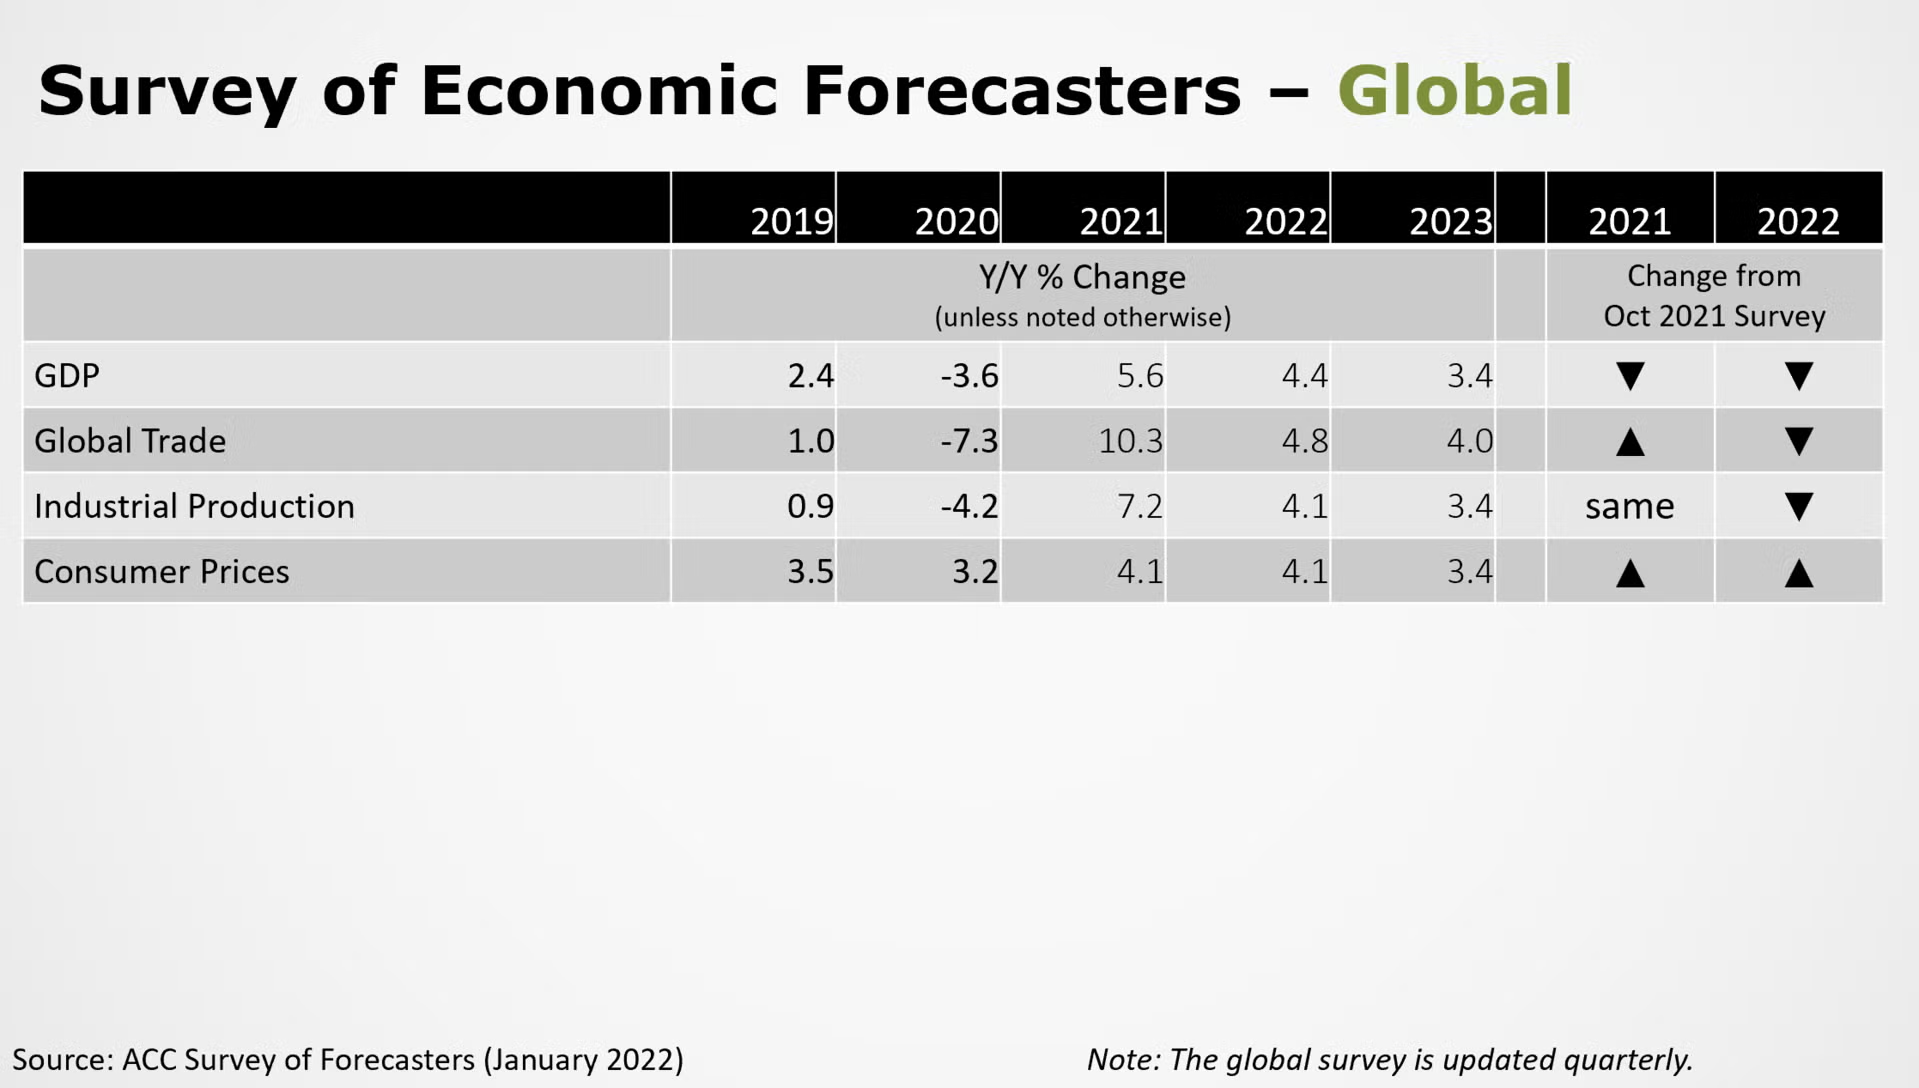
- Global economic output rebounded in 2021, growing by 5.6%, losing steam in the second half as COVID-19 variants and supply chain disruptions impacted economies broadly. In 2022, global GDP is expected to grow by 4.4%.
- Global trade, which fell by 7.3% in 2020 expanded by 10.3% in 2021, even in the face of logistical and distribution challenges. The outlook for global industrial output is for a 4.4% gain in 2022.
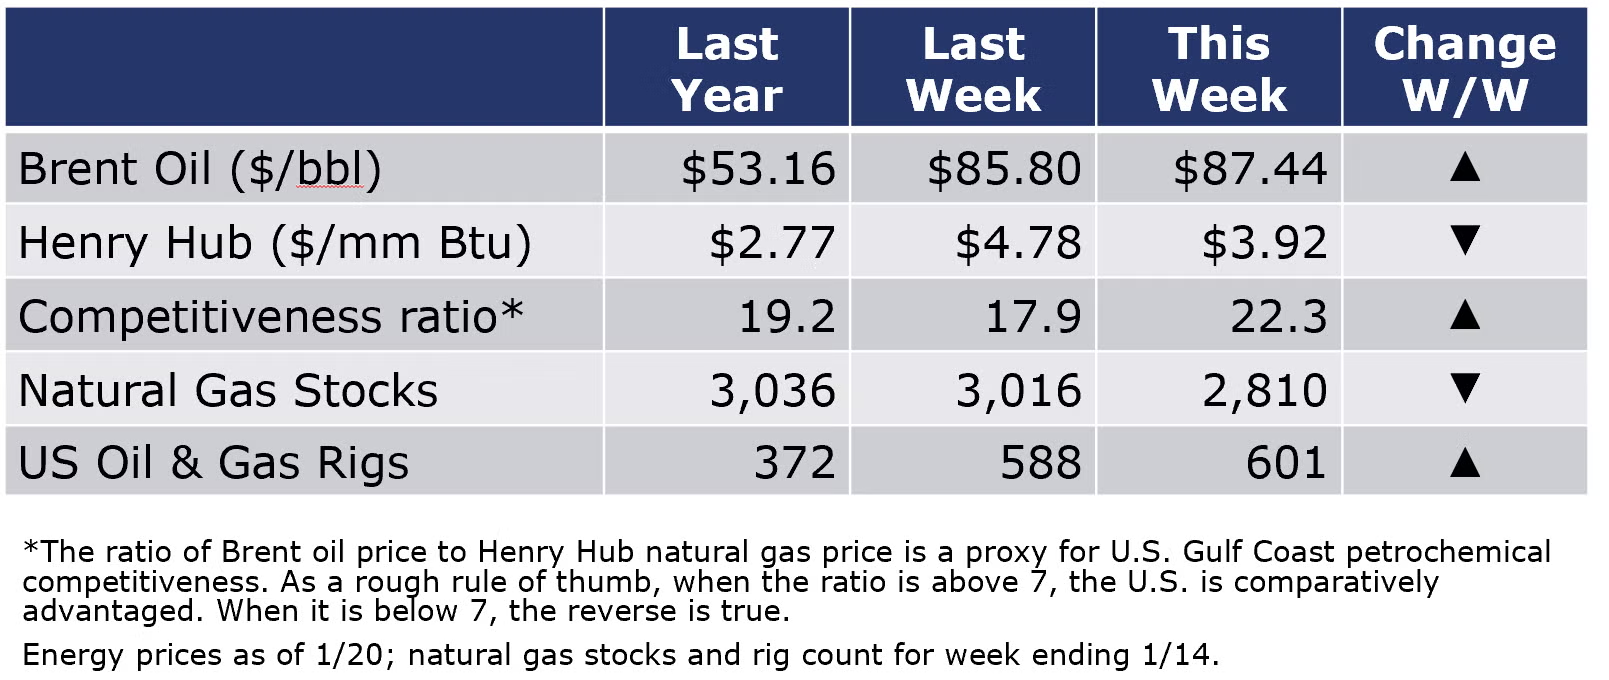
The combined oil and gas rig count rose by 13 to 601 during the week ending 14 January. Oil prices rose to the highest since 2014 amid a pipeline outage in Turkey and growing concerns about supply disruptions in Russia and the Middle East.
For the business of chemistry, the indicators still bring to mind a green banner for basic and specialty chemicals.
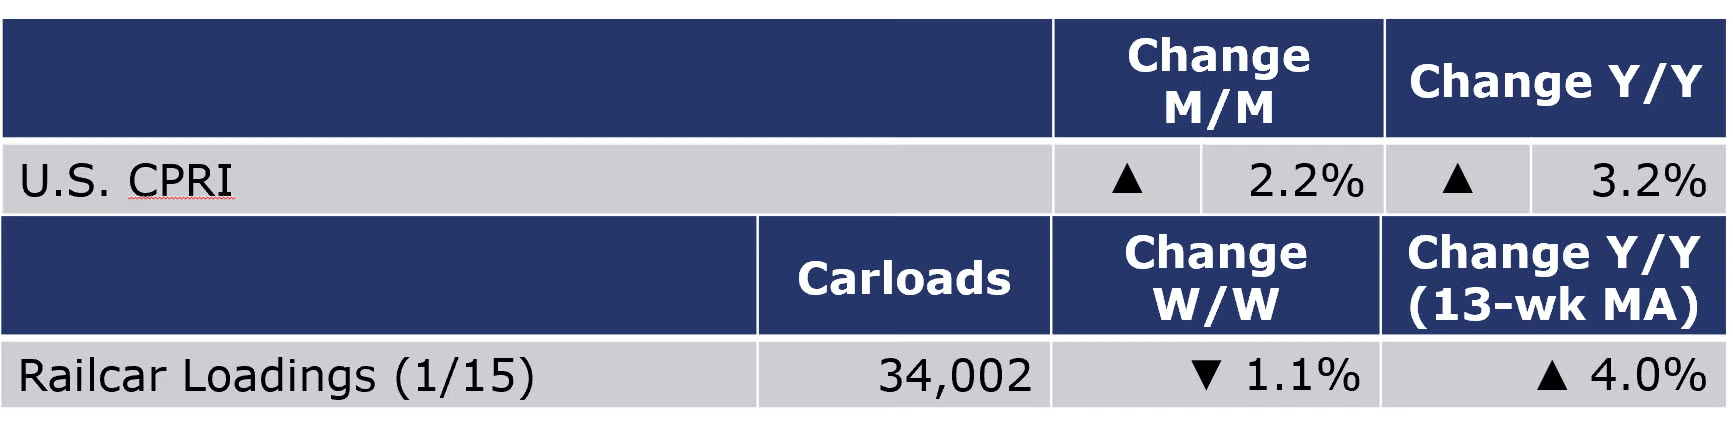
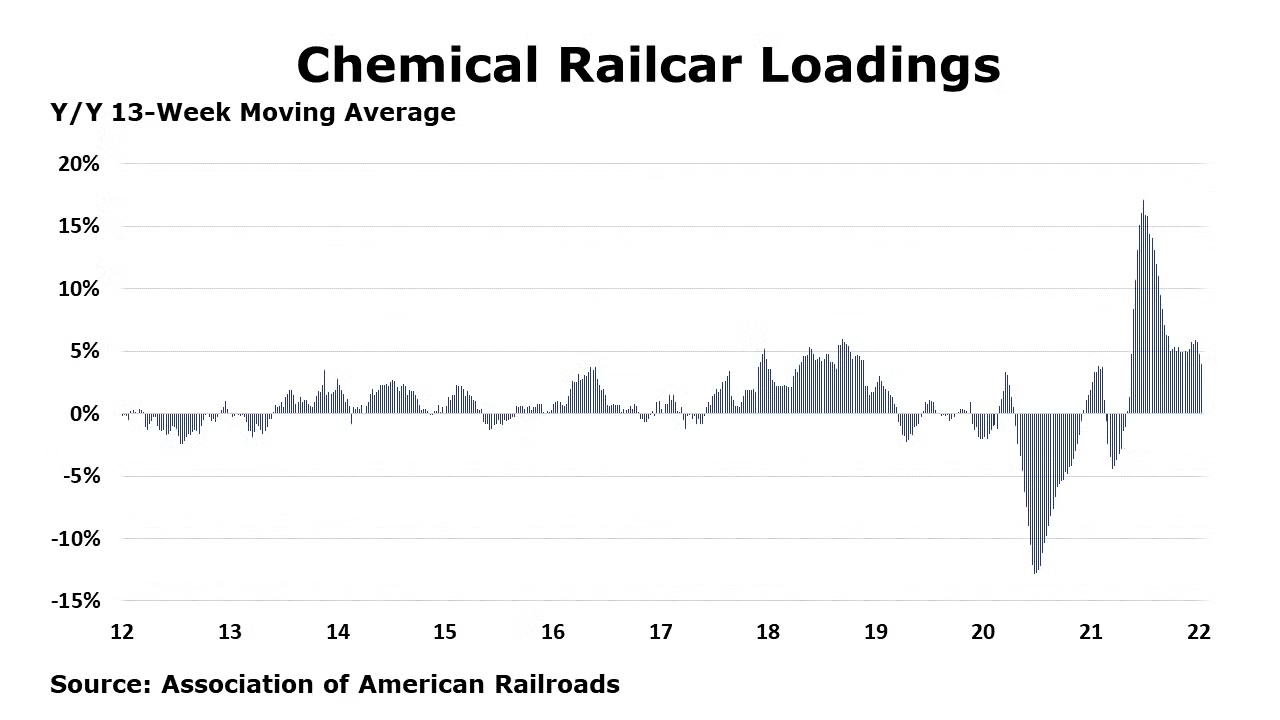
According to data released by the Association of American Railroads, chemical railcar loadings fell by 368 carloads to 34,002 for the week ending 15 January (week 3). Loadings were up 4.0% Y/Y (13-week MA), down 2.5% YTD/YTD and have been on the rise for 6 of the last 13 weeks.

The U.S. Chemical Production Regional Index (U.S. CPRI) expanded by 2.2% in December following a 0.8% gain in November and a 0.2% decline in October, according to the American Chemistry Council. Chemical output rose in all regions, with the largest gains in the Midwest and Gulf Coast regions. The U.S. CPRI is measured as a three-month moving average (3MMA). Compared with December 2020, U.S. chemical production was ahead by 3.2%, an improved comparison from last month. Chemical production continued to be higher than a year ago in all regions.
Chemical production was mixed in December (3MMA), with an improving trend in the production of coatings, adhesives, consumer products, crop protection, other specialty chemicals, organic chemicals synthetic rubber, manufactured fibers, plastic resins, basic inorganic chemicals, and synthetic dyed & pigments. These gains were offset by weakness in the output of industrial gases.
As nearly all manufactured goods are produced using chemistry in some form, manufacturing activity is an important indicator for chemical demand. Manufacturing output expanded for a sixth consecutive month in December, by 0.6% (3MMA). The 3MMA trend in manufacturing production was mixed, with gains in the output of food and beverages, appliances, motor vehicles, construction supplies, fabricated metal products, machinery, computers & electronics, semiconductors, refining, foundries, oil & gas extraction, rubber products, paper, printing, structural panels, textile mill products, and furniture.
Note On the Color Codes
The banner colors represent observations about the current conditions in the overall economy and the business chemistry. For the overall economy we keep a running tab of 20 indicators. The banner color for the macroeconomic section is determined as follows:
Green – 13 or more positives
Yellow – between 8 and 12 positives
Red – 7 or fewer positives
For the chemical industry there are fewer indicators available. As a result we rely upon judgment whether production in the industry (defined as chemicals excluding pharmaceuticals) has increased or decreased three consecutive months.
For More Information
ACC members can access additional data, economic analyses, presentations, outlooks, and weekly economic updates through MemberExchange.
In addition to this weekly report, ACC offers numerous other economic data that cover worldwide production, trade, shipments, inventories, price indices, energy, employment, investment, R&D, EH&S, financial performance measures, macroeconomic data, plus much more. To order, visit http://store.americanchemistry.com/.
Every effort has been made in the preparation of this weekly report to provide the best available information and analysis. However, neither the American Chemistry Council, nor any of its employees, agents or other assigns makes any warranty, expressed or implied, or assumes any liability or responsibility for any use, or the results of such use, of any information or data disclosed in this material.
Contact us at ACC_EconomicsDepartment@americanchemistry.com