Running tab of macro indicators: 11 out of 20

The number of new jobless claims rose by 27,000 to 229,000 during the week ending 4 June. For the week ending 21 May, continued claims fell by nearly 36,000 to 1.283 million, the lowest level since December 27, 1969. The insured unemployment rate for the week ending May 28 was 0.9%, same as the prior week.
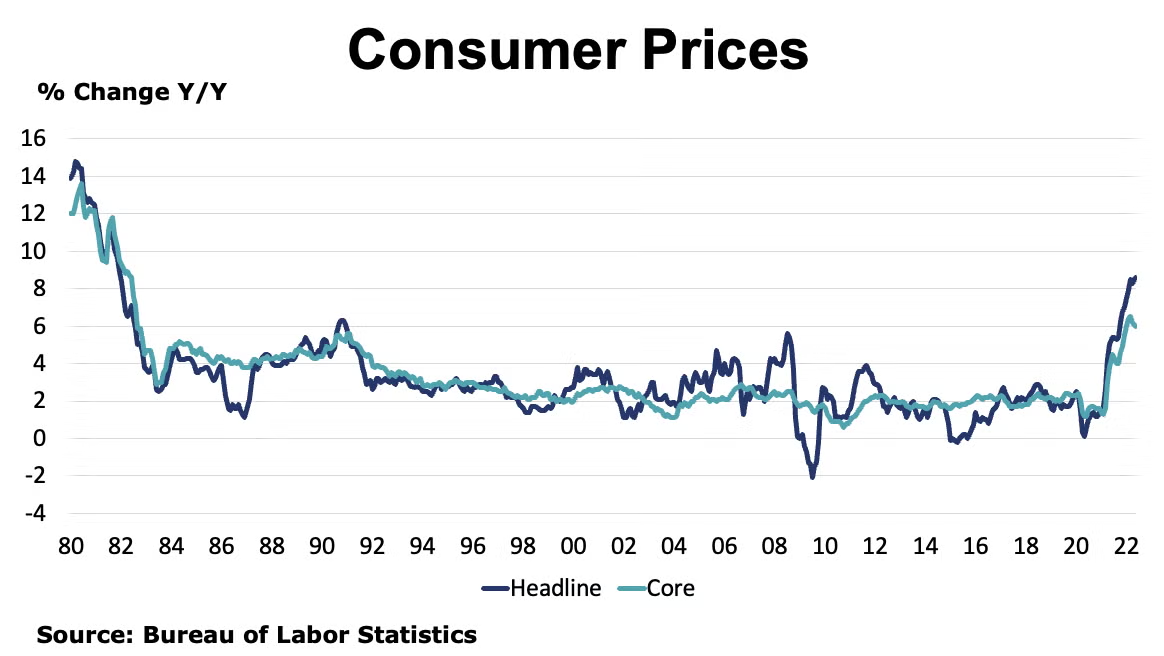
Consumer prices continued to accelerate in May, up 1.0%, and following a 0.3% gain in April. Last month’s gain was largely led by higher prices for energy, related to energy market dislocations following the Russian invasion of Ukraine. Higher prices for food and shelter also contributed to the gain. Excluding the volatile food and energy components, core consumer prices were up 0.6%, the same as in April. While all major categories saw increases, the largest contributors included shelter, airline fares, used cars and trucks, and new vehicles. Compared to a year ago, headline consumer prices were up 8.6% Y/Y and core prices were up by 6.0% Y/Y, an improvement.
The U.S. trade deficit narrowed to $87 billion as exports rose and imports declined month/month in April. Exports were up 3.5% to $253 billion while imports declined 3.4% to $340 billion. Exports of goods increased driven by higher exports of industrial supplies and materials (including natural gas and other petroleum products), soybeans, and civilian aircraft. The decline in imported goods reflects lower imports of consumer goods, industrial supplies and materials, capital goods. Imports from China, the largest source of U.S. imported goods, were down notably in April reflecting shutdowns that have slowed their industrial sector and disrupted supply chains.
Sales at the wholesale level continued to expand in April, up by 0.7%. The largest gains were in furniture, electrical, and farm products. Computer equipment and apparel registered the largest declines. Wholesale inventories also continued to expand by 2.2%. Compared to a year ago, wholesale sales were up 20.9% while inventories were ahead by 24.0% Y/Y. The inventories-to-shipments ratio rose to 1.25 in April from 1.23 in March.
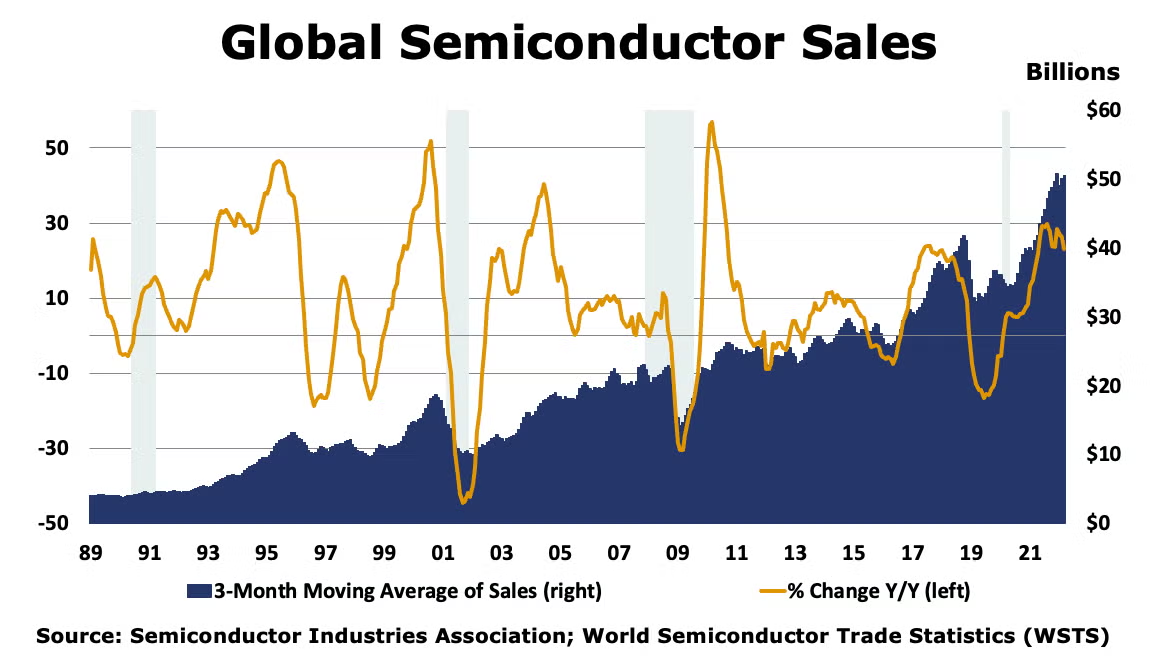
Global semiconductor sales rose 0.7% to $50.9 billion during April. Sales in Europe and China fell, but rose in other regions, with the largest gains in the Americas. Compared to a year ago, sales were up 21.1% Y/Y.
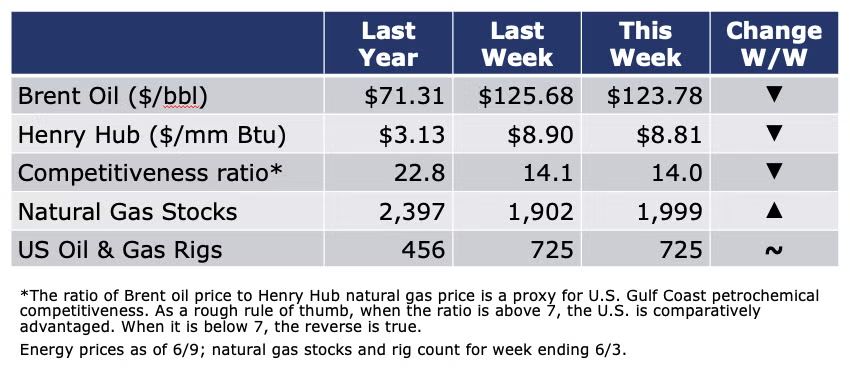
Energy prices continue to be high and volatile. Oil prices eased somewhat on a larger-than-expected inventory build. Gas prices also eased slightly as a fire at an LNG facility in Texas (that accounts for 20% of U.S. LNG exports) took some export capacity offline. Natural gas prices remained under pressure, however, as inventories remain nearly 15% below average as demand for summer air-conditioning (and natural gas consumption for electric power) ramps up. The oil and gas rig count was stable at 725 during the week ending 3 June.
For the business of chemistry, the indicators still bring to mind a green banner for basic and specialty chemicals.
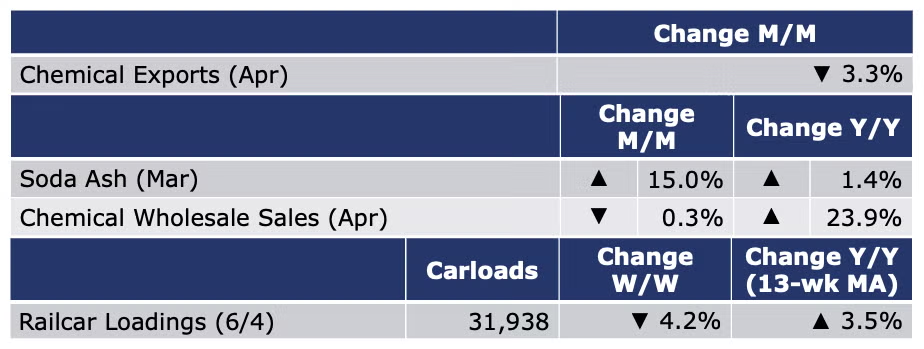
According to data released by the Association of American Railroads, chemical railcar loadings were down 4.2% for the week ending 4 June (which included the Memorial Day holiday). Loadings were up 3.5% Y/Y (13-week MA), up 5.7% YTD/YTD and have been on the rise for 6 of the last 13 weeks.
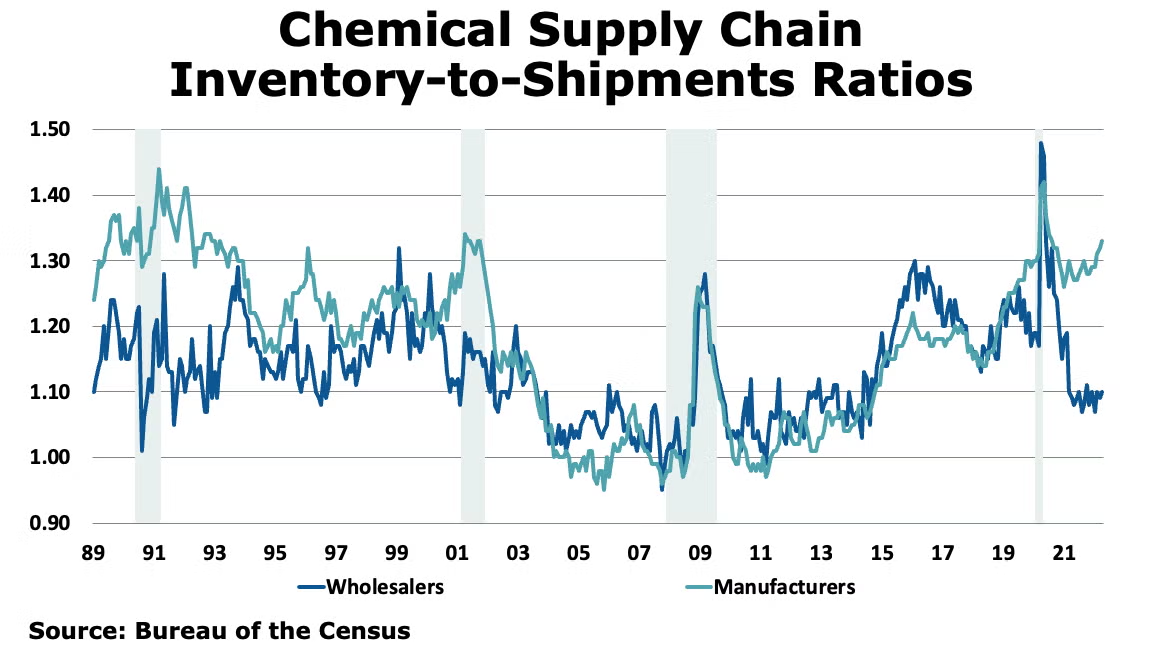
Following a 3.4% gain in March, chemical wholesale trade declined by 0.3% in April. Chemical wholesale inventories rose by 0.8%, following a 2.8% gain in March. Compared to a year ago, chemical wholesale sales were up 23.9% and inventories were also up 23.9% Y/Y. The inventories-to-sales ratio rose from 1.09 in March to 1.10 in April. A year ago, it was also 1.10.
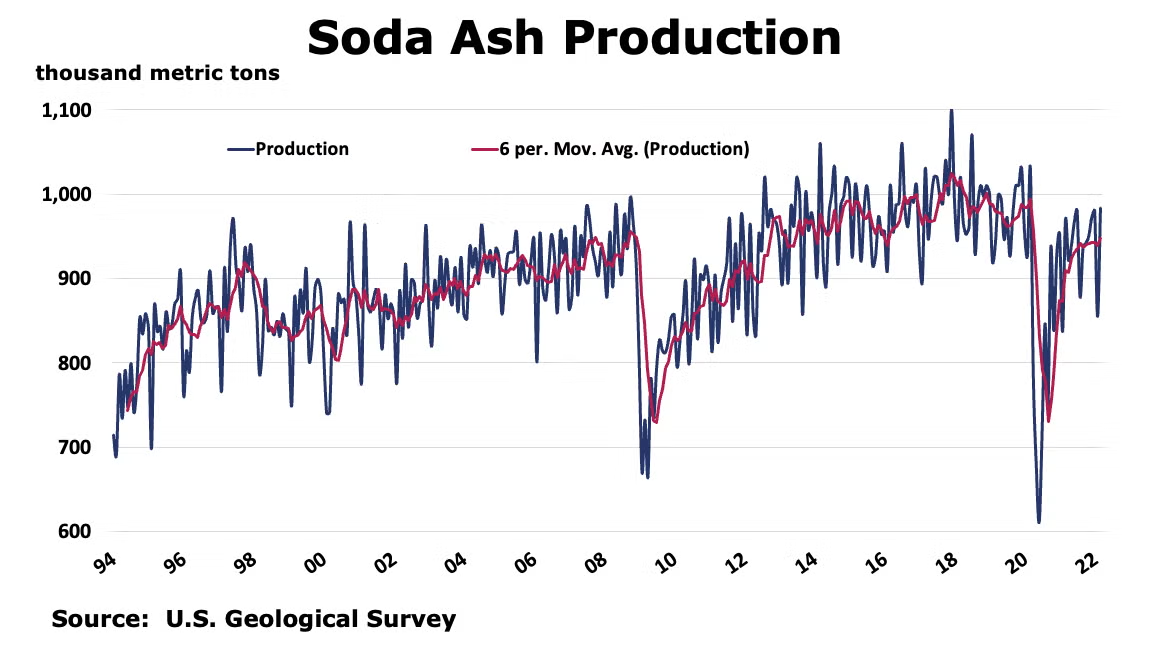
The U.S. Geological Survey reported that monthly production of soda ash in March was 983 thousand tons, up 15.0% compared to the previous month and up 1.4% Y/Y. Stocks rose 11.3% over February to 285 thousand tons at the end of the month, a 9-day supply. Ending stocks were up 21.3% Y/Y. Soda ash is used in the production of glass, chemicals, detergents, battery materials.
U.S. chemicals trade was down in April with imports falling harder than exports. Trade was down across all categories except imports of fertilizers and exports of inorganic chemicals which both increased month-over-month. Year-to-date comparisons for 2022 versus 2021 are still incredibly strong with chemical exports up 22% and imports up 35%.
Note On the Color Codes
The banner colors represent observations about the current conditions in the overall economy and the business chemistry. For the overall economy we keep a running tab of 20 indicators. The banner color for the macroeconomic section is determined as follows:
Green – 13 or more positives
Yellow – between 8 and 12 positives
Red – 7 or fewer positives
For the chemical industry there are fewer indicators available. As a result we rely upon judgment whether production in the industry (defined as chemicals excluding pharmaceuticals) has increased or decreased three consecutive months.
For More Information
ACC members can access additional data, economic analyses, presentations, outlooks, and weekly economic updates through MemberExchange.
In addition to this weekly report, ACC offers numerous other economic data that cover worldwide production, trade, shipments, inventories, price indices, energy, employment, investment, R&D, EH&S, financial performance measures, macroeconomic data, plus much more. To order, visit https://store.americanchemistry.com/.
Every effort has been made in the preparation of this weekly report to provide the best available information and analysis. However, neither the American Chemistry Council, nor any of its employees, agents or other assigns makes any warranty, expressed or implied, or assumes any liability or responsibility for any use, or the results of such use, of any information or data disclosed in this material.
Contact us at ACC_EconomicsDepartment@americanchemistry.com

