Running tab of macro indicators: 11 out of 20
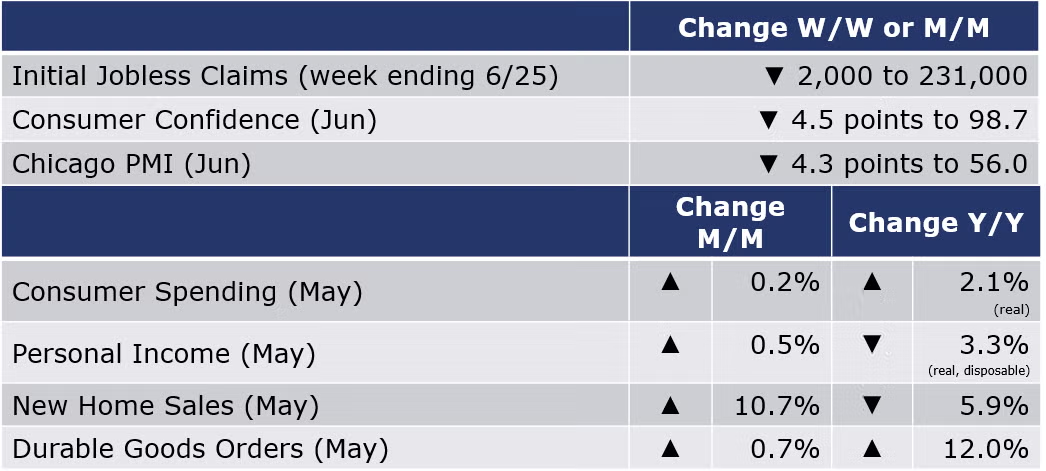
The number of new jobless claims fell by 2,000 to 231,000 during the week ending 25 June. Continued claims rose (by 17,836) to 1.29 million for the week ending 11 June. The insured unemployment rate for the week ending June 18 was 0.9%, slightly lower than the prior week (1.0%).
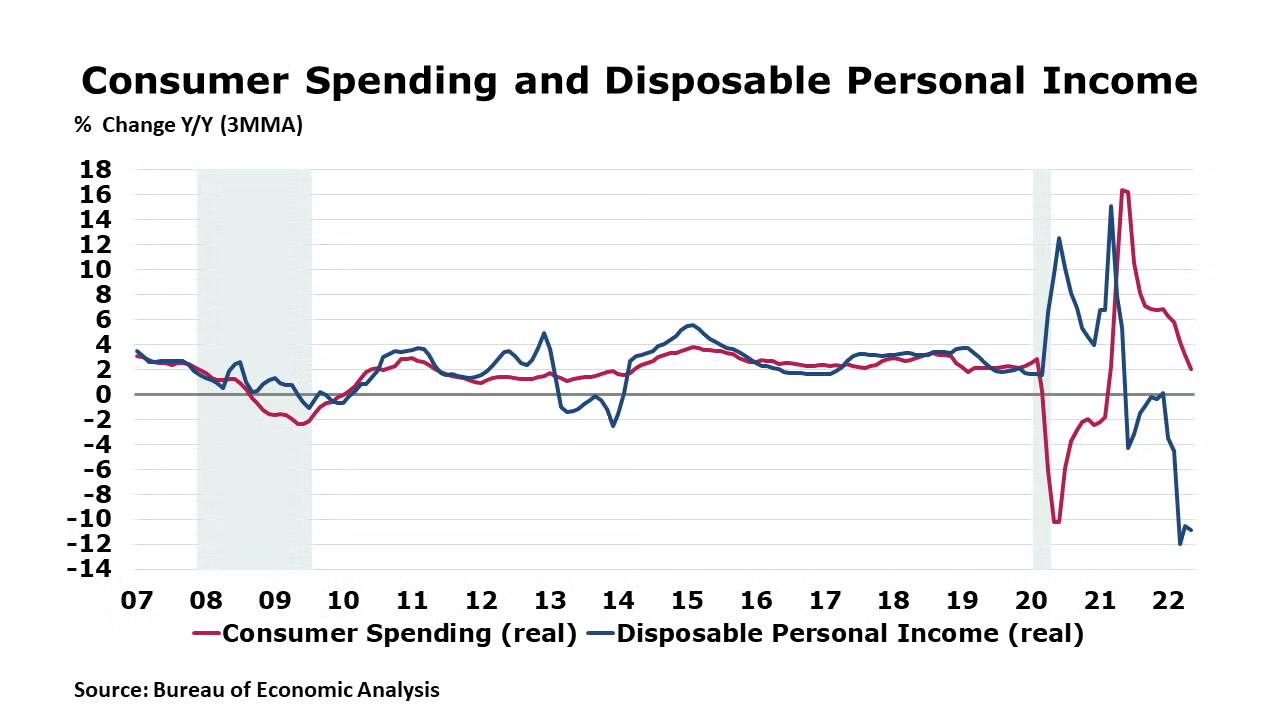
Consumer spending is slowing down. After rising 1.2% in March and 0.6% in April, personal consumption expenditures (PCE) rose 0.2% in May. The modest gain in May reflects an increase in spending on services that was partially offset by a fall in spending on goods. Within services, increases in housing and utilities (led by housing), "other" services (led by international travel), and health care (led by hospitals) were the largest contributors. Within goods, a decrease in spending on motor vehicles and parts (led by new motor vehicles) was partly offset by an increase in gasoline and other energy goods (led by motor vehicle fuels). Personal income rose 0.5% in May but after adjusting for inflation and taxes, it was 0.1% lower than the month before. The savings rate rose to 5.4%. Real disposable personal income was off 3.3% Y/Y and real consumer spending was up by 2.1% Y/Y. The closely-watched PCE price index was up 6.3% Y/Y. Excluding food and energy, the core PCE price index was up 4.7% Y/Y, the slowest pace since November, but still well-ahead of the Fed’s 2% target.
The Conference Board’s index of consumer confidence continued to weaken in June, falling 4.5 points to 98.7, a 16-month low. The expectations component fell sharply to its lowest level in 9 years as consumers struggle with high inflation, especially for gasoline. Plans to purchase a home, car, or appliance were essentially steady, though lower than several months ago.
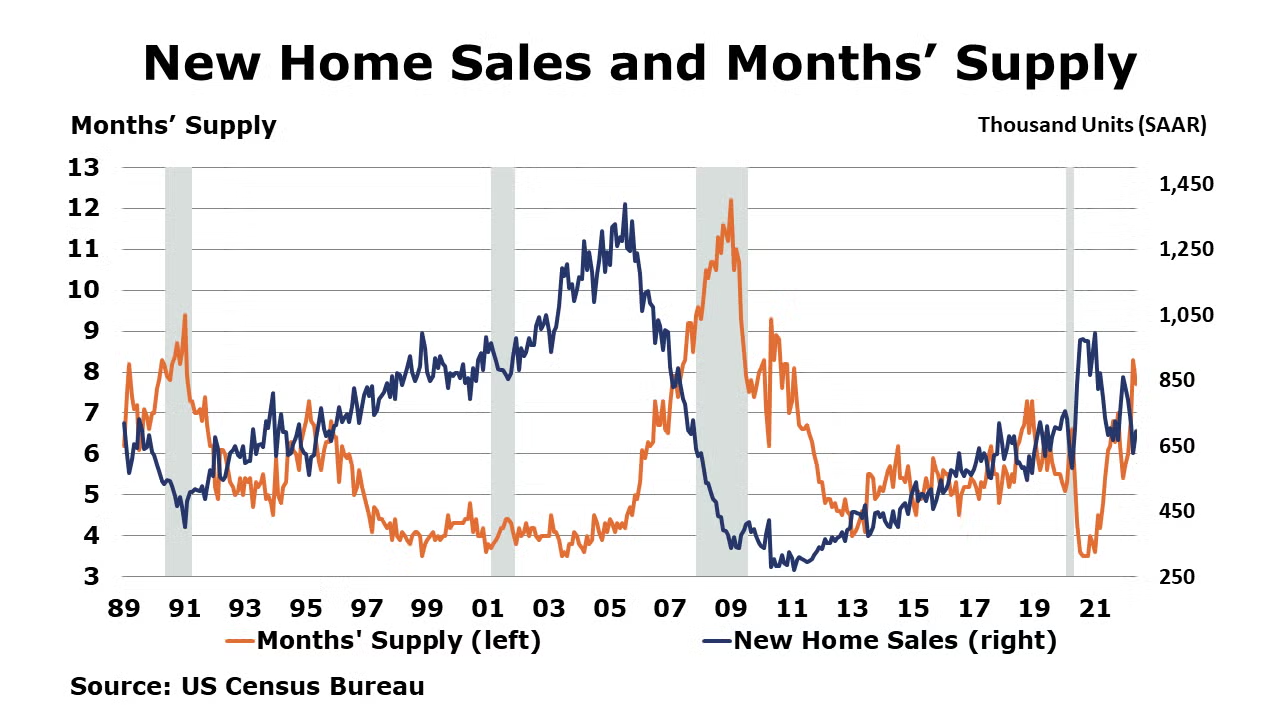
Following four straight months of declines, new home sales rose 10.7% in May. Sales rose in the South and West offsetting declines in the Northeast and Midwest. The surprise gain likely reflects a scramble by homebuyers to finalize contracts and lock in mortgage rates. In contrast to existing home sales which are recorded at closing, new home sales are recorded when contracts are executed, not necessarily when a home is built. Inventories edged higher and the months’ supply moved lower to 7.7 months (compared to 8.3 months in April). Compared to a year ago, new home sales were off 5.9% Y/Y. The median price of a new home was up by 15.0% to $449,000.
New durable goods orders rose 0.7% in May following a 0.4% gain in April. Gains were mixed with increases in orders for primary metals, machinery, communications equipment and motor vehicles & parts, offsetting declines in computers, electrical equipment and civilian aircraft. New orders for core business goods were up 0.5%, up from a 0.3% gain in April. Core orders were up 10.8% Y/Y while headline orders were up 12.0% Y/Y.
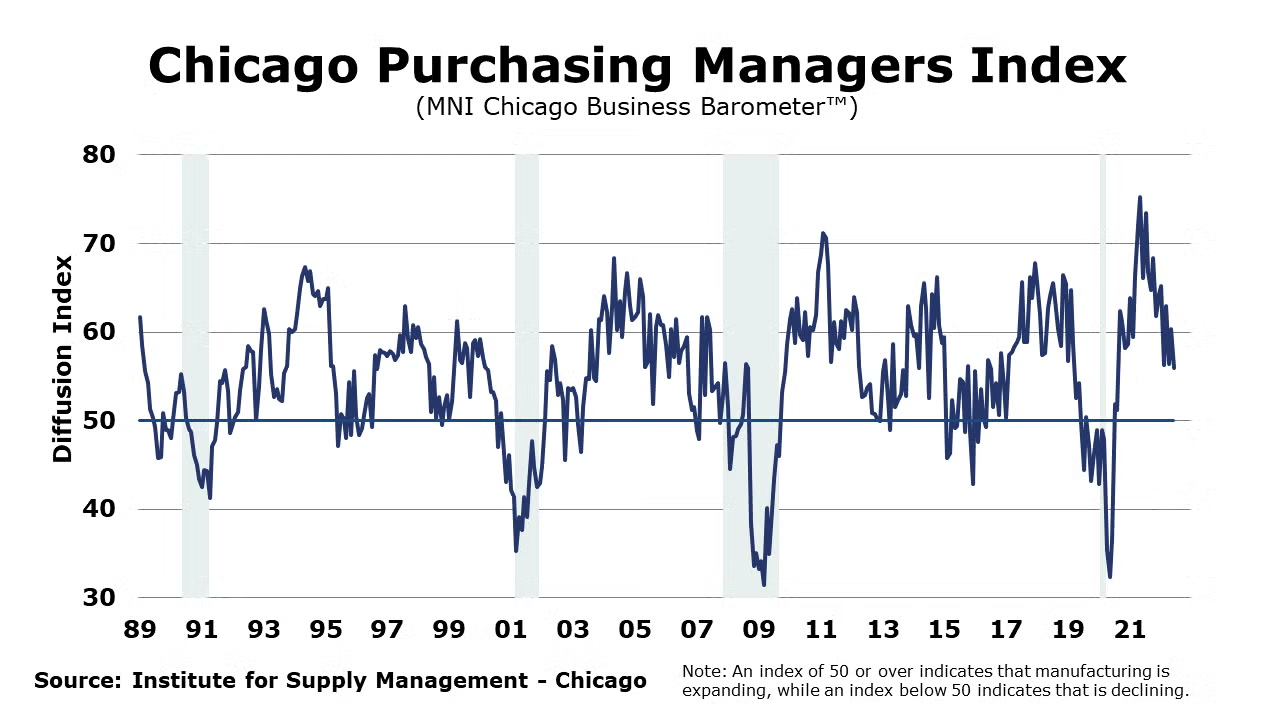
A first look at manufacturing activity in May, the Chicago PMI signaled a moderating expansion in manufacturing in that part of the country. The index, officially called the MNI Chicago Business Barometer™ fell 4.3 points to 56.0. As with other PMIs, a reading above 50 indicates an expansion, thus manufacturing expanded at a slower pace than in May.
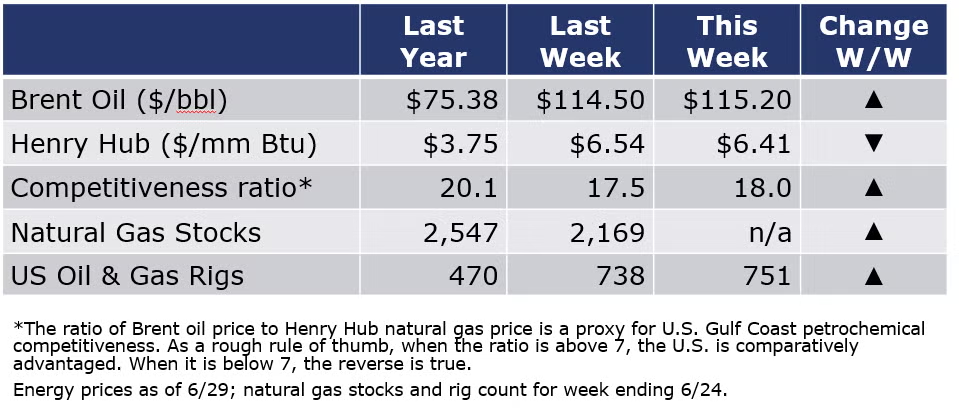
Energy prices remained volatile this week. Oil was up a bit compared to a week ago, while natural gas (at the Henry Hub) was lower. Oil inventories fell by more than expected as refineries work near full capacity to meet surging demand for gasoline and other petroleum products. EIA’s weekly refinery utilization rate was the highest in nearly three years at 95.0%. As oil prices have surged in recent months, the rig count has responded. At the end of last week (6/24), the rig count was up by 13 to 751. A year ago, the rig count was 470.
For the business of chemistry, the indicators still bring to mind a green banner for basic and specialty chemicals.
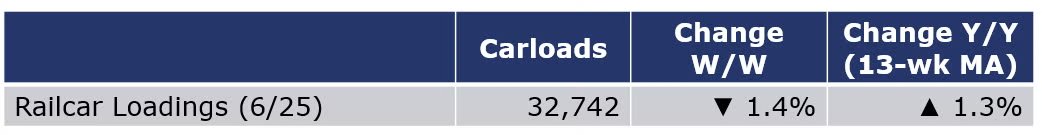
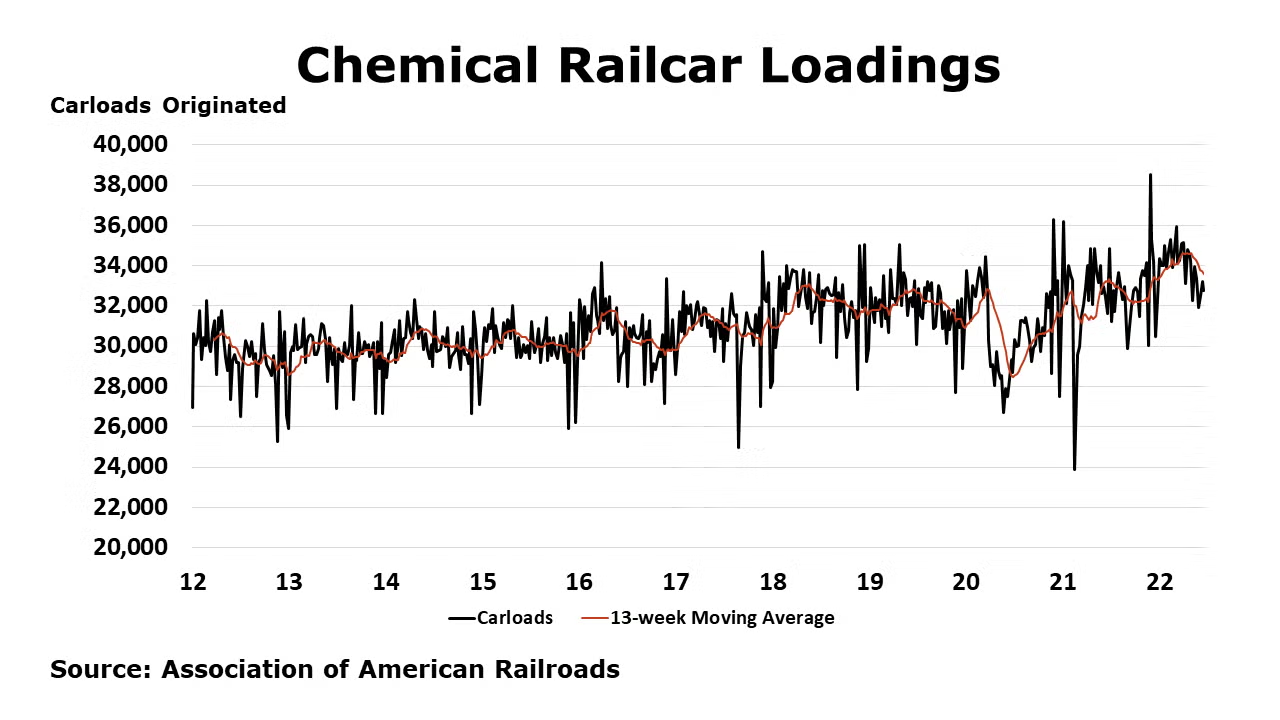
According to data released by the Association of American Railroads, chemical railcar loadings were down 1.4% for the week ending 25 June. Loadings were up 3.5% Y/Y (13-week MA), up 5.2% YTD/YTD and have been on the rise for six of the last 13 weeks.
Note On the Color Codes
The banner colors represent observations about the current conditions in the overall economy and the business chemistry. For the overall economy we keep a running tab of 20 indicators. The banner color for the macroeconomic section is determined as follows:
Green – 13 or more positives
Yellow – between 8 and 12 positives
Red – 7 or fewer positives
For the chemical industry there are fewer indicators available. As a result we rely upon judgment whether production in the industry (defined as chemicals excluding pharmaceuticals) has increased or decreased three consecutive months.
For More Information
ACC members can access additional data, economic analyses, presentations, outlooks, and weekly economic updates through MemberExchange.
In addition to this weekly report, ACC offers numerous other economic data that cover worldwide production, trade, shipments, inventories, price indices, energy, employment, investment, R&D, EH&S, financial performance measures, macroeconomic data, plus much more. To order, visit https://store.americanchemistry.com/.
Every effort has been made in the preparation of this weekly report to provide the best available information and analysis. However, neither the American Chemistry Council, nor any of its employees, agents or other assigns makes any warranty, expressed or implied, or assumes any liability or responsibility for any use, or the results of such use, of any information or data disclosed in this material.
Contact us at ACC_EconomicsDepartment@americanchemistry.com

